Business Development Project: Singapore's Fifth NEWater Plant Decision
VerifiedAdded on 2022/08/24
|13
|11287
|32
Project
AI Summary
This project delves into the decision-making process surrounding the construction of Singapore's fifth NEWater plant, a crucial component of the nation's water conservation strategy. The assignment, structured as a consultant report, applies decision analysis tools to evaluate the project before its execution, focusing on publicly available information. It begins with a detailed problem statement and clearly defined objectives, followed by the construction and analysis of a decision tree to assess potential outcomes and expected values. Risk profiles are developed to understand the uncertainties associated with the project, including the exploration of key uncertainties. Furthermore, the project examines multiple objectives, potential trade-offs, and attitudes toward risk that influenced the decision. The project culminates in a set of recommendations and conclusions based on the analysis, providing insights into the decision-making process and potential improvements. This project is a valuable resource for students studying business development and decision analysis, offering a practical application of theoretical concepts to a real-world scenario. The project is available on Desklib, a platform providing students with AI-based study tools, past papers and solved assignments.
See discussions, stats, and author profiles for this publication at: https://www.researchgate.net/publication/332134214
QMRA of adenovirus in drinking water at a drinking water treatment plant
using UV and chlorine dioxide disinfection
Article in Water Research · April 2019
DOI: 10.1016/j.watres.2019.03.090
CITATION
1
READS
172
6 authors, including:
Some of the authors of this publication are also working on these related projects:
Collaboration project between ZUMS and Utrecht UniversityView project
Antibiotics and mobile resistance elements in wastewater reuse applications: risks and innovative solutions (ANSWER)View project
Jack Schijven
National Institute for Public Health and the Environment (RIVM)
146PUBLICATIONS4,242CITATIONS
SEE PROFILE
Henk A. M. Ketelaars
Evides
47PUBLICATIONS1,410CITATIONS
SEE PROFILE
L.M. Hornstra
KWR Water Research Institute
25PUBLICATIONS455CITATIONS
SEE PROFILE
Paraphrase This Document
Need a fresh take? Get an instant paraphrase of this document with our AI Paraphraser
QMRA of adenovirus in drinking water at a drinking water treatment
plant using UV and chlorine dioxide disinfection
Jack Schijvena, b, * , Peter Teunisc
, Trudy Suylend
, Henk Ketelaarsd
, Luc Hornstrae
,
Saskia Rutjesa
a National Institute of Public Health and the Environment,Bilthoven,the Netherlands
b Department of Earth Sciences,University of Utrecht,Utrecht,the Netherlands
c Emory University,Atlanta,USA
d Evides Water Company,the Netherlands
e KWR Watercycle Research Institute,Nieuwegein,the Netherlands
a r t i c l e i n f o
Article history:
Received 22 January 2019
Received in revised form
26 March 2019
Accepted 27 March 2019
Available online 1 April 2019
Keywords:
Adenovirus
Chlorine dioxide disinfection
Drinking water
PCR
QMRA
a b s t r a c t
According to the Dutch Drinking Water Act of2011,Dutch drinking water suppliers must conduct a
Quantitative Microbial Risk Assessment (QMRA) for infection by the following index pathogens:
enterovirus,Campylobacter, Cryptosporidium and Giardia at least once every four years in order to assess
the microbial safety of drinking water. The health-based target for safe drinking water is set at less than
one infection per 10 000 persons per year.At Evides Water Company,concern has arisen whether their
drinking water treatment,mainly based on UV inactivation and chlorine dioxide,reduces levels of
adenovirus (AdV) sufficiently.The main objective was,therefore, to conduct a QMRA for AdV.Estimates
of the AdV concentrations in source water were based on enumeration of total AdV by integrated cell
culture PCR (iccPCR), most probable number PCR (mpnPCR) and quantitative PCR (qPCR),and on
enumeration of AdV40/41 by mpnPCR and qPCR.AdV40/41 represents a large fraction of total AdV and
only a small fraction of AdV is infectious (1/1700).By comparison of literature data and plant scale data,
somatic coliphages appeared a good,conservative indicator for AdV disinfection by UV irradiation.
Similarly,bacteriophage MS2 appeared to be a good,conservative indicator for disinfection by chlorine
dioxide.Literature data on the efficiency of chlorine dioxide disinfection were fitted with the extended
HOM model.Chlorine dioxide disinfection at low initial concentrations (0.05e0.1 mg/l) was found to be
the major treatment step,providing sufficient treatment on its own for compliance with the health-
based target.UV disinfection of AdV at 40 mJ/cm2 or 73 mJ/cm2 was insufficient without chlorine di-
oxide disinfection.
© 2019 Published by Elsevier Ltd.
1. Introduction
According to the Dutch Drinking Water Act of 2011,Dutch
drinking water suppliers must conduct a Quantitative Microbial
Risk Assessment (QMRA) for the so-called index pathogens
enterovirus,Campylobacter,Cryptosporidium and Giardia atleast
once every four years in order to assess the microbialsafety of
drinking water (Anonymous, 2011). In this QMRA, the health-based
target for microbiologically safe drinking water is set at less than
one infection per 10 000 persons per year,thereby following the
World Health Organization (WHO) Guidelines for Drinking-water
Quality (WHO, 2017).It is not feasible to conducta QMRA for
every waterborne pathogen,therefore, index pathogens were
chosen.If a drinking water treatment is effective in removing the
index pathogens,the drinking water is considered to be safe.
Nevertheless,in specific situations,this might not be the case.At
Evides Water Company, concern has arisen whether their drinking
water treatment reduces levels of adenovirus (AdV) sufficiently. In
the source water (water from a storage reservoir that is taken in for
drinking water production),AdV concentrations are highest from
January to April.AdV is known to be more persistent to UV radia-
tion than enteroviruses,the selected index viral pathogen (Hijnen
et al., 2006). UV radiation and chlorine dioxide (finaltreatment
step) are the major treatment steps employed by Evides at the
* Corresponding author. National Institute of Public Health and the Environment,
Bilthoven,the Netherlands.
E-mail address: jack.schijven@rivm.nl (J.Schijven).
Contents lists available at ScienceDirect
Water Research
j o u r n a lhomepage: w w w . e l s e v i e r . c o m / l o c a t e / w a t r e s
https://doi.org/10.1016/j.watres.2019.03.090
0043-1354/© 2019 Published by Elsevier Ltd.
Water Research 158 (2019) 34e45
drinking water treatment plant (DWTP) Berenplaat.
AdV is widespread in nature, infecting birds,mammals and
amphibians.To date,90 genotypes ofhuman adenoviruses have
been identified based on whole genome sequencing (Ismail et al.,
2018). Human adenoviruses have been classified into seven
groups (AeG) on the basis of their physical, chemical and biological
properties (Wold and Ison, 2013). Adenoviruses consist of a double-
stranded DNA genome in a non-enveloped icosahedral capsid with
a diameter of about 80 nm and unique fibres. Human adenoviruses
cause a wide range of infections with a spectrum of clinical mani-
festations, including the gastrointestinal tract, the respiratory tract,
the urinary tract and the eyes (Brandt et al., 1969; Bon et al., 1999;
Oh et al.,2003; Rodriguez-Baez et al.,2002).Serotypes 40 and 41
are a major cause of gastroenteritis worldwide,notably in devel-
oping communities, however, little is known about the presence of
these enteric adenoviruses in water sources largely because they
are not detectable by conventional cell culture (WHO, 2017). WHO
(2017) classifies AdV as having moderate health significance,long
persistence,moderate resistance to chlorine and high infectivity.
The main objective was to conducta QMRA for AdV in the
drinking water produced at DWPT Berenplaat.
In general, QMRA for a waterborne pathogen in drinking water
consists of determining the pathogen concentration in the source
water,its removal by treatment using data on the removal of the
pathogen or of a representative indicator organism, using drinking
water consumption data and a dose response relationship (WHO,
2017).For the adenovirus QMRA at Berenplaat,estimates ofthe
concentrations in source water were based on totalAdV concen-
trations as determined by integrated cellculture PCR (infectious
virus particles) and by most probable number PCR and quantitative
PCR (infectious as wellas non-infectious virus particles),and on
AdV40/41 concentrations as determined by most probable number
PCR and quantitative PCR.Here,it was an additional objective to
compare PCR data generated as most probable numbers with those
generated as genome copies.On the one hand,inhibition of poly-
merase causes underestimation with quantitative PCR, but not with
most probable number PCR. On the other hand, aggregates of virus
particles cause underestimation with most probable number PCR,
but not with quantitative PCR.In the QMRA for enterovirus,as is
conducted in the Netherlands by the drinking water companies, F-
specific RNA bacteriophages or somatic coliphages are the default
indicator organisms for determining the efficiency oftreatment
steps in the drinking water production to remove enteroviruses
(Schijven et al.,2011).The data on these indicators were used to
determine removalefficiency by coagulation followed by sludge
blanket clarification and rapid double-layered filtration (sand/
anthracite). In order to estimate the efficiency of UV radiation,so-
matic coliphage concentration measurements were conducted at
plant scale and compared with literature data on disinfection of
AdV by UV in order to evaluate somatic coliphages as surrogate for
UV disinfection of AdV. In addition, the efficiency of medium
pressure lamps emitting an UV dose of 40 mJ/cm2 and 73 mJ/cm2
were compared. Estimating the efficiency of chlorine dioxide
disinfection relied on data from literature and additional laboratory
experiments in order to evaluate MS2 bacteriophage as a surrogate
for chlorine dioxide disinfection of AdV.Because of a notable sea-
sonal variation of AdV concentrations in the source water and a
different dosage of chlorine dioxide during winter time (Octo-
bereMarch) and summer time (AprileSeptember), all source water
concentration data and alltreatment data were split into winter
and summer time data and distributions were fitted to winter and
summer data separately. Effectivity of the drinking water treatment
was evaluated on the basis of the contribution of UV irradiation and
chlorine dioxide disinfection to the total treatment.
2. Drinking water treatment description
DWTP Berenplaat provides 100 million m3 of drinking water
each year and supplies water to a large proportion of Rotterdam's
homes and companies. River Meuse water is stored in the Biesbosch
storage reservoirs with an average retention time of five months to
improve its chemicaland biologicalquality by naturalprocesses
such as degradation and sedimentation. About 12,000 m3
/h of this
water is transported to DWTP Berenplaat,where it passes a short
water abstraction channelprior to treatment.Pathogen concen-
trations in Berenplaat-Petrusplaat(the final Biesbosch storage
reservoir) water are the starting point for QMRA. Berenplaat water
first passes micro-sieves (mesh size 35mm) and is then treated by
coagulation/sludge blanket clarification and rapid double layered
filtration.The major disinfection takes place in two parallel arrays
of medium pressure UV lamps,one at 40 mJ/cm2 and the other at
73 mJ/cm2
. It is assumed that the UV lamps provide a constant dose.
The setpoint UV-dose for the target disinfection capacity is
continuously maintained in the reactor by automatic adjustment of
the UV-lamps’power setting i.e.emission intensity,according to
variations in operating conditions such as influent water quality
(UV-transmission) and flow rate.After UV treatment,the water
passes granular activated carbon filters.Hijnen et al.(2010) found
no removal of bacteriophage MS2 by granular activated carbon
filters at pilot plant scale at this DWTP. Hence, this treatment step is
considered to be irrelevant in the QMRA for AdV.The final treat-
ment consists of disinfection with 0.1 mg/lchlorine dioxide in
summer and 0.05 mg/lchlorine dioxide in winter. The finished
water is stored in closed reservoirs prior to distribution.
3. Materials and methods
3.1.Adenovirus enumeration
Throughout this document,total AdV is referred to as AdVtot,
AdV40 and AdV41 are referred to as AdV40/41. All enumerations are
PCR methods.Integrated cell culture PCR,most probable number
PCR and (real time) quantitative PCR are designated as icc, mpn and
q, respectively.The following enumerations were conducted:
AdVtoticc, AdVtotmpn, AdVtotq,AdV40/41mpn and AdV40/41q.
3.2. Sampling and concentration by UF
Thirty-five samples of water (approximately 600 L) were
collected from the finalstorage reservoir prior to drinking water
treatment and concentrated by a conventionalfilter adsorption-
elution method as previously described (Rutjeset al., 2009).
Briefly,magnesium chloride was added to the water sample to a
final concentration of 0.05 M to enable the formation of a virus-
magnesium complex.By reducing the pH to 3.8 with 0.5 M HCl,
these complexes adsorb to a negatively charged cartridge filter with
a nominal pore size of 1.2mm. Viruses were eluted from the filter
with an elution buffer of pH 9.0, and were neutralized with a
concentrated acetic acid buffer (pH 5.0) resulting in a final eluate
with a pH of approximately 7.4.The eluate was further concen-
trated by ultrafiltration (UF) using a cellulose-acetate filter (NMWL
10 000) under high pressure (3 bar) (Rutjes et al.,2005).The final
UF-concentrate volume was usually between 50 and 75 mland
sometimes up to 250 ml. The concentrate was stored at 70C until
further use.
3.3. AdVtoticc
Human AdV-2 was kindly provided by the group of Dr. Franco M.
Ruggeri (Istituto Superiore de Sanita, Rome, Italy) to use as positive
J. Schijven et al./ Water Research 158 (2019) 34e45 35
⊘ This is a preview!⊘
Do you want full access?
Subscribe today to unlock all pages.
Trusted by 1+ million students worldwide
control virus.
Infectious adenoviruses were enumerated by integrated cell
culture PCR. UF-concentrates were quickly thawed at 37C. In order
to inactivate bacteria, the UF-concentrates were supplemented 1/5
(v/v) with a mixture of antibiotics (final concentrations: 579mg/ml
penicillin G,4476 U/ml streptomycin sulfate,72 mg/ml amphoter-
icin B, 2.9 mg/ml kanamycin monosulphate and 576mg/ml
neomycin) and incubated for 1 h at room temperature in the dark.
For each UF-concentrate,A549 cells (ATTC-CCL-185)were
grown to confluent monolayers in cell culture flasks (25 cm2
) with
1 MEM (Invitrogen) supplemented with 10% fetalcalf serum
(Invitrogen), 1% penicillin/streptomycin and 1% non-essential
amino acids (Invitrogen).The numbers of flasks that were inocu-
lated with undiluted UF-concentrate varied from 9 till 31, the
numbers of 1/10 diluted samples varied from 3 till 18,and occa-
sionally 1/100 and 1/1000 dilutions were analyzed. UF-
concentrate/antibiotic mixtures were incubated on A549 cells for
1 h at 37C with 1 ml inoculum of UF-concentrate. Every time, one
flask was not inoculated to serve as a negative control.Then,cell
cultures were washed 3 times with warmed phosphate buffered
saline and 5 ml of warmed 1 MEM containing 2% fetal calf serum
was added. Per sample, three flasks inoculated with undiluted
sample were immediately frozen (T0), the other flasks and the
negative control flask were further incubated for 5 days at 37C,
followed by storage at 70 C until further use.
For PCR enumeration virus stocks were obtained by three
freezeethaw cycles of infected cells and subsequent centrifugation
at 1500g for 5 min. Of each supernatant, 140ml was used for nucleic
acid extraction.Nucleic acid was extracted using the NucliSens
miniMag magnetic extraction kit(bioMerieux, Zaltbommel,The
Netherlands) following the manufacturer's instructions with minor
modifications.In each extraction cycle,a negative controlcon-
taining no target was included. A Lightcycler 480 (Roche Di-
agnostics,Almere, The Netherlands) was used for realtime PCR
with TaqMan hydrolysis probes.To control for PCR inhibition, a
competitive internal amplification control (IAC) (Yorkshire Biosci-
ence Ltd., York, UK), specific for the AdVtot PCR (Diez-Valcarce et al.,
2011),was added to each reaction at a concentration previously
found not to influence the detection of the target signal. Instead of
FAM, VIC was used as a reporter dye of the IAC. Detection of AdVtot
DNA was performed as described by Verhaelen et al. (2012).
3.4. Extraction detection of viral DNA
Genomic material was isolated from 12.5ml UF-concentrate
(corresponding to 30 mle150 mlof the storage reservoir water).
The Nuclisens miniMAG Nucleic Acid Isolation Kit (bioMerieux,
Zaltbommel, the Netherlands) was used as described (Rutjes et al.,
2005). DNA was eluted in 100ml elution buffer and stored at 70C.
3.5. AdVtotq and AdV40/41q
Quantification of AdVtot and AdV40/41 was performed by real-
time quantitative PCR using a Lightcycler 480 (Roche Diagnostics,
Almere,The Netherlands).For AdVtot detection,the hexon gene
was targeted by forward primer (900 nM) CWT ACA TGC ACA TCK
CSG G, reverse primer (900 nM) CRC GGG CRA AYT GCA CCA G and
probe (11.25mM) (FAM)-CCG GGC TCA GGT ACT CCG AGG CGT CCT-
(BHQ1) (Hernroth et al.,2002).For AdV40/41 detection,the fiber
gene was targeted by forward primer (450 nM) CTT TCT CTC TT (A/
C) ATA GAC GCC C, reverse primer (22.5mM) GAG GGG GCT A (G/C)
AAA ACA AAA and probe (450 nM) (FAM)-CGG GCA CTC TTC GCC
TTC AAA GTG C-(BHQ-1) (Jothikumar et al.,2005).
AdVtot and AdV40/41 were amplified using the TaqMan Uni-
versal PCR Master Mix (Applied Biosystems) combined with
TaqMan hydrolysis probes as has been described by Bofill-Mas et al.
(2010). Neat and a tenfold dilution of the DNA extracts were run in
duplicate (4 reactions/sample).
AdVtot was quantified using plasmid pBR322 containing the
HAdV 41 hexon sequence as a qPCR standard to quantify the
number of genome copies in the samples (Bofill-Mas et al.,2010).
AdV40/41 was quantified as described by Jothikumar et al. (2005).
3.6. AdVtotmpn and AdV40/41mpn
Presence/absence data of AdVtot and AdV40/41 were obtained
by qPCR for the hexon and fiber gene, respectively.
3.7. Somatic coliphages enumeration
Influent and effluent samples of the first three treatment steps,
coagulation/sludge blanket clarification,rapid sand filtration and
UV disinfection (40 and 73 mJ/cm2
) were collected weekly to
monthly from 2009 to 2012 for enumeration of somatic coliphages
according to ISO 10705-2 (2000). Sample sizes varied from 0.03 L to
40 L for coagulation/sludge blanket clarification, from 0.1 L to 160 L
for rapid sand filtration and from 0.1 L to 1900 L for UV disinfection.
4. Data analysis
All computational analyses were conducted using Mathematica
(version 11.1.1.0, Wolfram Inc,Illinois).
4.1.Scenarios
Twelve risk assessments were conducted,namely using the vi-
rus source concentrations of AdVtoticc, AdV40/41mpn and AdV40/
41q,applying a UV dose of 40 mJ/cm2 or 73 mJ/cm2
, and with or
without chlorine dioxide disinfection.
4.2. Virus source concentration estimation
Best estimates of most probable numbers per sample were used
to calculate sample concentrations, to which, subsequently, Gamma
distributions were fitted (Schijven et al.,2011).To the data from
qPCR enumeration (genome copies per litre) a negative binomial
distribution was fitted from which a Gamma distributed concen-
tration was derived as described by Schijven et al. (2011).
To the paired positive AdVtoticc and AdVtotmpn samples,as
well as to the paired positive AdVtoticc and AdVtotq samples, Beta
distributions were fitted as described for determining recovery
efficiency by Schijven et al.(2011).These Beta distributions repre-
sent the fractions of infectious virus particles,based on either
mpnPCR or qPCR data.For each Gamma distribution (winter and
summer), ten thousand Monte Carlo (MC) samples were generated.
MC samples of infectious AdV40/41 virus particles were calculated
by multiplying the Gamma-distributed concentration dataof
AdV40/41mpn and AdV40/41q with the Beta-distributed fractions
of infectious virus particles based on mpnPCR and qPCR data,
respectively.
For comparing with other fractions of infectious virus particles,
literature data on enumeration of rotavirus by means of iccPCR and
mpnPCR in samples from the River Meuse (Rutjes et al., 2009) and
enterovirus (Lodder et al.,2015) by means oftissue culture and
mpnPCR were collected and their ratio was determined by fitting a
Beta distribution as well as described here above.
J. Schijven et al./ Water Research 158 (2019) 34e4536
Paraphrase This Document
Need a fresh take? Get an instant paraphrase of this document with our AI Paraphraser
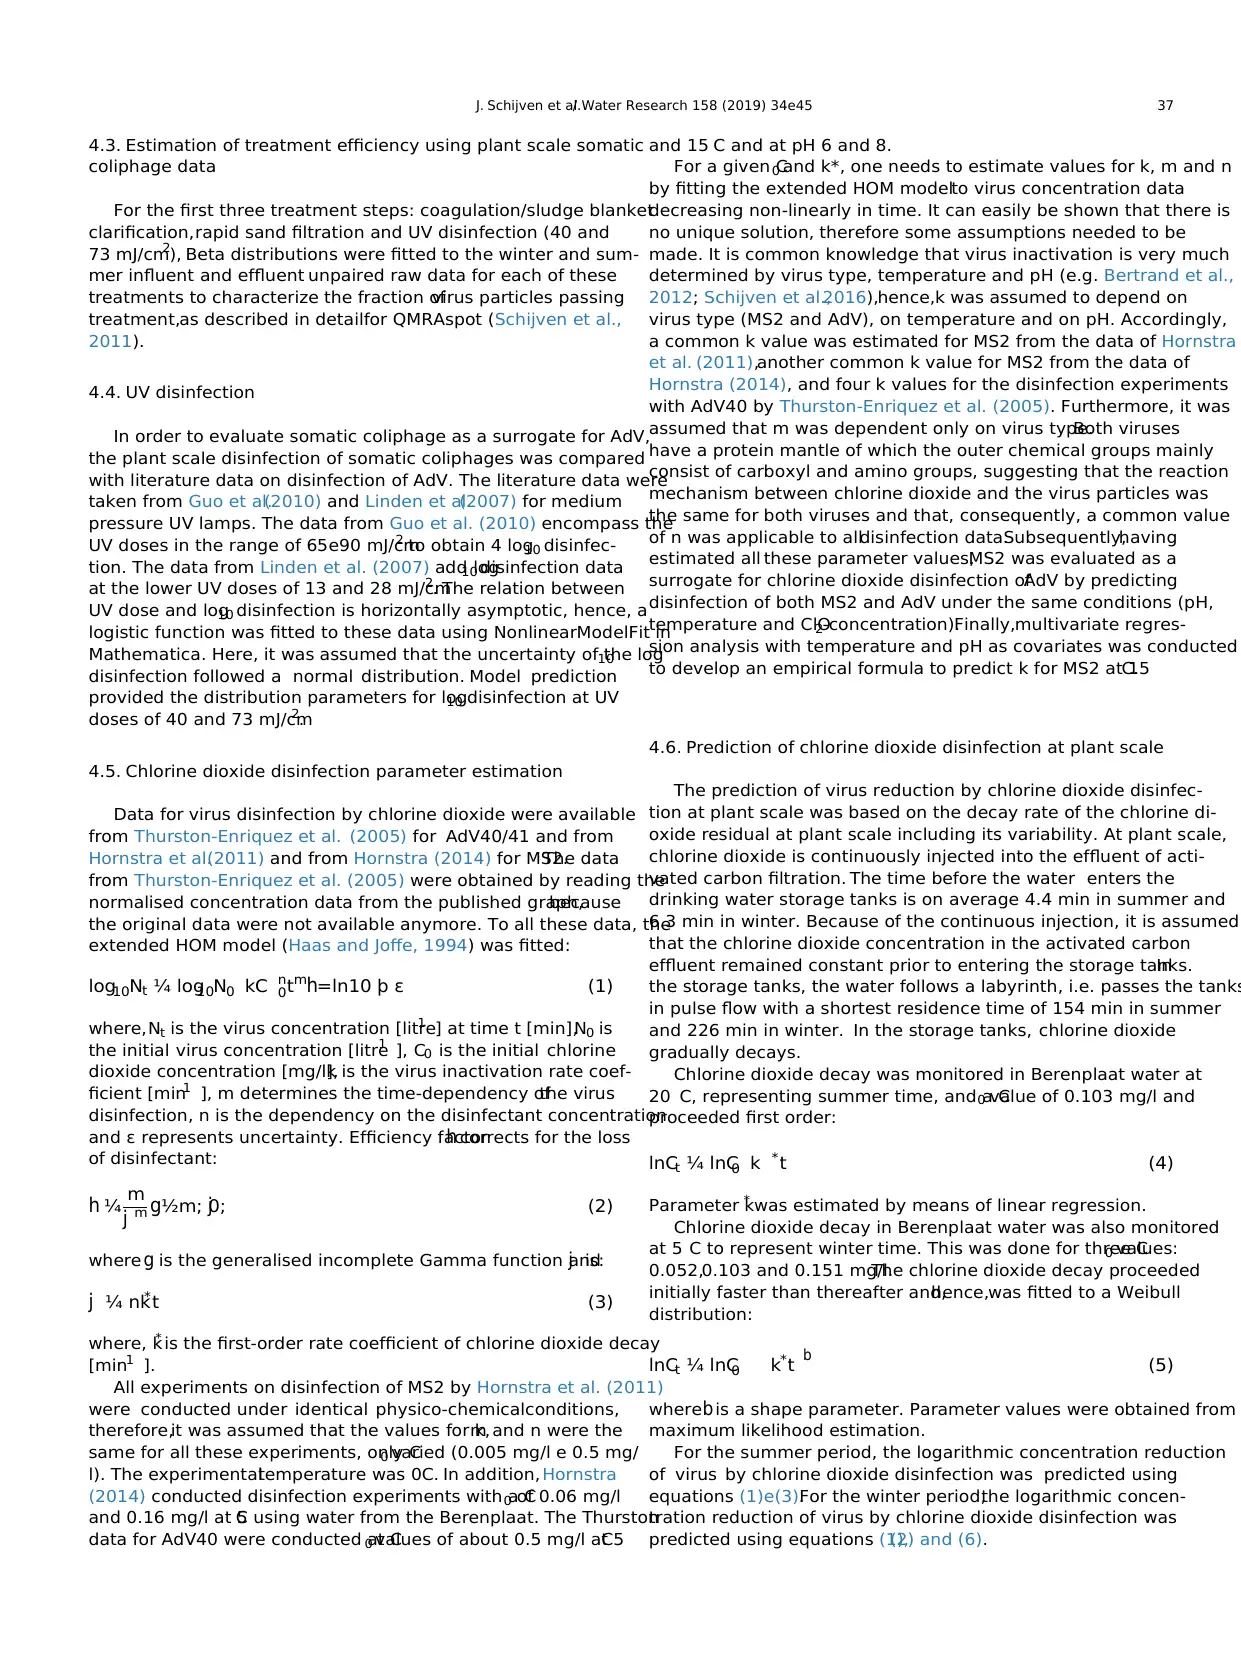
4.3. Estimation of treatment efficiency using plant scale somatic
coliphage data
For the first three treatment steps: coagulation/sludge blanket
clarification,rapid sand filtration and UV disinfection (40 and
73 mJ/cm2
), Beta distributions were fitted to the winter and sum-
mer influent and effluent unpaired raw data for each of these
treatments to characterize the fraction ofvirus particles passing
treatment,as described in detailfor QMRAspot (Schijven et al.,
2011).
4.4. UV disinfection
In order to evaluate somatic coliphage as a surrogate for AdV,
the plant scale disinfection of somatic coliphages was compared
with literature data on disinfection of AdV. The literature data were
taken from Guo et al.(2010) and Linden et al.(2007) for medium
pressure UV lamps. The data from Guo et al. (2010) encompass the
UV doses in the range of 65e90 mJ/cm2 to obtain 4 log10 disinfec-
tion. The data from Linden et al. (2007) add log10 disinfection data
at the lower UV doses of 13 and 28 mJ/cm2
. The relation between
UV dose and log10 disinfection is horizontally asymptotic, hence, a
logistic function was fitted to these data using NonlinearModelFit in
Mathematica. Here, it was assumed that the uncertainty of the log10
disinfection followed a normal distribution. Model prediction
provided the distribution parameters for log10 disinfection at UV
doses of 40 and 73 mJ/cm2
.
4.5. Chlorine dioxide disinfection parameter estimation
Data for virus disinfection by chlorine dioxide were available
from Thurston-Enriquez et al. (2005) for AdV40/41 and from
Hornstra et al.(2011) and from Hornstra (2014) for MS2.The data
from Thurston-Enriquez et al. (2005) were obtained by reading the
normalised concentration data from the published graph,because
the original data were not available anymore. To all these data, the
extended HOM model (Haas and Joffe, 1994) was fitted:
log10Nt ¼ log10N0 kC n
0 tm
h=ln10 þ ε (1)
where,Nt is the virus concentration [litre1 ] at time t [min],N0 is
the initial virus concentration [litre1 ], C0 is the initial chlorine
dioxide concentration [mg/l],k is the virus inactivation rate coef-
ficient [min1 ], m determines the time-dependency ofthe virus
disinfection, n is the dependency on the disinfectant concentration
and ε represents uncertainty. Efficiency factorh corrects for the loss
of disinfectant:
h ¼ m
j m g½m; 0;j (2)
where g is the generalised incomplete Gamma function andj is:
j ¼ nk* t (3)
where, k* is the first-order rate coefficient of chlorine dioxide decay
[min1 ].
All experiments on disinfection of MS2 by Hornstra et al. (2011)
were conducted under identical physico-chemicalconditions,
therefore,it was assumed that the values for k,m and n were the
same for all these experiments, only C0 varied (0.005 mg/l e 0.5 mg/
l). The experimentaltemperature was 0C. In addition, Hornstra
(2014) conducted disinfection experiments with a C0 of 0.06 mg/l
and 0.16 mg/l at 5C using water from the Berenplaat. The Thurston
data for AdV40 were conducted at C0 values of about 0.5 mg/l at 5C
and 15 C and at pH 6 and 8.
For a given C0 and k*, one needs to estimate values for k, m and n
by fitting the extended HOM modelto virus concentration data
decreasing non-linearly in time. It can easily be shown that there is
no unique solution, therefore some assumptions needed to be
made. It is common knowledge that virus inactivation is very much
determined by virus type, temperature and pH (e.g. Bertrand et al.,
2012; Schijven et al.,2016),hence,k was assumed to depend on
virus type (MS2 and AdV), on temperature and on pH. Accordingly,
a common k value was estimated for MS2 from the data of Hornstra
et al. (2011),another common k value for MS2 from the data of
Hornstra (2014), and four k values for the disinfection experiments
with AdV40 by Thurston-Enriquez et al. (2005). Furthermore, it was
assumed that m was dependent only on virus type.Both viruses
have a protein mantle of which the outer chemical groups mainly
consist of carboxyl and amino groups, suggesting that the reaction
mechanism between chlorine dioxide and the virus particles was
the same for both viruses and that, consequently, a common value
of n was applicable to alldisinfection data.Subsequently,having
estimated all these parameter values,MS2 was evaluated as a
surrogate for chlorine dioxide disinfection ofAdV by predicting
disinfection of both MS2 and AdV under the same conditions (pH,
temperature and ClO2-concentration).Finally,multivariate regres-
sion analysis with temperature and pH as covariates was conducted
to develop an empirical formula to predict k for MS2 at 15C.
4.6. Prediction of chlorine dioxide disinfection at plant scale
The prediction of virus reduction by chlorine dioxide disinfec-
tion at plant scale was based on the decay rate of the chlorine di-
oxide residual at plant scale including its variability. At plant scale,
chlorine dioxide is continuously injected into the effluent of acti-
vated carbon filtration. The time before the water enters the
drinking water storage tanks is on average 4.4 min in summer and
6.3 min in winter. Because of the continuous injection, it is assumed
that the chlorine dioxide concentration in the activated carbon
effluent remained constant prior to entering the storage tanks.In
the storage tanks, the water follows a labyrinth, i.e. passes the tanks
in pulse flow with a shortest residence time of 154 min in summer
and 226 min in winter. In the storage tanks, chlorine dioxide
gradually decays.
Chlorine dioxide decay was monitored in Berenplaat water at
20 C, representing summer time, and a C0 value of 0.103 mg/l and
proceeded first order:
lnCt ¼ lnC0 k * t (4)
Parameter k* was estimated by means of linear regression.
Chlorine dioxide decay in Berenplaat water was also monitored
at 5 C to represent winter time. This was done for three C0 values:
0.052,0.103 and 0.151 mg/l.The chlorine dioxide decay proceeded
initially faster than thereafter and,hence,was fitted to a Weibull
distribution:
lnCt ¼ lnC0 k* t b (5)
where b is a shape parameter. Parameter values were obtained from
maximum likelihood estimation.
For the summer period, the logarithmic concentration reduction
of virus by chlorine dioxide disinfection was predicted using
equations (1)e(3).For the winter period,the logarithmic concen-
tration reduction of virus by chlorine dioxide disinfection was
predicted using equations (1),(2) and (6).
J. Schijven et al./ Water Research 158 (2019) 34e45 37
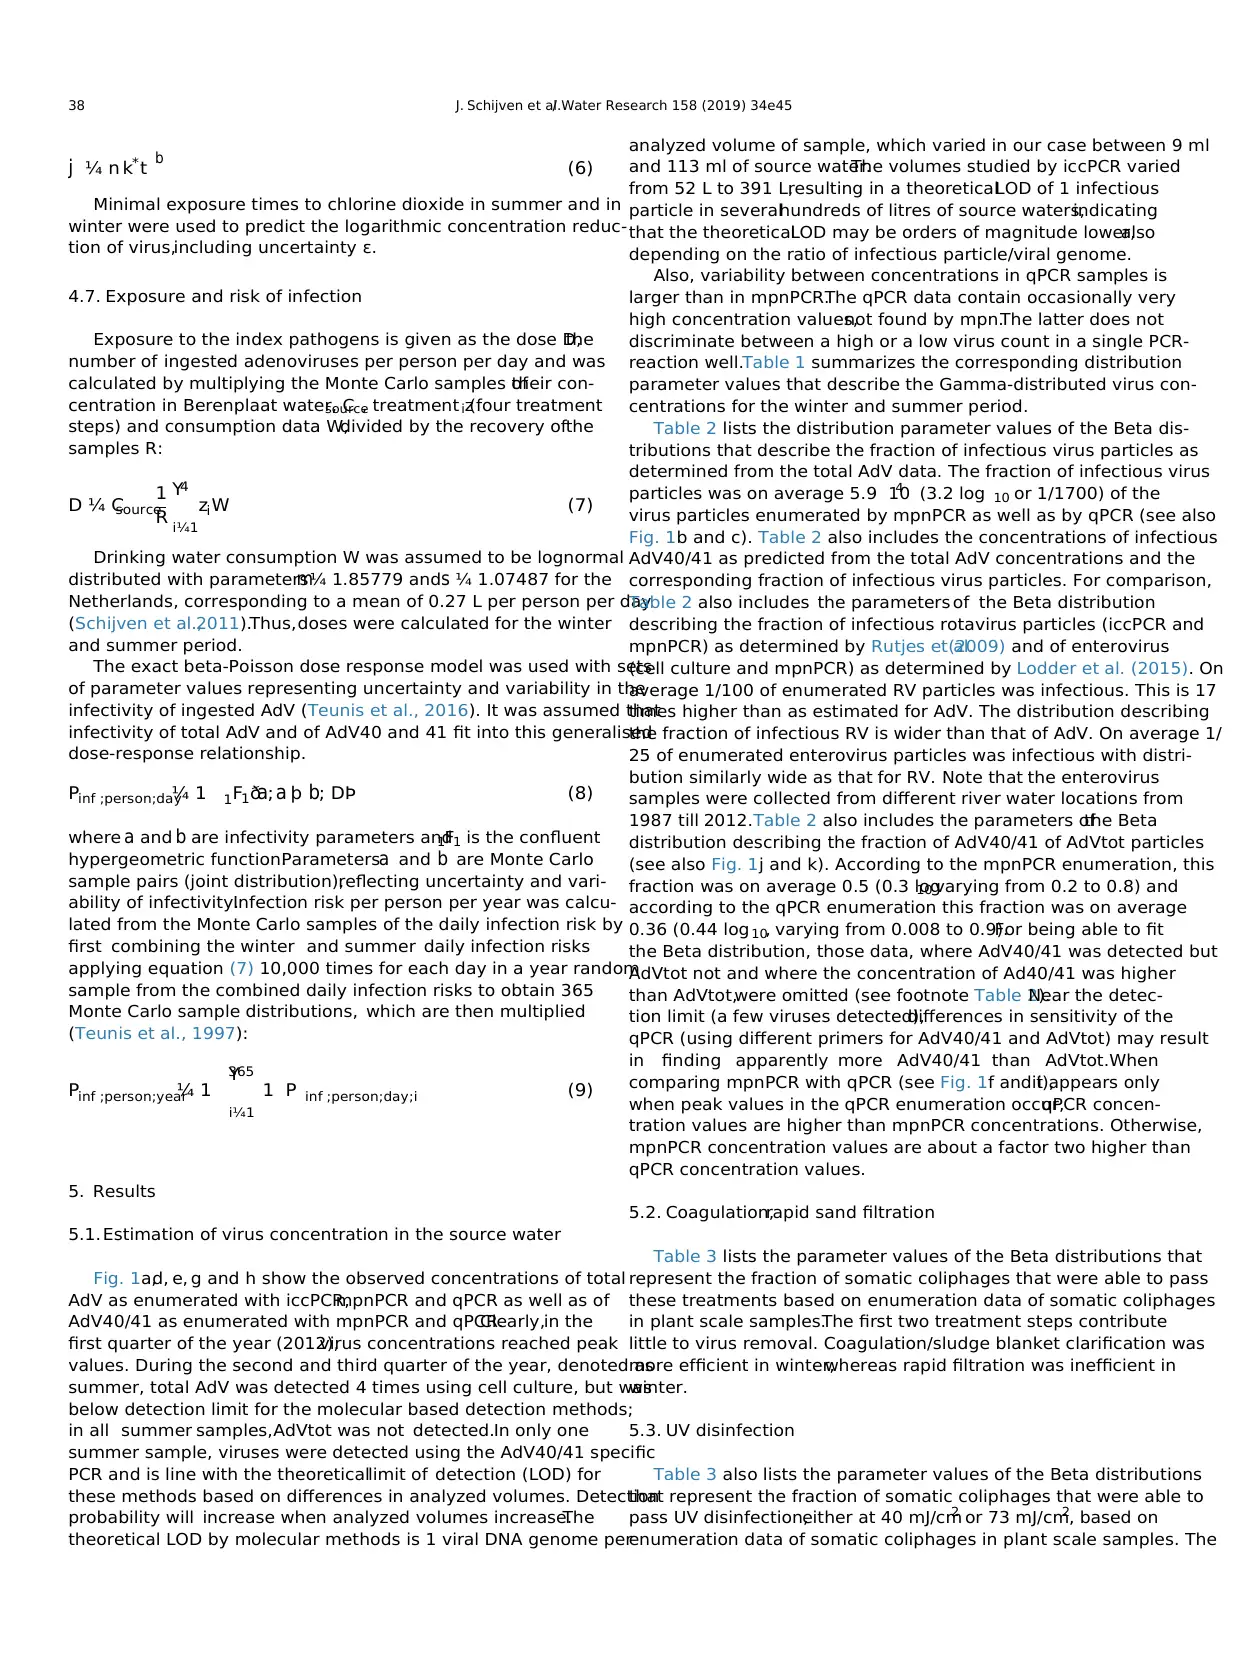
j ¼ n k* t b (6)
Minimal exposure times to chlorine dioxide in summer and in
winter were used to predict the logarithmic concentration reduc-
tion of virus,including uncertainty ε.
4.7. Exposure and risk of infection
Exposure to the index pathogens is given as the dose D,the
number of ingested adenoviruses per person per day and was
calculated by multiplying the Monte Carlo samples oftheir con-
centration in Berenplaat water, Csource, treatment zi (four treatment
steps) and consumption data W,divided by the recovery ofthe
samples R:
D ¼ Csource
1
R
Y4
i¼1
zi W (7)
Drinking water consumption W was assumed to be lognormal
distributed with parametersm¼ 1.85779 ands ¼ 1.07487 for the
Netherlands, corresponding to a mean of 0.27 L per person per day
(Schijven et al.,2011).Thus,doses were calculated for the winter
and summer period.
The exact beta-Poisson dose response model was used with sets
of parameter values representing uncertainty and variability in the
infectivity of ingested AdV (Teunis et al., 2016). It was assumed that
infectivity of total AdV and of AdV40 and 41 fit into this generalised
dose-response relationship.
Pinf ;person;day¼ 1 1 F1 ða; a þ b; DÞ (8)
where a and b are infectivity parameters and1F1 is the confluent
hypergeometric function.Parametersa and b are Monte Carlo
sample pairs (joint distribution),reflecting uncertainty and vari-
ability of infectivity.Infection risk per person per year was calcu-
lated from the Monte Carlo samples of the daily infection risk by
first combining the winter and summer daily infection risks
applying equation (7) 10,000 times for each day in a year random
sample from the combined daily infection risks to obtain 365
Monte Carlo sample distributions, which are then multiplied
(Teunis et al., 1997):
Pinf ;person;year¼ 1 Y365
i¼1
1 P inf ;person;day;i (9)
5. Results
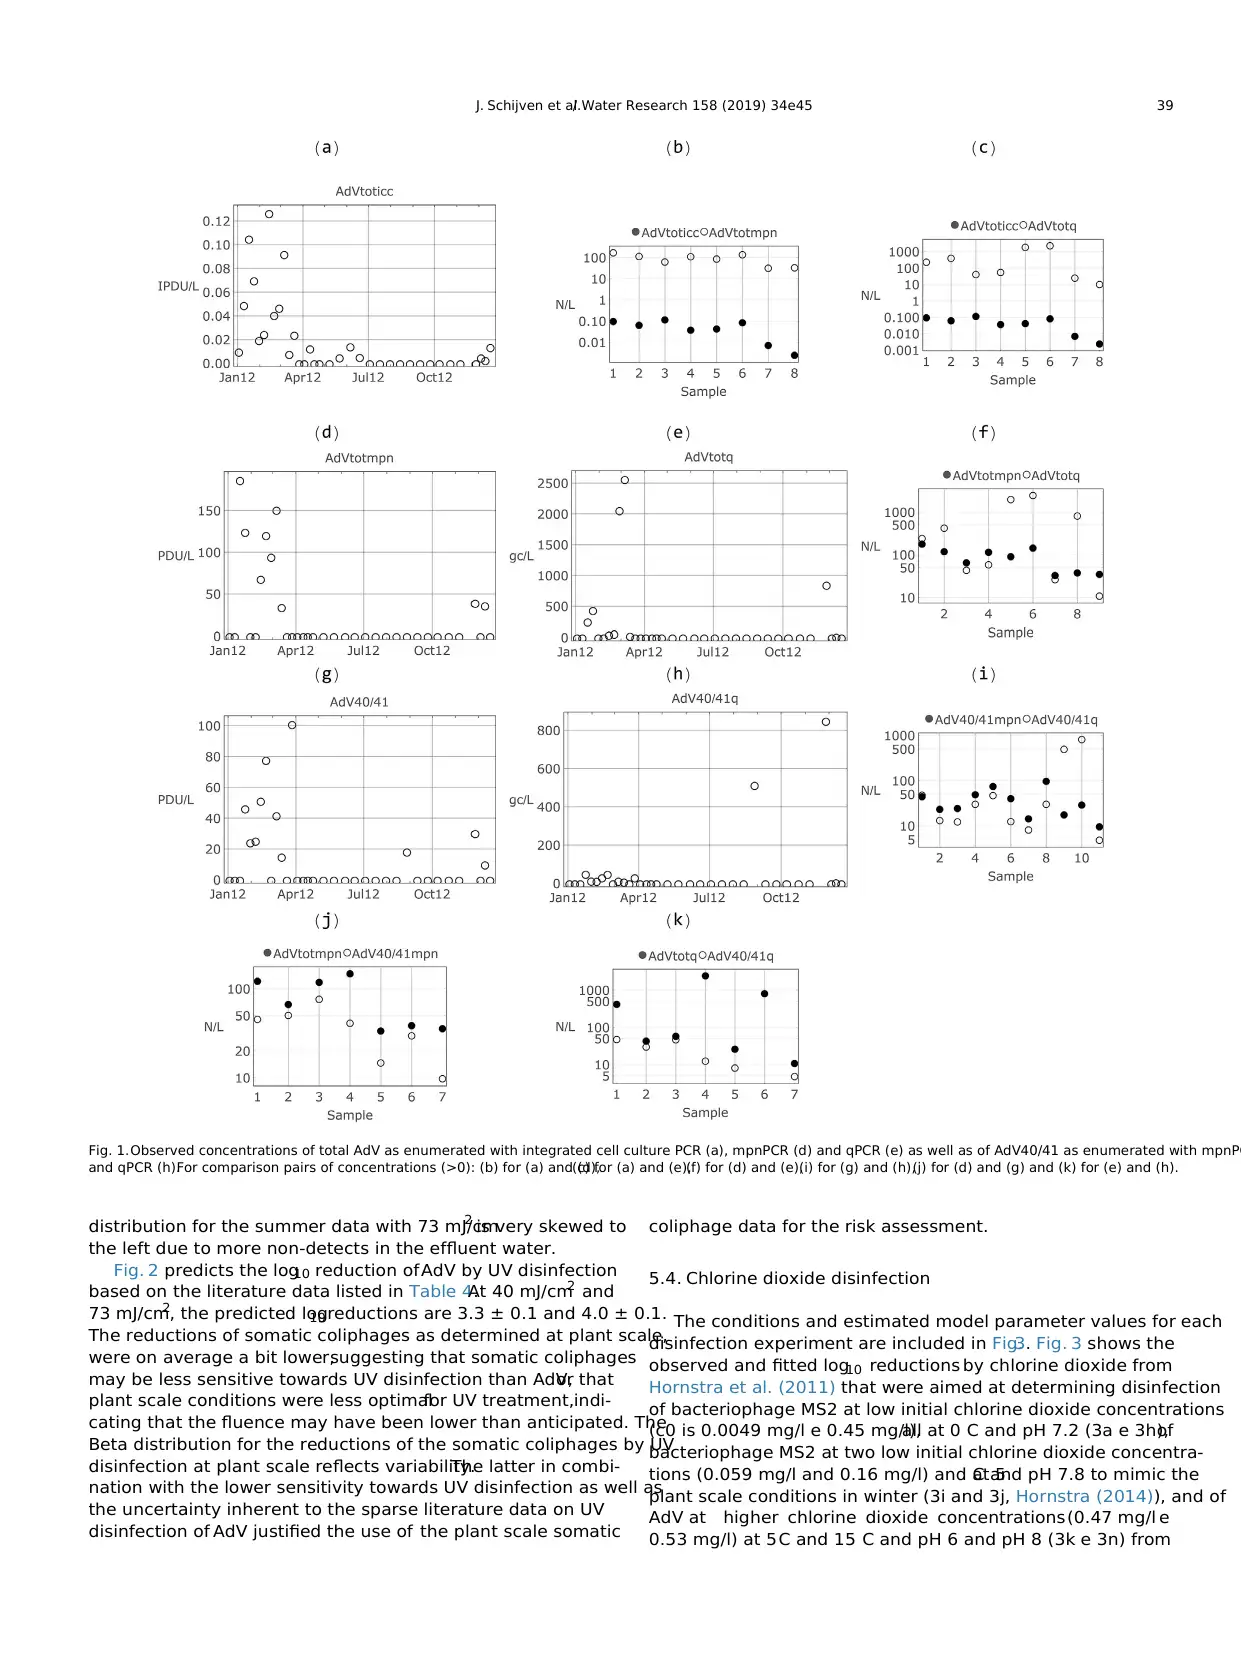
5.1. Estimation of virus concentration in the source water
Fig. 1a,d, e, g and h show the observed concentrations of total
AdV as enumerated with iccPCR,mpnPCR and qPCR as well as of
AdV40/41 as enumerated with mpnPCR and qPCR.Clearly,in the
first quarter of the year (2012),virus concentrations reached peak
values. During the second and third quarter of the year, denoted as
summer, total AdV was detected 4 times using cell culture, but was
below detection limit for the molecular based detection methods;
in all summer samples,AdVtot was not detected.In only one
summer sample, viruses were detected using the AdV40/41 specific
PCR and is line with the theoreticallimit of detection (LOD) for
these methods based on differences in analyzed volumes. Detection
probability will increase when analyzed volumes increase.The
theoretical LOD by molecular methods is 1 viral DNA genome per
analyzed volume of sample, which varied in our case between 9 ml
and 113 ml of source water.The volumes studied by iccPCR varied
from 52 L to 391 L,resulting in a theoreticalLOD of 1 infectious
particle in severalhundreds of litres of source waters,indicating
that the theoreticalLOD may be orders of magnitude lower,also
depending on the ratio of infectious particle/viral genome.
Also, variability between concentrations in qPCR samples is
larger than in mpnPCR.The qPCR data contain occasionally very
high concentration values,not found by mpn.The latter does not
discriminate between a high or a low virus count in a single PCR-
reaction well.Table 1 summarizes the corresponding distribution
parameter values that describe the Gamma-distributed virus con-
centrations for the winter and summer period.
Table 2 lists the distribution parameter values of the Beta dis-
tributions that describe the fraction of infectious virus particles as
determined from the total AdV data. The fraction of infectious virus
particles was on average 5.9 104 (3.2 log 10 or 1/1700) of the
virus particles enumerated by mpnPCR as well as by qPCR (see also
Fig. 1b and c). Table 2 also includes the concentrations of infectious
AdV40/41 as predicted from the total AdV concentrations and the
corresponding fraction of infectious virus particles. For comparison,
Table 2 also includes the parameters of the Beta distribution
describing the fraction of infectious rotavirus particles (iccPCR and
mpnPCR) as determined by Rutjes et al.(2009) and of enterovirus
(cell culture and mpnPCR) as determined by Lodder et al. (2015). On
average 1/100 of enumerated RV particles was infectious. This is 17
times higher than as estimated for AdV. The distribution describing
the fraction of infectious RV is wider than that of AdV. On average 1/
25 of enumerated enterovirus particles was infectious with distri-
bution similarly wide as that for RV. Note that the enterovirus
samples were collected from different river water locations from
1987 till 2012.Table 2 also includes the parameters ofthe Beta
distribution describing the fraction of AdV40/41 of AdVtot particles
(see also Fig. 1j and k). According to the mpnPCR enumeration, this
fraction was on average 0.5 (0.3 log10 varying from 0.2 to 0.8) and
according to the qPCR enumeration this fraction was on average
0.36 (0.44 log 10, varying from 0.008 to 0.9).For being able to fit
the Beta distribution, those data, where AdV40/41 was detected but
AdVtot not and where the concentration of Ad40/41 was higher
than AdVtot,were omitted (see footnote Table 2).Near the detec-
tion limit (a few viruses detected),differences in sensitivity of the
qPCR (using different primers for AdV40/41 and AdVtot) may result
in finding apparently more AdV40/41 than AdVtot.When
comparing mpnPCR with qPCR (see Fig. 1f and i),it appears only
when peak values in the qPCR enumeration occur,qPCR concen-
tration values are higher than mpnPCR concentrations. Otherwise,
mpnPCR concentration values are about a factor two higher than
qPCR concentration values.
5.2. Coagulation,rapid sand filtration
Table 3 lists the parameter values of the Beta distributions that
represent the fraction of somatic coliphages that were able to pass
these treatments based on enumeration data of somatic coliphages
in plant scale samples.The first two treatment steps contribute
little to virus removal. Coagulation/sludge blanket clarification was
more efficient in winter,whereas rapid filtration was inefficient in
winter.
5.3. UV disinfection
Table 3 also lists the parameter values of the Beta distributions
that represent the fraction of somatic coliphages that were able to
pass UV disinfection,either at 40 mJ/cm2 or 73 mJ/cm2
, based on
enumeration data of somatic coliphages in plant scale samples. The
J. Schijven et al./ Water Research 158 (2019) 34e4538
Minimal exposure times to chlorine dioxide in summer and in
winter were used to predict the logarithmic concentration reduc-
tion of virus,including uncertainty ε.
4.7. Exposure and risk of infection
Exposure to the index pathogens is given as the dose D,the
number of ingested adenoviruses per person per day and was
calculated by multiplying the Monte Carlo samples oftheir con-
centration in Berenplaat water, Csource, treatment zi (four treatment
steps) and consumption data W,divided by the recovery ofthe
samples R:
D ¼ Csource
1
R
Y4
i¼1
zi W (7)
Drinking water consumption W was assumed to be lognormal
distributed with parametersm¼ 1.85779 ands ¼ 1.07487 for the
Netherlands, corresponding to a mean of 0.27 L per person per day
(Schijven et al.,2011).Thus,doses were calculated for the winter
and summer period.
The exact beta-Poisson dose response model was used with sets
of parameter values representing uncertainty and variability in the
infectivity of ingested AdV (Teunis et al., 2016). It was assumed that
infectivity of total AdV and of AdV40 and 41 fit into this generalised
dose-response relationship.
Pinf ;person;day¼ 1 1 F1 ða; a þ b; DÞ (8)
where a and b are infectivity parameters and1F1 is the confluent
hypergeometric function.Parametersa and b are Monte Carlo
sample pairs (joint distribution),reflecting uncertainty and vari-
ability of infectivity.Infection risk per person per year was calcu-
lated from the Monte Carlo samples of the daily infection risk by
first combining the winter and summer daily infection risks
applying equation (7) 10,000 times for each day in a year random
sample from the combined daily infection risks to obtain 365
Monte Carlo sample distributions, which are then multiplied
(Teunis et al., 1997):
Pinf ;person;year¼ 1 Y365
i¼1
1 P inf ;person;day;i (9)
5. Results
5.1. Estimation of virus concentration in the source water
Fig. 1a,d, e, g and h show the observed concentrations of total
AdV as enumerated with iccPCR,mpnPCR and qPCR as well as of
AdV40/41 as enumerated with mpnPCR and qPCR.Clearly,in the
first quarter of the year (2012),virus concentrations reached peak
values. During the second and third quarter of the year, denoted as
summer, total AdV was detected 4 times using cell culture, but was
below detection limit for the molecular based detection methods;
in all summer samples,AdVtot was not detected.In only one
summer sample, viruses were detected using the AdV40/41 specific
PCR and is line with the theoreticallimit of detection (LOD) for
these methods based on differences in analyzed volumes. Detection
probability will increase when analyzed volumes increase.The
theoretical LOD by molecular methods is 1 viral DNA genome per
analyzed volume of sample, which varied in our case between 9 ml
and 113 ml of source water.The volumes studied by iccPCR varied
from 52 L to 391 L,resulting in a theoreticalLOD of 1 infectious
particle in severalhundreds of litres of source waters,indicating
that the theoreticalLOD may be orders of magnitude lower,also
depending on the ratio of infectious particle/viral genome.
Also, variability between concentrations in qPCR samples is
larger than in mpnPCR.The qPCR data contain occasionally very
high concentration values,not found by mpn.The latter does not
discriminate between a high or a low virus count in a single PCR-
reaction well.Table 1 summarizes the corresponding distribution
parameter values that describe the Gamma-distributed virus con-
centrations for the winter and summer period.
Table 2 lists the distribution parameter values of the Beta dis-
tributions that describe the fraction of infectious virus particles as
determined from the total AdV data. The fraction of infectious virus
particles was on average 5.9 104 (3.2 log 10 or 1/1700) of the
virus particles enumerated by mpnPCR as well as by qPCR (see also
Fig. 1b and c). Table 2 also includes the concentrations of infectious
AdV40/41 as predicted from the total AdV concentrations and the
corresponding fraction of infectious virus particles. For comparison,
Table 2 also includes the parameters of the Beta distribution
describing the fraction of infectious rotavirus particles (iccPCR and
mpnPCR) as determined by Rutjes et al.(2009) and of enterovirus
(cell culture and mpnPCR) as determined by Lodder et al. (2015). On
average 1/100 of enumerated RV particles was infectious. This is 17
times higher than as estimated for AdV. The distribution describing
the fraction of infectious RV is wider than that of AdV. On average 1/
25 of enumerated enterovirus particles was infectious with distri-
bution similarly wide as that for RV. Note that the enterovirus
samples were collected from different river water locations from
1987 till 2012.Table 2 also includes the parameters ofthe Beta
distribution describing the fraction of AdV40/41 of AdVtot particles
(see also Fig. 1j and k). According to the mpnPCR enumeration, this
fraction was on average 0.5 (0.3 log10 varying from 0.2 to 0.8) and
according to the qPCR enumeration this fraction was on average
0.36 (0.44 log 10, varying from 0.008 to 0.9).For being able to fit
the Beta distribution, those data, where AdV40/41 was detected but
AdVtot not and where the concentration of Ad40/41 was higher
than AdVtot,were omitted (see footnote Table 2).Near the detec-
tion limit (a few viruses detected),differences in sensitivity of the
qPCR (using different primers for AdV40/41 and AdVtot) may result
in finding apparently more AdV40/41 than AdVtot.When
comparing mpnPCR with qPCR (see Fig. 1f and i),it appears only
when peak values in the qPCR enumeration occur,qPCR concen-
tration values are higher than mpnPCR concentrations. Otherwise,
mpnPCR concentration values are about a factor two higher than
qPCR concentration values.
5.2. Coagulation,rapid sand filtration
Table 3 lists the parameter values of the Beta distributions that
represent the fraction of somatic coliphages that were able to pass
these treatments based on enumeration data of somatic coliphages
in plant scale samples.The first two treatment steps contribute
little to virus removal. Coagulation/sludge blanket clarification was
more efficient in winter,whereas rapid filtration was inefficient in
winter.
5.3. UV disinfection
Table 3 also lists the parameter values of the Beta distributions
that represent the fraction of somatic coliphages that were able to
pass UV disinfection,either at 40 mJ/cm2 or 73 mJ/cm2
, based on
enumeration data of somatic coliphages in plant scale samples. The
J. Schijven et al./ Water Research 158 (2019) 34e4538
⊘ This is a preview!⊘
Do you want full access?
Subscribe today to unlock all pages.
Trusted by 1+ million students worldwide
distribution for the summer data with 73 mJ/cm2 is very skewed to
the left due to more non-detects in the effluent water.
Fig. 2 predicts the log10 reduction of AdV by UV disinfection
based on the literature data listed in Table 4.At 40 mJ/cm2 and
73 mJ/cm2
, the predicted log10 reductions are 3.3 ± 0.1 and 4.0 ± 0.1.
The reductions of somatic coliphages as determined at plant scale,
were on average a bit lower,suggesting that somatic coliphages
may be less sensitive towards UV disinfection than AdV,or that
plant scale conditions were less optimalfor UV treatment,indi-
cating that the fluence may have been lower than anticipated. The
Beta distribution for the reductions of the somatic coliphages by UV
disinfection at plant scale reflects variability.The latter in combi-
nation with the lower sensitivity towards UV disinfection as well as
the uncertainty inherent to the sparse literature data on UV
disinfection of AdV justified the use of the plant scale somatic
coliphage data for the risk assessment.
5.4. Chlorine dioxide disinfection
The conditions and estimated model parameter values for each
disinfection experiment are included in Fig.3. Fig. 3 shows the
observed and fitted log10 reductions by chlorine dioxide from
Hornstra et al. (2011) that were aimed at determining disinfection
of bacteriophage MS2 at low initial chlorine dioxide concentrations
(c0 is 0.0049 mg/l e 0.45 mg/l),all at 0 C and pH 7.2 (3a e 3h),of
bacteriophage MS2 at two low initial chlorine dioxide concentra-
tions (0.059 mg/l and 0.16 mg/l) and at 5C and pH 7.8 to mimic the
plant scale conditions in winter (3i and 3j, Hornstra (2014)), and of
AdV at higher chlorine dioxide concentrations(0.47 mg/l e
0.53 mg/l) at 5C and 15 C and pH 6 and pH 8 (3k e 3n) from
Fig. 1.Observed concentrations of total AdV as enumerated with integrated cell culture PCR (a), mpnPCR (d) and qPCR (e) as well as of AdV40/41 as enumerated with mpnPC
and qPCR (h).For comparison pairs of concentrations (>0): (b) for (a) and (d),(c) for (a) and (e),(f) for (d) and (e),(i) for (g) and (h),(j) for (d) and (g) and (k) for (e) and (h).
J. Schijven et al./ Water Research 158 (2019) 34e45 39
Paraphrase This Document
Need a fresh take? Get an instant paraphrase of this document with our AI Paraphraser
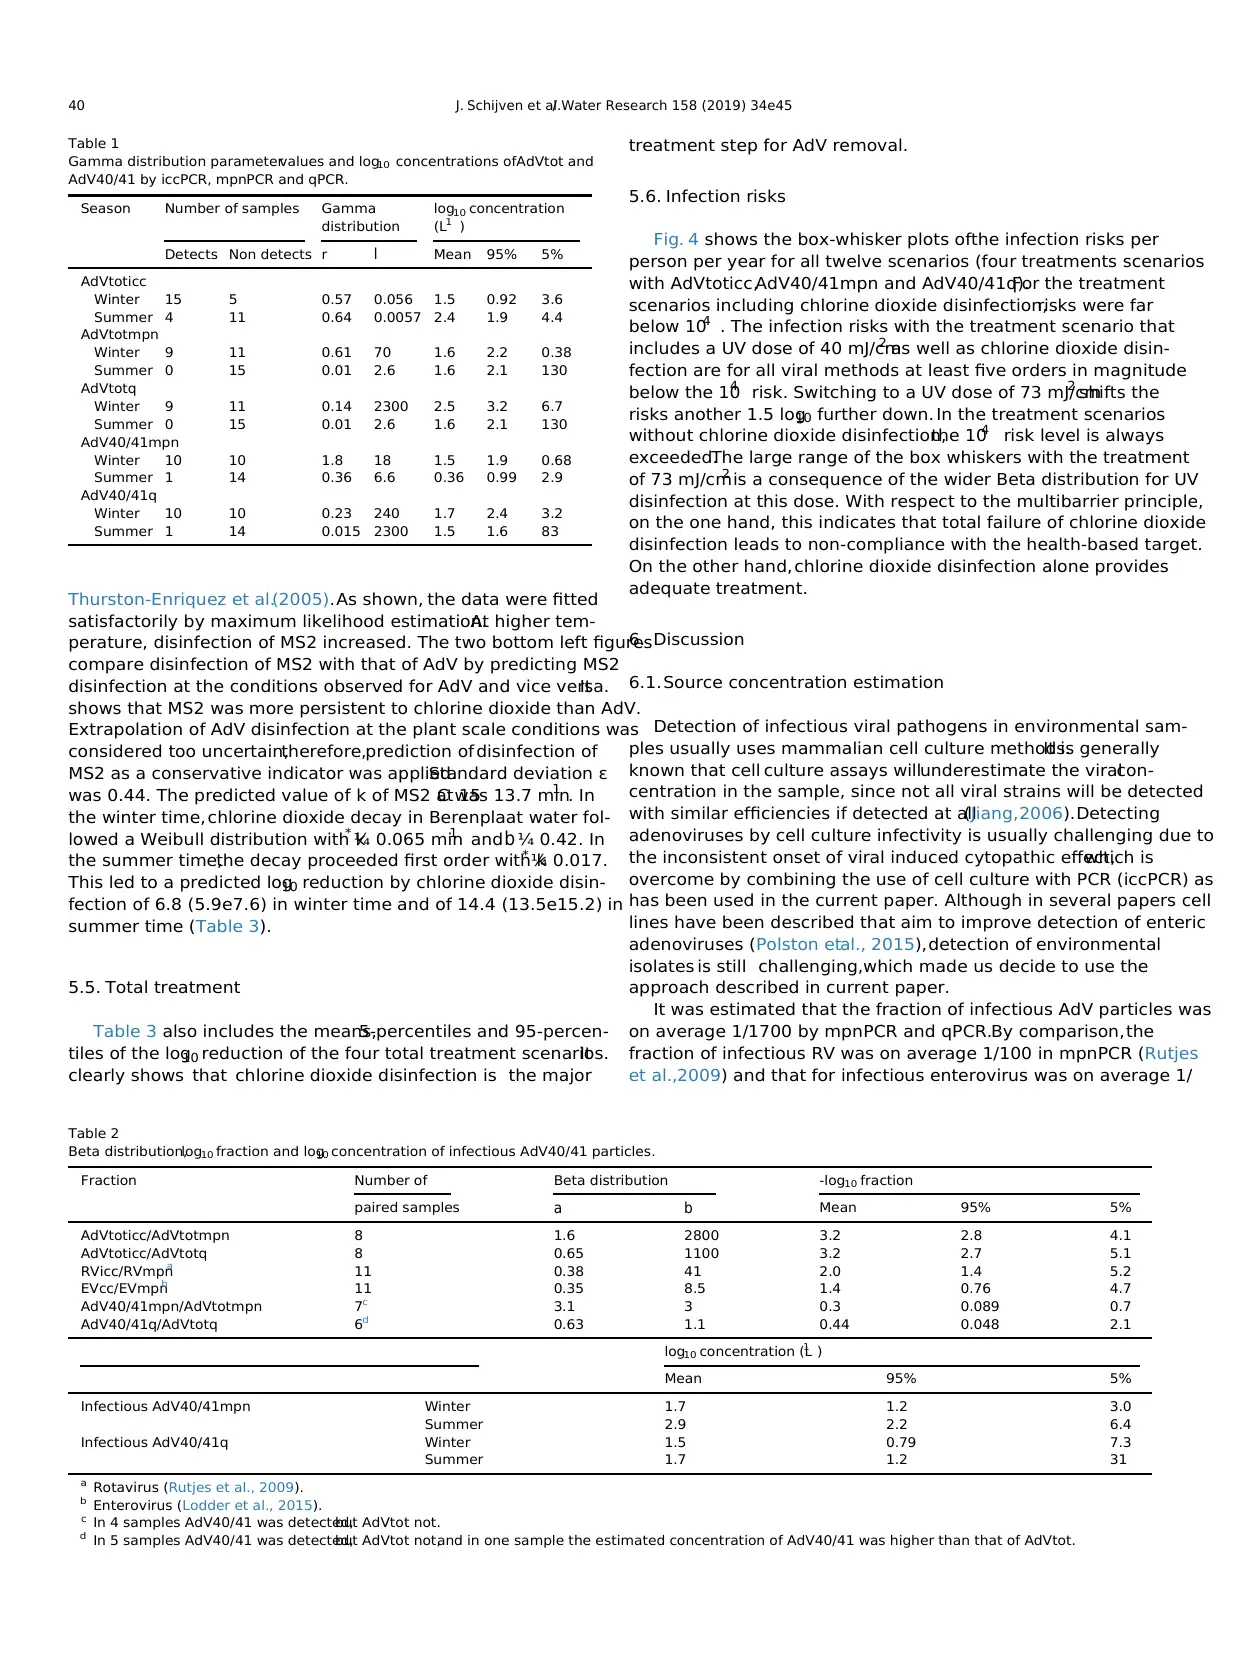
Thurston-Enriquez et al.(2005).As shown, the data were fitted
satisfactorily by maximum likelihood estimation.At higher tem-
perature, disinfection of MS2 increased. The two bottom left figures
compare disinfection of MS2 with that of AdV by predicting MS2
disinfection at the conditions observed for AdV and vice versa.It
shows that MS2 was more persistent to chlorine dioxide than AdV.
Extrapolation of AdV disinfection at the plant scale conditions was
considered too uncertain,therefore,prediction of disinfection of
MS2 as a conservative indicator was applied.Standard deviation ε
was 0.44. The predicted value of k of MS2 at 15C was 13.7 min1 . In
the winter time, chlorine dioxide decay in Berenplaat water fol-
lowed a Weibull distribution with k* ¼ 0.065 min1 and b ¼ 0.42. In
the summer time,the decay proceeded first order with k* ¼ 0.017.
This led to a predicted log10 reduction by chlorine dioxide disin-
fection of 6.8 (5.9e7.6) in winter time and of 14.4 (13.5e15.2) in
summer time (Table 3).
5.5. Total treatment
Table 3 also includes the means,5-percentiles and 95-percen-
tiles of the log10 reduction of the four total treatment scenarios.It
clearly shows that chlorine dioxide disinfection is the major
treatment step for AdV removal.
5.6. Infection risks
Fig. 4 shows the box-whisker plots ofthe infection risks per
person per year for all twelve scenarios (four treatments scenarios
with AdVtoticc,AdV40/41mpn and AdV40/41q).For the treatment
scenarios including chlorine dioxide disinfection,risks were far
below 104 . The infection risks with the treatment scenario that
includes a UV dose of 40 mJ/cm2 as well as chlorine dioxide disin-
fection are for all viral methods at least five orders in magnitude
below the 104 risk. Switching to a UV dose of 73 mJ/cm2 shifts the
risks another 1.5 log10 further down. In the treatment scenarios
without chlorine dioxide disinfection,the 104 risk level is always
exceeded.The large range of the box whiskers with the treatment
of 73 mJ/cm2 is a consequence of the wider Beta distribution for UV
disinfection at this dose. With respect to the multibarrier principle,
on the one hand, this indicates that total failure of chlorine dioxide
disinfection leads to non-compliance with the health-based target.
On the other hand,chlorine dioxide disinfection alone provides
adequate treatment.
6. Discussion
6.1.Source concentration estimation
Detection of infectious viral pathogens in environmental sam-
ples usually uses mammalian cell culture methods.It is generally
known that cell culture assays willunderestimate the viralcon-
centration in the sample, since not all viral strains will be detected
with similar efficiencies if detected at all(Jiang,2006).Detecting
adenoviruses by cell culture infectivity is usually challenging due to
the inconsistent onset of viral induced cytopathic effect,which is
overcome by combining the use of cell culture with PCR (iccPCR) as
has been used in the current paper. Although in several papers cell
lines have been described that aim to improve detection of enteric
adenoviruses (Polston etal., 2015),detection of environmental
isolates is still challenging,which made us decide to use the
approach described in current paper.
It was estimated that the fraction of infectious AdV particles was
on average 1/1700 by mpnPCR and qPCR.By comparison,the
fraction of infectious RV was on average 1/100 in mpnPCR (Rutjes
et al.,2009) and that for infectious enterovirus was on average 1/
Table 1
Gamma distribution parametervalues and log10 concentrations ofAdVtot and
AdV40/41 by iccPCR, mpnPCR and qPCR.
Season Number of samples Gamma
distribution
log10 concentration
(L1 )
Detects Non detects r l Mean 95% 5%
AdVtoticc
Winter 15 5 0.57 0.056 1.5 0.92 3.6
Summer 4 11 0.64 0.0057 2.4 1.9 4.4
AdVtotmpn
Winter 9 11 0.61 70 1.6 2.2 0.38
Summer 0 15 0.01 2.6 1.6 2.1 130
AdVtotq
Winter 9 11 0.14 2300 2.5 3.2 6.7
Summer 0 15 0.01 2.6 1.6 2.1 130
AdV40/41mpn
Winter 10 10 1.8 18 1.5 1.9 0.68
Summer 1 14 0.36 6.6 0.36 0.99 2.9
AdV40/41q
Winter 10 10 0.23 240 1.7 2.4 3.2
Summer 1 14 0.015 2300 1.5 1.6 83
Table 2
Beta distribution,log10 fraction and log10 concentration of infectious AdV40/41 particles.
Fraction Number of Beta distribution -log10 fraction
paired samples a b Mean 95% 5%
AdVtoticc/AdVtotmpn 8 1.6 2800 3.2 2.8 4.1
AdVtoticc/AdVtotq 8 0.65 1100 3.2 2.7 5.1
RVicc/RVmpna 11 0.38 41 2.0 1.4 5.2
EVcc/EVmpnb 11 0.35 8.5 1.4 0.76 4.7
AdV40/41mpn/AdVtotmpn 7c 3.1 3 0.3 0.089 0.7
AdV40/41q/AdVtotq 6d 0.63 1.1 0.44 0.048 2.1
log10 concentration (L1 )
Mean 95% 5%
Infectious AdV40/41mpn Winter 1.7 1.2 3.0
Summer 2.9 2.2 6.4
Infectious AdV40/41q Winter 1.5 0.79 7.3
Summer 1.7 1.2 31
a Rotavirus (Rutjes et al., 2009).
b Enterovirus (Lodder et al., 2015).
c In 4 samples AdV40/41 was detected,but AdVtot not.
d In 5 samples AdV40/41 was detected,but AdVtot not,and in one sample the estimated concentration of AdV40/41 was higher than that of AdVtot.
J. Schijven et al./ Water Research 158 (2019) 34e4540
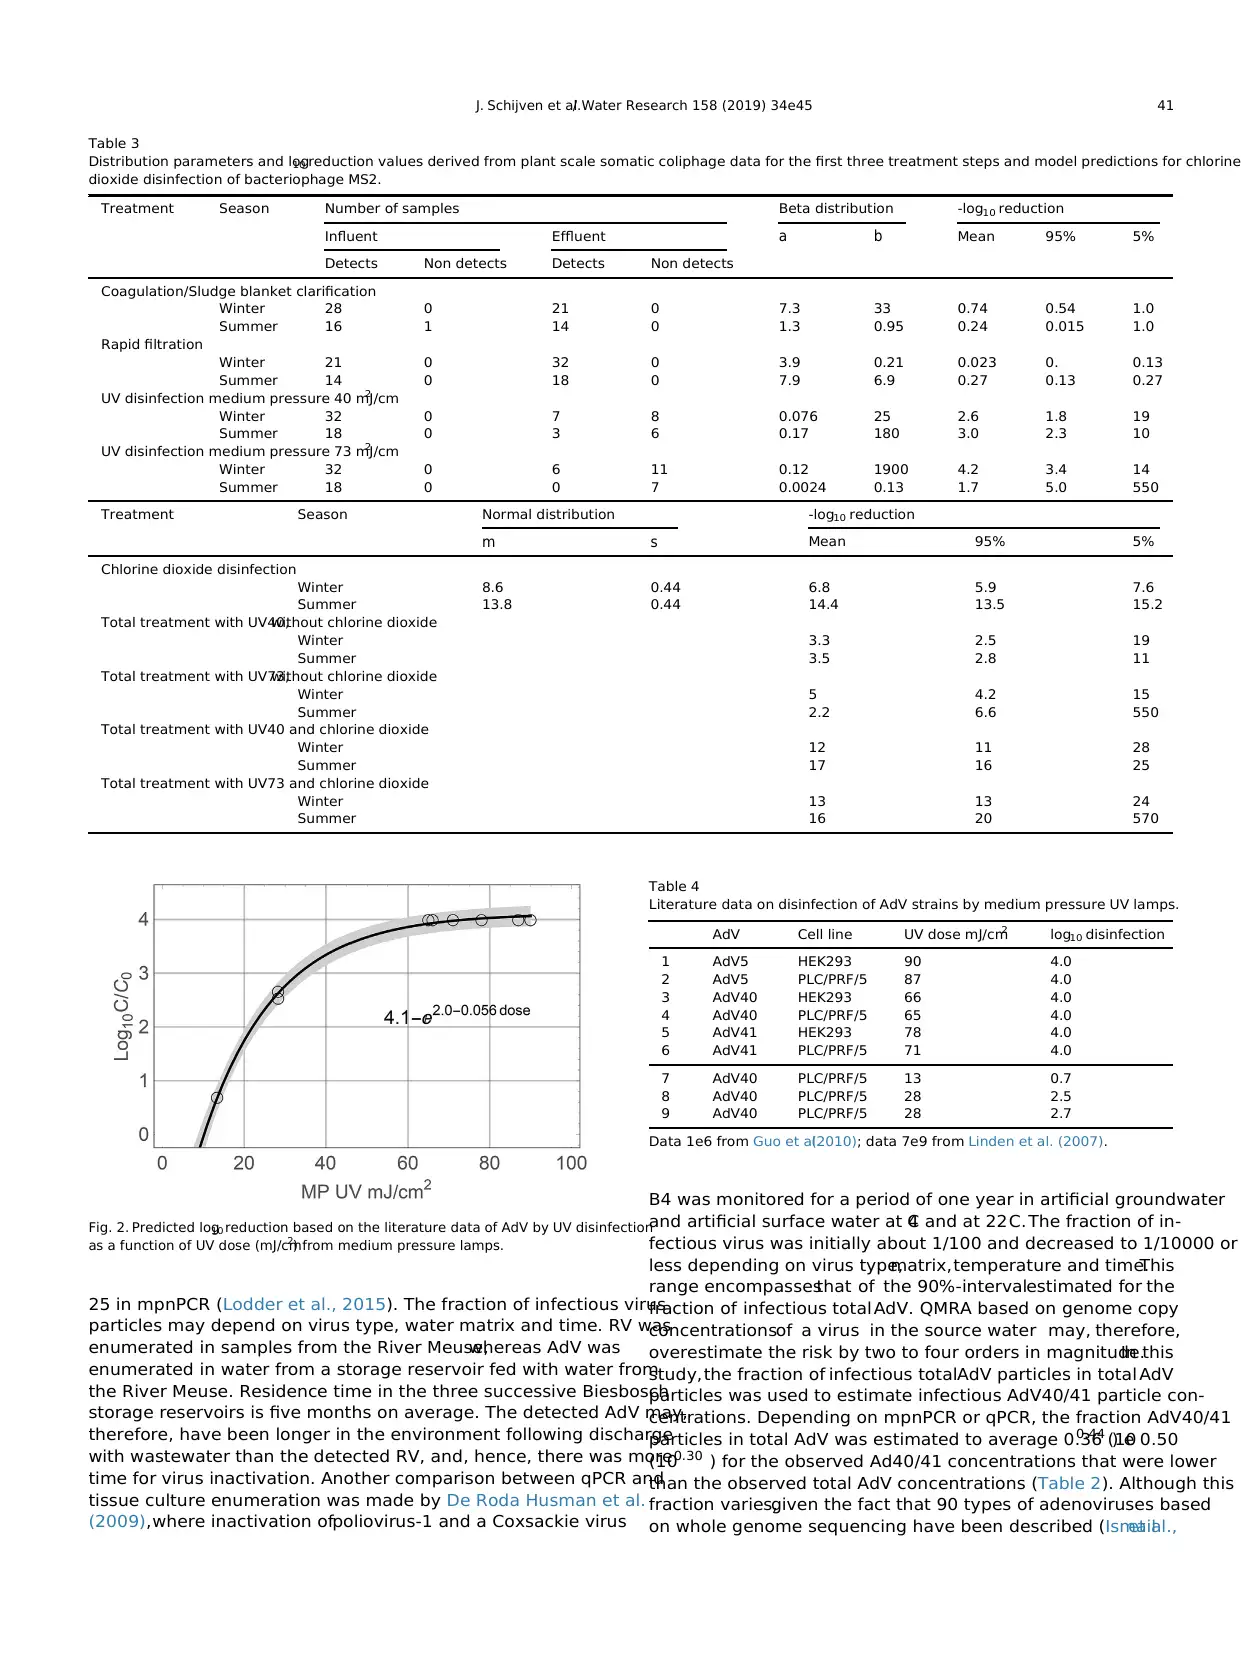
25 in mpnPCR (Lodder et al., 2015). The fraction of infectious virus
particles may depend on virus type, water matrix and time. RV was
enumerated in samples from the River Meuse,whereas AdV was
enumerated in water from a storage reservoir fed with water from
the River Meuse. Residence time in the three successive Biesbosch
storage reservoirs is five months on average. The detected AdV may,
therefore, have been longer in the environment following discharge
with wastewater than the detected RV, and, hence, there was more
time for virus inactivation. Another comparison between qPCR and
tissue culture enumeration was made by De Roda Husman et al.
(2009),where inactivation ofpoliovirus-1 and a Coxsackie virus
B4 was monitored for a period of one year in artificial groundwater
and artificial surface water at 4C and at 22C. The fraction of in-
fectious virus was initially about 1/100 and decreased to 1/10000 or
less depending on virus type,matrix,temperature and time.This
range encompassesthat of the 90%-intervalestimated for the
fraction of infectious total AdV. QMRA based on genome copy
concentrationsof a virus in the source water may, therefore,
overestimate the risk by two to four orders in magnitude.In this
study,the fraction of infectious totalAdV particles in total AdV
particles was used to estimate infectious AdV40/41 particle con-
centrations. Depending on mpnPCR or qPCR, the fraction AdV40/41
particles in total AdV was estimated to average 0.36 (100.44 ) e 0.50
(100.30 ) for the observed Ad40/41 concentrations that were lower
than the observed total AdV concentrations (Table 2). Although this
fraction varies,given the fact that 90 types of adenoviruses based
on whole genome sequencing have been described (Ismailet al.,
Table 3
Distribution parameters and log10 reduction values derived from plant scale somatic coliphage data for the first three treatment steps and model predictions for chlorine
dioxide disinfection of bacteriophage MS2.
Treatment Season Number of samples Beta distribution -log10 reduction
Influent Effluent a b Mean 95% 5%
Detects Non detects Detects Non detects
Coagulation/Sludge blanket clarification
Winter 28 0 21 0 7.3 33 0.74 0.54 1.0
Summer 16 1 14 0 1.3 0.95 0.24 0.015 1.0
Rapid filtration
Winter 21 0 32 0 3.9 0.21 0.023 0. 0.13
Summer 14 0 18 0 7.9 6.9 0.27 0.13 0.27
UV disinfection medium pressure 40 mJ/cm2
Winter 32 0 7 8 0.076 25 2.6 1.8 19
Summer 18 0 3 6 0.17 180 3.0 2.3 10
UV disinfection medium pressure 73 mJ/cm2
Winter 32 0 6 11 0.12 1900 4.2 3.4 14
Summer 18 0 0 7 0.0024 0.13 1.7 5.0 550
Treatment Season Normal distribution -log10 reduction
m s Mean 95% 5%
Chlorine dioxide disinfection
Winter 8.6 0.44 6.8 5.9 7.6
Summer 13.8 0.44 14.4 13.5 15.2
Total treatment with UV40,without chlorine dioxide
Winter 3.3 2.5 19
Summer 3.5 2.8 11
Total treatment with UV73,without chlorine dioxide
Winter 5 4.2 15
Summer 2.2 6.6 550
Total treatment with UV40 and chlorine dioxide
Winter 12 11 28
Summer 17 16 25
Total treatment with UV73 and chlorine dioxide
Winter 13 13 24
Summer 16 20 570
Fig. 2. Predicted log10 reduction based on the literature data of AdV by UV disinfection
as a function of UV dose (mJ/cm2) from medium pressure lamps.
Table 4
Literature data on disinfection of AdV strains by medium pressure UV lamps.
AdV Cell line UV dose mJ/cm2 log10 disinfection
1 AdV5 HEK293 90 4.0
2 AdV5 PLC/PRF/5 87 4.0
3 AdV40 HEK293 66 4.0
4 AdV40 PLC/PRF/5 65 4.0
5 AdV41 HEK293 78 4.0
6 AdV41 PLC/PRF/5 71 4.0
7 AdV40 PLC/PRF/5 13 0.7
8 AdV40 PLC/PRF/5 28 2.5
9 AdV40 PLC/PRF/5 28 2.7
Data 1e6 from Guo et al.(2010); data 7e9 from Linden et al. (2007).
J. Schijven et al./ Water Research 158 (2019) 34e45 41
⊘ This is a preview!⊘
Do you want full access?
Subscribe today to unlock all pages.
Trusted by 1+ million students worldwide
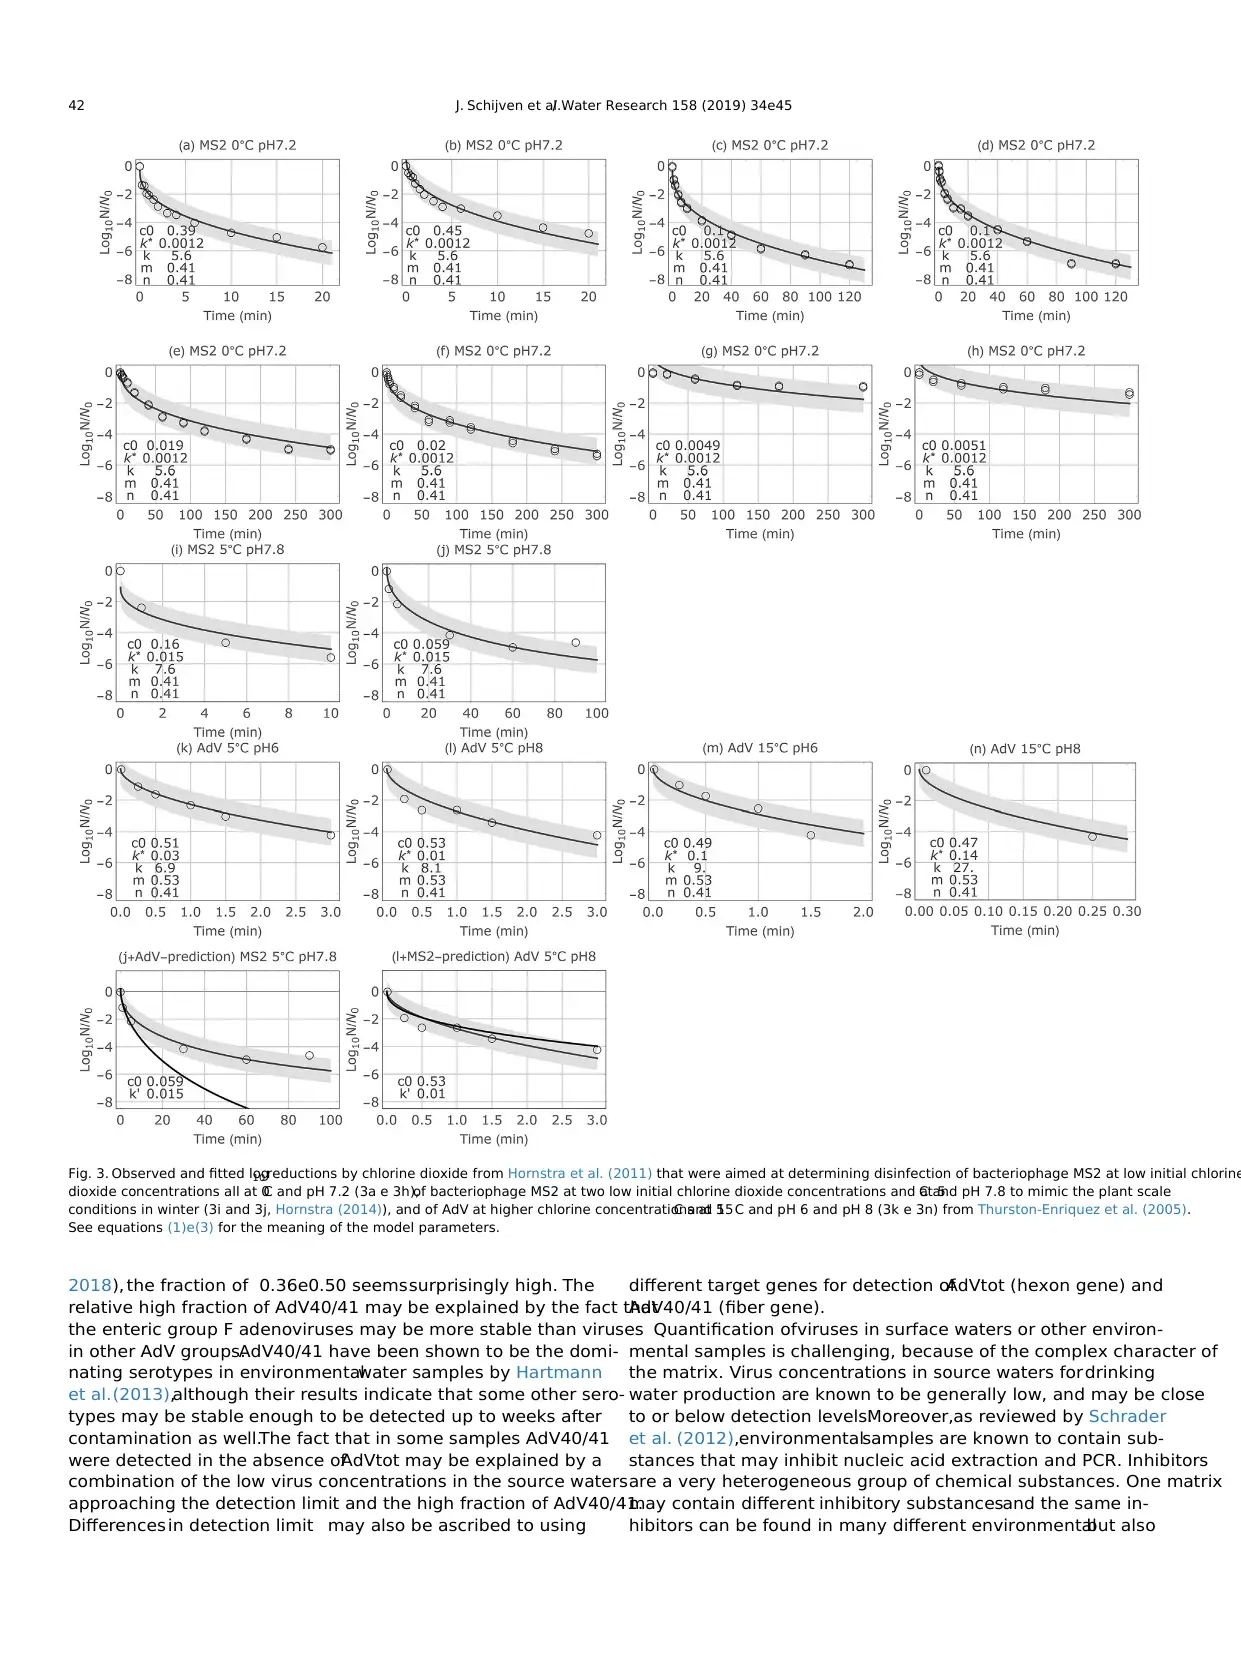
2018), the fraction of 0.36e0.50 seemssurprisingly high. The
relative high fraction of AdV40/41 may be explained by the fact that
the enteric group F adenoviruses may be more stable than viruses
in other AdV groups.AdV40/41 have been shown to be the domi-
nating serotypes in environmentalwater samples by Hartmann
et al.(2013),although their results indicate that some other sero-
types may be stable enough to be detected up to weeks after
contamination as well.The fact that in some samples AdV40/41
were detected in the absence ofAdVtot may be explained by a
combination of the low virus concentrations in the source waters
approaching the detection limit and the high fraction of AdV40/41.
Differences in detection limit may also be ascribed to using
different target genes for detection ofAdVtot (hexon gene) and
AdV40/41 (fiber gene).
Quantification ofviruses in surface waters or other environ-
mental samples is challenging, because of the complex character of
the matrix. Virus concentrations in source waters fordrinking
water production are known to be generally low, and may be close
to or below detection levels.Moreover,as reviewed by Schrader
et al. (2012),environmentalsamples are known to contain sub-
stances that may inhibit nucleic acid extraction and PCR. Inhibitors
are a very heterogeneous group of chemical substances. One matrix
may contain different inhibitory substancesand the same in-
hibitors can be found in many different environmentalbut also
Fig. 3. Observed and fitted log10 reductions by chlorine dioxide from Hornstra et al. (2011) that were aimed at determining disinfection of bacteriophage MS2 at low initial chlorine
dioxide concentrations all at 0C and pH 7.2 (3a e 3h),of bacteriophage MS2 at two low initial chlorine dioxide concentrations and at 5C and pH 7.8 to mimic the plant scale
conditions in winter (3i and 3j, Hornstra (2014)), and of AdV at higher chlorine concentrations at 5C and 15C and pH 6 and pH 8 (3k e 3n) from Thurston-Enriquez et al. (2005).
See equations (1)e(3) for the meaning of the model parameters.
J. Schijven et al./ Water Research 158 (2019) 34e4542
Paraphrase This Document
Need a fresh take? Get an instant paraphrase of this document with our AI Paraphraser
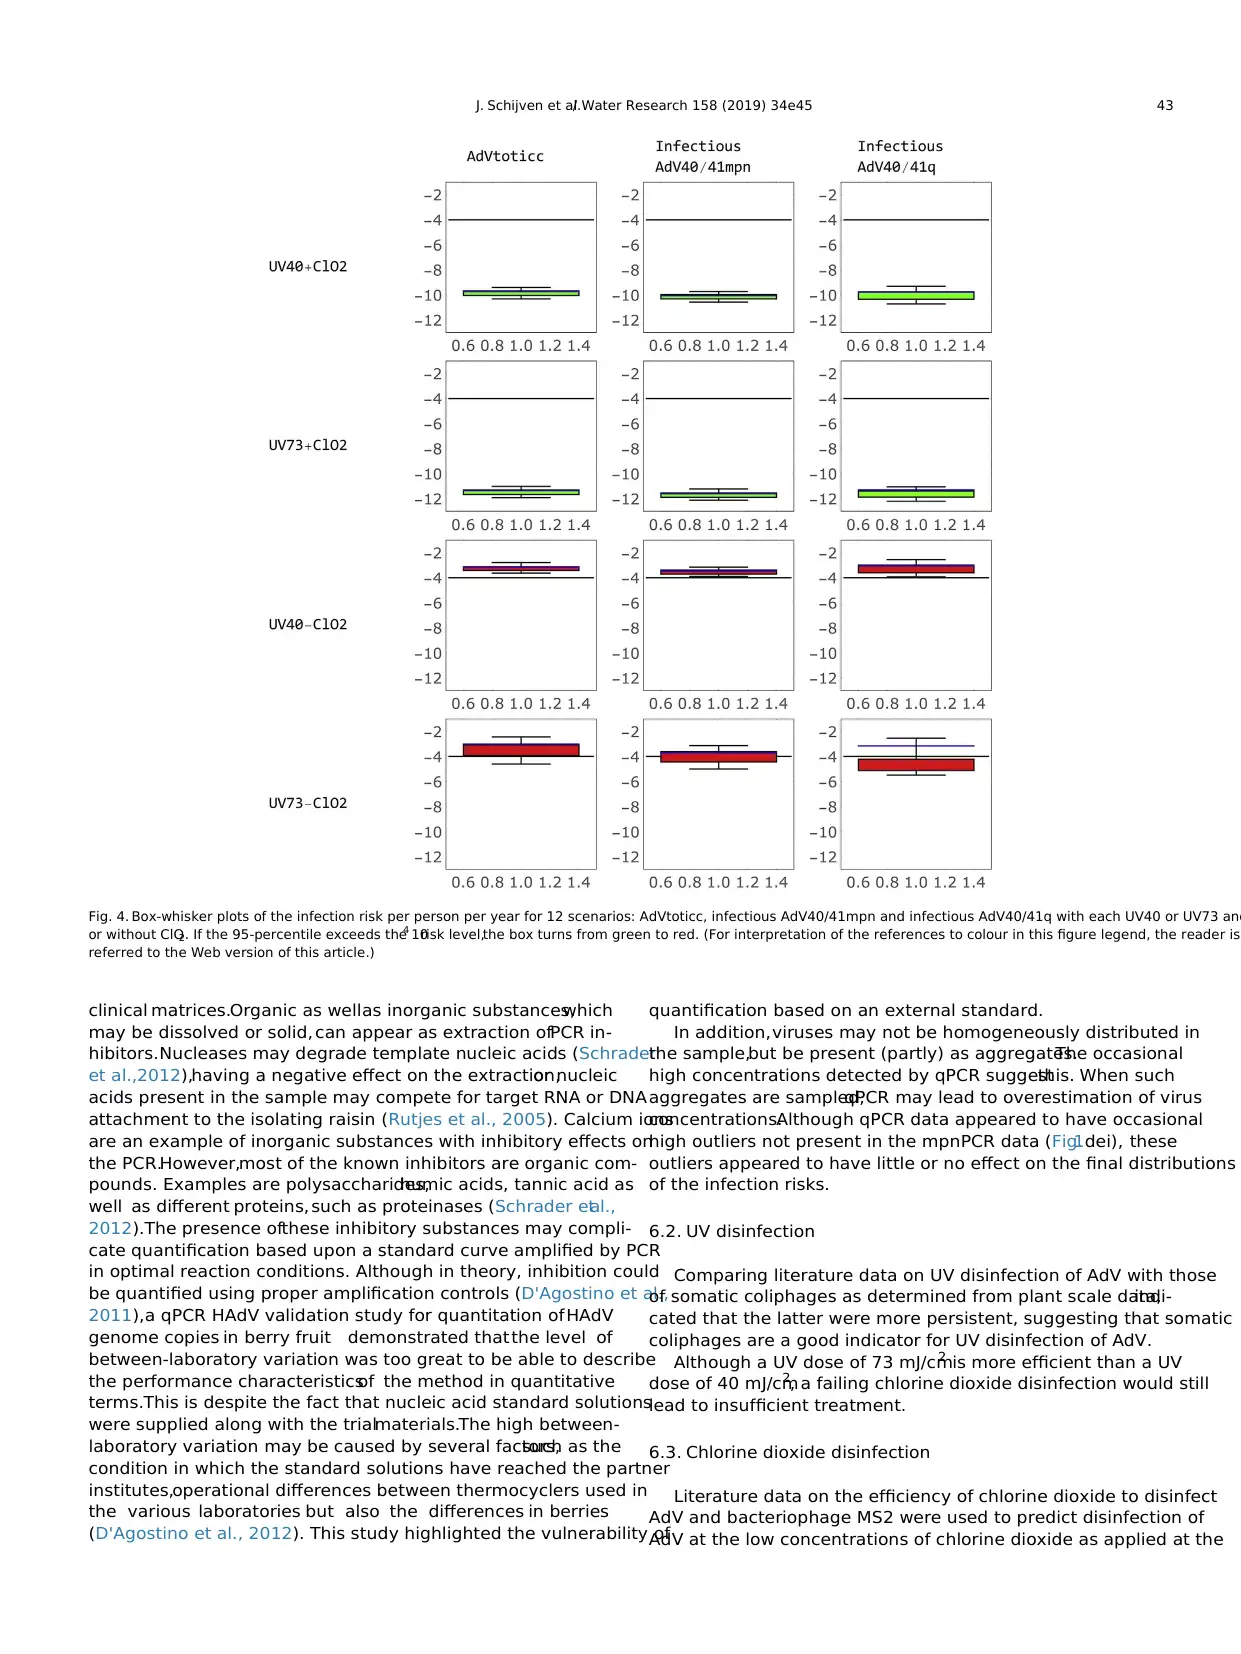
clinical matrices.Organic as wellas inorganic substances,which
may be dissolved or solid, can appear as extraction ofPCR in-
hibitors.Nucleases may degrade template nucleic acids (Schrader
et al.,2012),having a negative effect on the extraction,or nucleic
acids present in the sample may compete for target RNA or DNA
attachment to the isolating raisin (Rutjes et al., 2005). Calcium ions
are an example of inorganic substances with inhibitory effects on
the PCR.However,most of the known inhibitors are organic com-
pounds. Examples are polysaccharides,humic acids, tannic acid as
well as different proteins, such as proteinases (Schrader etal.,
2012).The presence ofthese inhibitory substances may compli-
cate quantification based upon a standard curve amplified by PCR
in optimal reaction conditions. Although in theory, inhibition could
be quantified using proper amplification controls (D'Agostino et al.,
2011),a qPCR HAdV validation study for quantitation ofHAdV
genome copies in berry fruit demonstrated that the level of
between-laboratory variation was too great to be able to describe
the performance characteristicsof the method in quantitative
terms.This is despite the fact that nucleic acid standard solutions
were supplied along with the trialmaterials.The high between-
laboratory variation may be caused by several factors,such as the
condition in which the standard solutions have reached the partner
institutes,operational differences between thermocyclers used in
the various laboratories but also the differences in berries
(D'Agostino et al., 2012). This study highlighted the vulnerability of
quantification based on an external standard.
In addition,viruses may not be homogeneously distributed in
the sample,but be present (partly) as aggregates.The occasional
high concentrations detected by qPCR suggestthis. When such
aggregates are sampled,qPCR may lead to overestimation of virus
concentrations.Although qPCR data appeared to have occasional
high outliers not present in the mpnPCR data (Fig.1dei), these
outliers appeared to have little or no effect on the final distributions
of the infection risks.
6.2. UV disinfection
Comparing literature data on UV disinfection of AdV with those
of somatic coliphages as determined from plant scale data,indi-
cated that the latter were more persistent, suggesting that somatic
coliphages are a good indicator for UV disinfection of AdV.
Although a UV dose of 73 mJ/cm2 is more efficient than a UV
dose of 40 mJ/cm2
, a failing chlorine dioxide disinfection would still
lead to insufficient treatment.
6.3. Chlorine dioxide disinfection
Literature data on the efficiency of chlorine dioxide to disinfect
AdV and bacteriophage MS2 were used to predict disinfection of
AdV at the low concentrations of chlorine dioxide as applied at the
Fig. 4. Box-whisker plots of the infection risk per person per year for 12 scenarios: AdVtoticc, infectious AdV40/41mpn and infectious AdV40/41q with each UV40 or UV73 and
or without ClO2. If the 95-percentile exceeds the 104 risk level,the box turns from green to red. (For interpretation of the references to colour in this figure legend, the reader is
referred to the Web version of this article.)
J. Schijven et al./ Water Research 158 (2019) 34e45 43
DWTP.It showed that under the assumption of the same kinetics
that disinfection is more efficient at higher temperature and,
obviously, with higher disinfectant concentration,and also at
higher pH. MS2 appeared to be less sensitive than AdV. Because the
disinfection data of MS2 were near to the plant scale conditions, it
is more appropriate to predict MS2 disinfection than AdV disin-
fection and thus to use MS2 as a process indicator.Clearly,a low
chlorine dioxide concentration as applied here appeared to be
highly efficient and is the major treatment step at this DWTP for the
reduction of AdV.
6.4. Risk and uncertainty
It may be stated that the risk estimates were conservative
because somatic coliphages and bacteriophage MS2 appeared to be
more persistent to UV and chlorine dioxide disinfection,respec-
tively,than AdV.
7. Conclusions
AdV40/41 represents a large fraction oftotal AdV and only a
small fraction of AdV is infectious (on average 1/1700).
Somatic coliphages have been shown to be a good indicator for
UV disinfection of AdV, and bacteriophage MS2 for chlorine dioxide
disinfection of AdV.
According to the QMRA, the drinking water at DWTP Berenplaat
is compliant with the legal health-based target for AdV.
This paper provides the first description of the application of
chlorine dioxide in drinking water production at the low initial
concentrationsof 0.05 mg/l and 0.1 mg/l, which, nevertheless,
appeared to be very effective in the reduction ofAdV. Chlorine
dioxide was the dominant treatment step for AdV at this DWTP.
Acknowledgments
Arno Swart and Harold van den Berg from the National Institute
of Public Health and the Environment,Bilthoven,the Netherlands,
are greatly acknowledged for their useful comments. This research
was funded by Evides Water Company and the Ministry of Infra-
structure and Water Management.
Appendix A. Supplementary data
Supplementary data to this article can be found online at
https://doi.org/10.1016/j.watres.2019.03.090.
References
Anonymous,2011.Besluit van 23 mei2011,houdende bepalingen inzake de pro-
ductie en distributie van drinkwater en de organisatie van de openbare
drinkwatervoorziening (Drinkwaterbesluit).Staatsblad van het Koninkrijk der
Nederlanden 293, 1e90.
Bertrand,I., Schijven,J.F.,Sanchez,G., Wyn-Jones,P., Ottoson,J., Morin, T., et al.,
2012.The impact of temperature on the inactivation of enteric viruses in food
and water: a review.J. Appl. Microbiol. 112 (6), 1059e1074.
Bofill-Mas, S., Calgua, B., Clemente-Casares, P., La Rosa, G., Iaconelli, M., Muscillo, M.,
et al., 2010.Quantification ofhuman adenoviruses in European recreational
waters.Food Environ.Virol. 2 (2), 101e109.
Bon, F., Fascia,P., Dauvergne,M., Tenenbaum,D., Planson,H., Petion, A.M., et al.,
1999. Prevalence of group A rotavirus, human calicivirus, astrovirus,and
adenovirus type 40 and 41 infections among children with acute gastroenteritis
in Dijon, France.J. Clin. Microbiol. 37 (9),3055e3058.
Brandt,C.D.,Kim, H.W., Vargosko,A.J., Jeffries,B.C.,Arrobio,J.O.,Rindge,B.,et al.,
1969.Infections in 18,000 infants and children in a controlled study of respi-
ratory tract disease.I. Adenovirus pathogenicity in relation to serologic type
and illness syndrome.Am. J. Epidemiol.90 (6),484e500.
D'Agostino, M., Cook, N., Rodriguez-Lazaro,D., Rutjes, S., 2011. Nucleic acid
amplification-based methods fordetection of enteric viruses: definition of
controls and interpretation of results.Food Environ.Virol. 3 (2), 55e60.
D'Agostino,M., Cook, N., Di Bartolo,I., Ruggeri,F.M., Berto,A., Martelli, F., et al.,
2012.Multicenter collaborative trialevaluation ofa method for detection of
human adenoviruses in berry fruit.Food Anal.Methods 5 (1), 1e7.
De Roda Husman,A.M., Lodder,W.J.,Rutjes,S.A.,Schijven,J.F.,Teunis,P.F.M.,2009.
Long-term inactivation study ofthree enteroviruses in artificialsurface and
groundwaters,using PCR and cell culture. Appl. Environ. Microbiol. 75 (4),
1050e1057.
Diez-Valcarce,M., Kovac, K., Cook,N., Rodríguez-Lazaro,D., Hernandez,M., 2011.
Construction and analytical application of internal amplification controls (IAC)
for detection of food supply chain-relevantviruses by real-time PCR-based
assays.Food Anal.Methods 4 (3),437e445.
Guo,H., Chu, X., Hu, J., 2010.Effect of host cells on low-and medium-pressure UV
inactivation of adenoviruses.Appl. Environ.Microbiol. 76 (21),7068e7075.
Haas,C.N.,Joffe, J., 1994.Disinfection under dynamic conditions: modification of
Hom's model for decay.Environ.Sci.Technol.28 (7), 1367e1369.
Hartmann, N.M., Dartscht,M., Szewzyk, R., Selinka, H.C., 2013. Monitoring of
adenovirus serotypes in environmental samples by combined PCR and melting
point analyses.Virol. J. 10 (1), 190.
Hernroth, B.E., Conden-Hansson, A.C., Rehnstam-Holm, A.S., Girones, R., Allard, A.K.,
2002.Environmental factors influencing human viral pathogens and their po-
tential indicator organisms in the blue mussel,Mytilus edulis: the first Scan-
dinavian report.Appl. Environ.Microbiol. 68 (9),4523e4533.
Hijnen,W.A.M.,Beerendonk,E.F.,Medema,G.J.,2006.Inactivation credit of UV ra-
diation for viruses,bacteria and protozoan (oo) cysts in water: a review.Water
Res.40 (1),3e22.
Hijnen, W.A.M.,Suylen,G.M.H.,Bahlman,J.A.,Brouwer-Hanzens,A., Medema,G.J.,
2010. GAC adsorption filters as barriers for viruses, bacteria and protozoan (oo)
cysts in water treatment.Water Res.44 (4), 1224e1234.
Hornstra, L., 2014. Desinfectie van E. coli, Campylobacter en MS2 door chloordioxide
in het actief kool filtraat van drinkwaterproductielocatie Berenplaat.KWR
2014.029,Nieuwegein,the Netherlands.
Hornstra,L.M.,Smeets,P.W.M.H.,Medema,G.J.,2011.Inactivation of bacteriophage
MS2 upon exposure to very low concentrations of chlorine dioxide.Water Res.
45 (4), 1847e1855.
Ismail,A.M., Lee,J.S.,Lee,J.Y.,Singh,G.,Dyer,D.W.,Seto,D.,Chodosh,J., Rajaiya,J.,
2018.Adenoviromics: mining the human adenovirus species D genome.Front.
Microbiol. 9 article 2178.https://doi.org/10.3389/fmicb.2018.02178.
ISO, I., 2000. 10705e2: Water Quality. Detection and Enumeration of
BacteriophagesePart 2: Enumeration of Somatic.Coliphages.International Or-
ganization for Standardization,Geneva,Switzerland.
Jiang, S.C.,2006. Human adenoviruses in water: occurrence and health implica-
tions: a critical review.Environ.Sci.Technol.40, 7132e7140.
Jothikumar,N., Cromeans,T.L.,Hill, V.R.,Lu, X., Sobsey,M.D., Erdman,D.D.,2005.
Quantitative real-time PCR assays for detection ofhuman adenoviruses and
identification of serotypes 40 and 41. Appl. Environ. Microbiol. 71 (6),
3131e3136.
Linden, K.G., Thurston, J., Schaefer, R., Malley, J.P., 2007. Enhanced UV inactivation of
adenoviruses under polychromatic UV lamps. Appl. Environ. Microbiol. 73 (23),
7571e7574.
Lodder,W.J., Schijven,J.F.,Rutjes,S.A.,de Roda Husman,A.M., Teunis,P.F.M.,2015.
Entero-and parechovirus distributions in surface water and probabilities of
exposure to these viruses during water recreation.Water Res.75, 25e32.
Oh, D.Y.,Gaedicke,G., Schreier,E., 2003. Viral agents ofacute gastroenteritis in
German children:prevalence and molecular diversity.J. Med. Virol. 71 (1),
82e93.
Polston,P.M.,Rodríguez,R.A.,Seo,K.J., Kim, M., Ko, G.P.,Sobsey,M.D., 2015.Field
evaluation of an improved cell line for the detection of human adenoviruses in
environmental samples.J. Virol. Methods 205,68e74.
Rodriguez-Baez, N., O'brien, R., Qiu, S., Bass, D.M., 2002. Astrovirus, adenovirus, and
rotavirus in hospitalized children: prevalence and association with gastroen-
teritis.J. Pediatr.Gastroenterol.Nutr.35 (1),64e68.
Rutjes, S.A., Lodder, W.J., Van Leeuwen, A.D., de Roda Husman, A.M., 2009. Detection
of infectious rotavirus in naturally contaminated source waters for drinking
water production.J. Appl. Microbiol. 107 (1),97e105.
Rutjes,S.A.,Italiaander,R.,van den Berg,H.H.,Lodder,W.J., de Roda Husman,A.M.,
2005. Isolation and detection of enterovirus RNA from large-volume water
samples by using the NucliSens miniMAG system and real-time nucleic acid
sequence-based amplification.Appl. Environ.Microbiol. 71 (7),3734e3740.
Schijven, J.F., Sadeghi,G., Hassanizadeh,S.M., 2016. Long-term inactivation of
bacteriophage PRD1 as a function oftemperature,pH, sodium and calcium
concentration.Water Res. 103,66e73.
Schijven,J.F.,Teunis,P.F.,Rutjes,S.A.,Bouwknegt,M., de Roda Husman,A.M., 2011.
QMRAspot: a tool for quantitative microbial risk assessment from surface water
to potable water.Water Res.45 (17),5564e5576.
Schrader,C.,Schielke,A., Ellerbroek,L.,Johne,R.,2012.PCR inhibitorseoccurrence,
properties and removal.J. Appl. Microbiol. 113 (5), 1014e1026.
Teunis,P.F.M.,Medema,G.J.,Kruidenier,L., Havelaar,A.H., 1997.Assessment of the
risk of infection by Cryptosporidium or Giardia in drinking water from a surface
water source.Water Res.31 (6), 1333e1346.
Teunis, P., Schijven, J., Rutjes, S., 2016. A generalized dose-response relationship for
adenovirus infection and illness by exposure pathway.Epidemiol.Infect.144
(16),3461e3473.
Thurston-Enriquez,J.A., Haas,C.N.,Jacangelo,J., Gerba,C.P.,2005. Inactivation of
enteric adenovirus and feline calicivirus by chlorine dioxide.Appl. Environ.
Microbiol. 71 (6),3100e3105.
Verhaelen, K., Bouwknegt, M., Lodder-Verschoor,F., Rutjes, S.A., de Roda
J. Schijven et al./ Water Research 158 (2019) 34e4544
⊘ This is a preview!⊘
Do you want full access?
Subscribe today to unlock all pages.
Trusted by 1+ million students worldwide
1 out of 13
Your All-in-One AI-Powered Toolkit for Academic Success.
+13062052269
info@desklib.com
Available 24*7 on WhatsApp / Email
![[object Object]](/_next/static/media/star-bottom.7253800d.svg)
Unlock your academic potential
Copyright © 2020–2026 A2Z Services. All Rights Reserved. Developed and managed by ZUCOL.