Report on Decision Analysis and Simple Regression Techniques
VerifiedAdded on 2023/03/23
|14
|5787
|63
Report
AI Summary
This report provides solutions to various problems related to decision analysis and simple regression. It begins by discussing the advantages of using payoff matrices and decision trees. It then analyzes a scenario involving market conditions and strategies (ROB1, ROB2, NOROB) using optimistic, pessimistic, Laplace, and regret criteria, as well as expected return calculations. The report also covers the value of survey information, including posterior probabilities and EVSI. Furthermore, it includes a simulation model for an airline overbooking problem, analyzing costs, compensation, and profit. Finally, the report examines linear regression models using GMAT scores, GPA, and age to predict academic performance, interpreting R-squared values and F-statistics.
Running head: DECISION ANALYSIS AND SIMPLE REGRESSION
Decision Analysis and Simple Regression
Name of the Student:
Name of the University:
Author Note:
Decision Analysis and Simple Regression
Name of the Student:
Name of the University:
Author Note:
Paraphrase This Document
Need a fresh take? Get an instant paraphrase of this document with our AI Paraphraser
1DECISION ANALYSIS AND SIMPLE REGRESSION
Table of Contents
Answer 1.A................................................................................................................................3
Answer 1.B.................................................................................................................................3
Answer 1.C.1..............................................................................................................................3
Answer 1.C.2..............................................................................................................................3
Answer 1.C.3..............................................................................................................................4
Answer 1.C.4..............................................................................................................................4
Answer 1.C.5..............................................................................................................................4
Answer 1.C.6..............................................................................................................................4
Answer 1.C.7..............................................................................................................................5
Answer 2.a..................................................................................................................................5
Answer 2.b.................................................................................................................................5
Answer 2.c..................................................................................................................................5
Answer 2.d.................................................................................................................................5
Answer 3.1.................................................................................................................................6
Answer 3.2.................................................................................................................................7
Answer 3.3.................................................................................................................................7
Answer 4.1.................................................................................................................................8
Answer 4.2...............................................................................................................................10
Answer 4.3...............................................................................................................................10
Answer 5.1.1............................................................................................................................11
Answer 5.1.2............................................................................................................................11
2DECISION ANALYSIS AND SIMPLE REGRESSION
Answer 5.2...............................................................................................................................11
Answer 5.3...............................................................................................................................11
Answer 5.4...............................................................................................................................12
Reference..................................................................................................................................13
⊘ This is a preview!⊘
Do you want full access?
Subscribe today to unlock all pages.
Trusted by 1+ million students worldwide
3DECISION ANALYSIS AND SIMPLE REGRESSION
Answer 1.A
Advantage of using payoff matrix: The payoff matrix is useful to represent the problem and
to analyses of the problem in which a number of possible outcomes and responses exist.
Under uncertainty, it is useful to explain the possible positive and negative outcomes.
Answer 1.B
Advantage of using decision trees: The decision tree explains the complexity of a
structured process in a very simple way. It is easy to use in case of sequential decision
process. Decision tree is more convenient as it express different action associated with
different consitions.
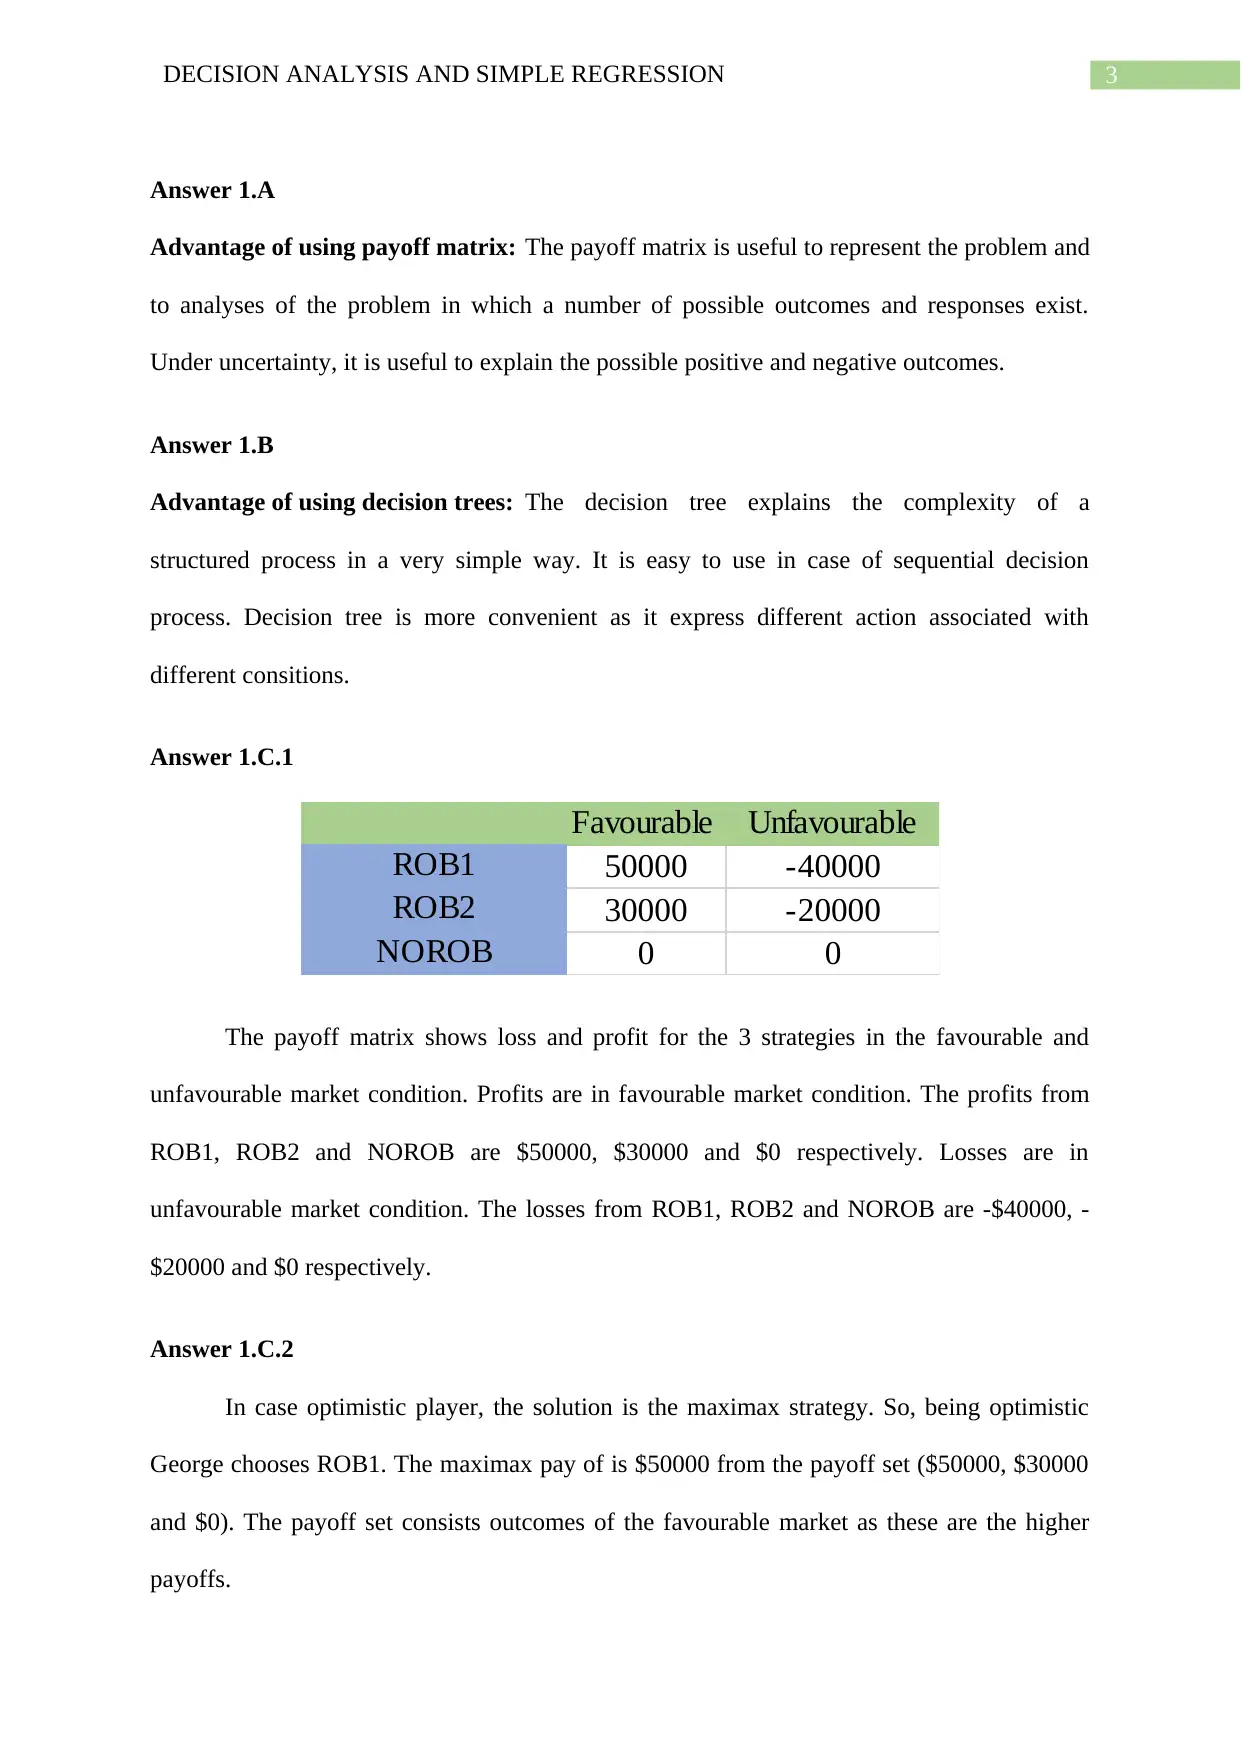
Answer 1.C.1
Favourable Unfavourable
50000 -40000
30000 -20000
0 0
ROB1
ROB2
NOROB
The payoff matrix shows loss and profit for the 3 strategies in the favourable and
unfavourable market condition. Profits are in favourable market condition. The profits from
ROB1, ROB2 and NOROB are $50000, $30000 and $0 respectively. Losses are in
unfavourable market condition. The losses from ROB1, ROB2 and NOROB are -$40000, -
$20000 and $0 respectively.
Answer 1.C.2
In case optimistic player, the solution is the maximax strategy. So, being optimistic
George chooses ROB1. The maximax pay of is $50000 from the payoff set ($50000, $30000
and $0). The payoff set consists outcomes of the favourable market as these are the higher
payoffs.
Answer 1.A
Advantage of using payoff matrix: The payoff matrix is useful to represent the problem and
to analyses of the problem in which a number of possible outcomes and responses exist.
Under uncertainty, it is useful to explain the possible positive and negative outcomes.
Answer 1.B
Advantage of using decision trees: The decision tree explains the complexity of a
structured process in a very simple way. It is easy to use in case of sequential decision
process. Decision tree is more convenient as it express different action associated with
different consitions.
Answer 1.C.1
Favourable Unfavourable
50000 -40000
30000 -20000
0 0
ROB1
ROB2
NOROB
The payoff matrix shows loss and profit for the 3 strategies in the favourable and
unfavourable market condition. Profits are in favourable market condition. The profits from
ROB1, ROB2 and NOROB are $50000, $30000 and $0 respectively. Losses are in
unfavourable market condition. The losses from ROB1, ROB2 and NOROB are -$40000, -
$20000 and $0 respectively.
Answer 1.C.2
In case optimistic player, the solution is the maximax strategy. So, being optimistic
George chooses ROB1. The maximax pay of is $50000 from the payoff set ($50000, $30000
and $0). The payoff set consists outcomes of the favourable market as these are the higher
payoffs.
Paraphrase This Document
Need a fresh take? Get an instant paraphrase of this document with our AI Paraphraser
4DECISION ANALYSIS AND SIMPLE REGRESSION
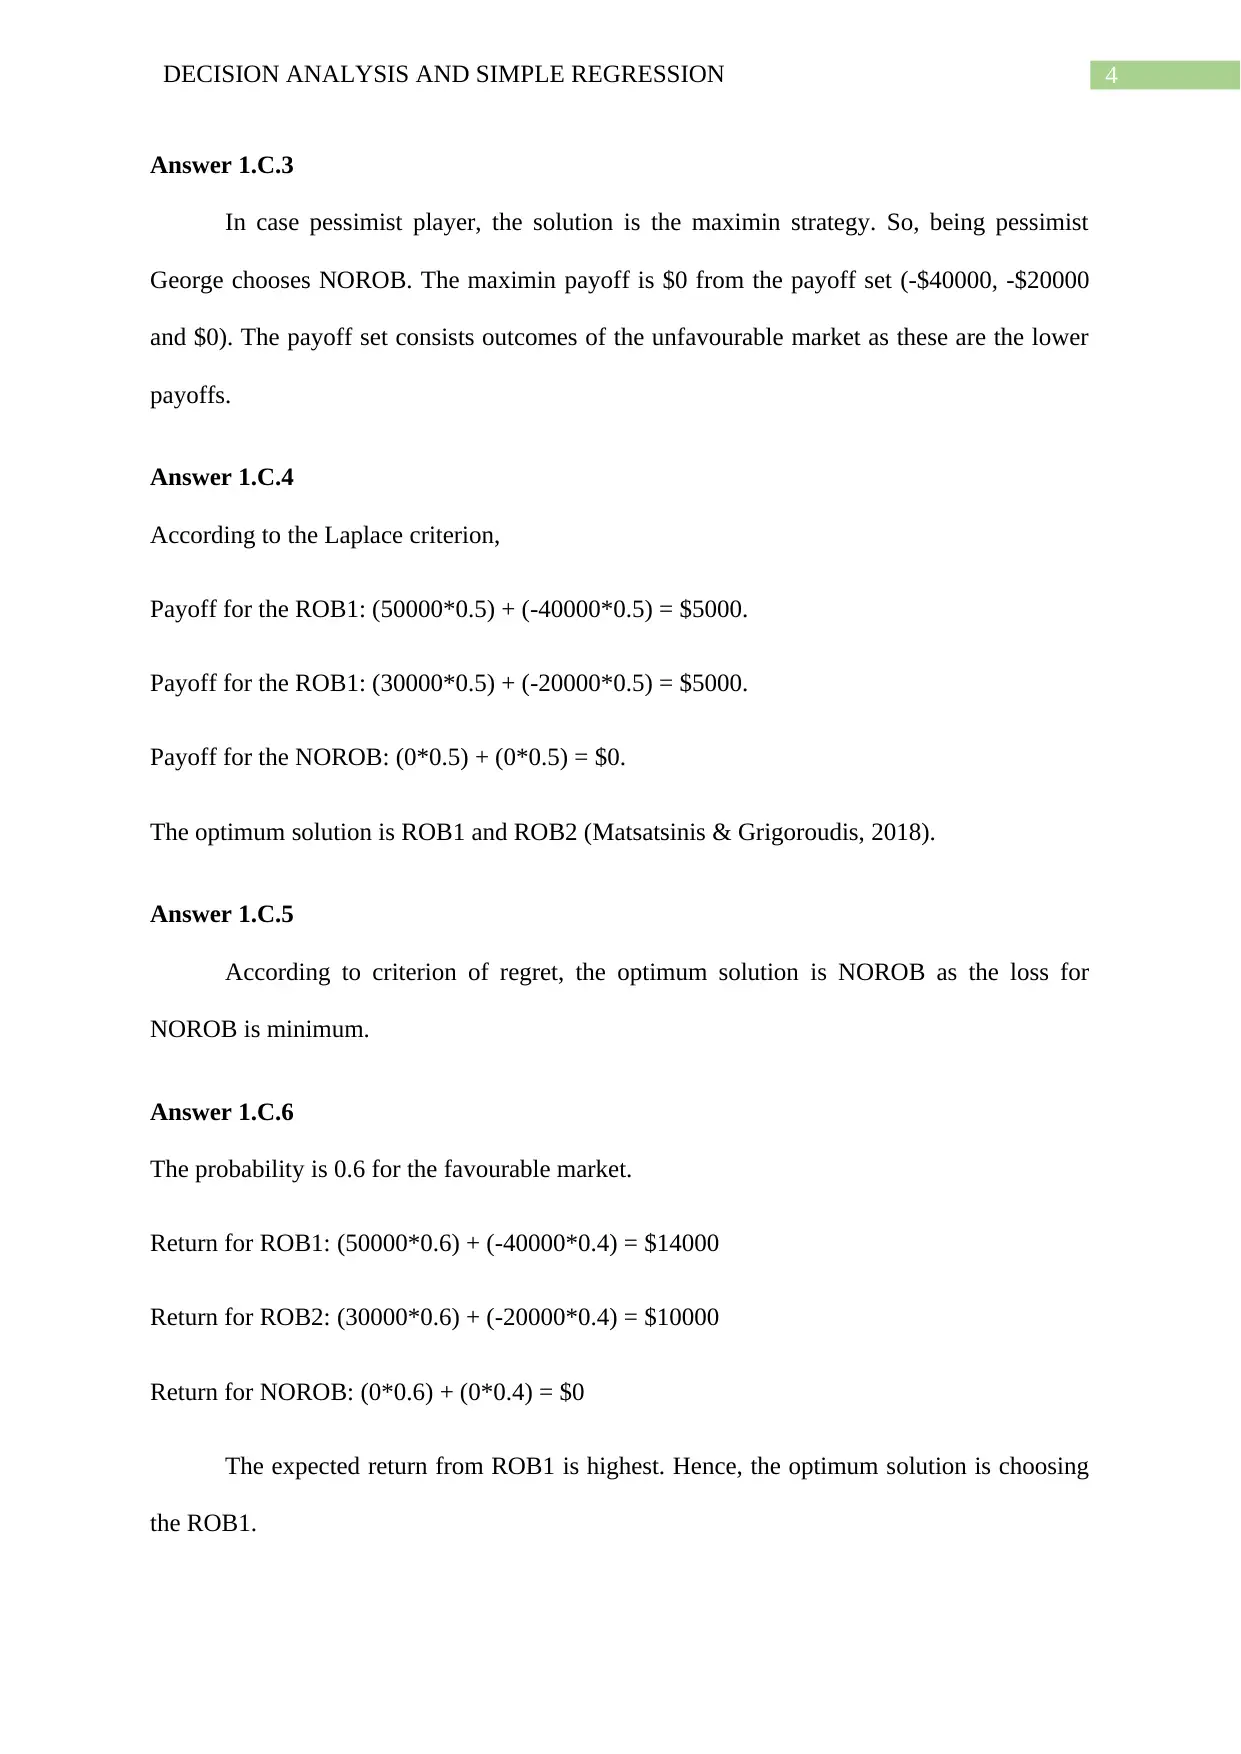
Answer 1.C.3
In case pessimist player, the solution is the maximin strategy. So, being pessimist
George chooses NOROB. The maximin payoff is $0 from the payoff set (-$40000, -$20000
and $0). The payoff set consists outcomes of the unfavourable market as these are the lower
payoffs.
Answer 1.C.4
According to the Laplace criterion,
Payoff for the ROB1: (50000*0.5) + (-40000*0.5) = $5000.
Payoff for the ROB1: (30000*0.5) + (-20000*0.5) = $5000.
Payoff for the NOROB: (0*0.5) + (0*0.5) = $0.
The optimum solution is ROB1 and ROB2 (Matsatsinis & Grigoroudis, 2018).
Answer 1.C.5
According to criterion of regret, the optimum solution is NOROB as the loss for
NOROB is minimum.
Answer 1.C.6
The probability is 0.6 for the favourable market.
Return for ROB1: (50000*0.6) + (-40000*0.4) = $14000
Return for ROB2: (30000*0.6) + (-20000*0.4) = $10000
Return for NOROB: (0*0.6) + (0*0.4) = $0
The expected return from ROB1 is highest. Hence, the optimum solution is choosing
the ROB1.
5DECISION ANALYSIS AND SIMPLE REGRESSION
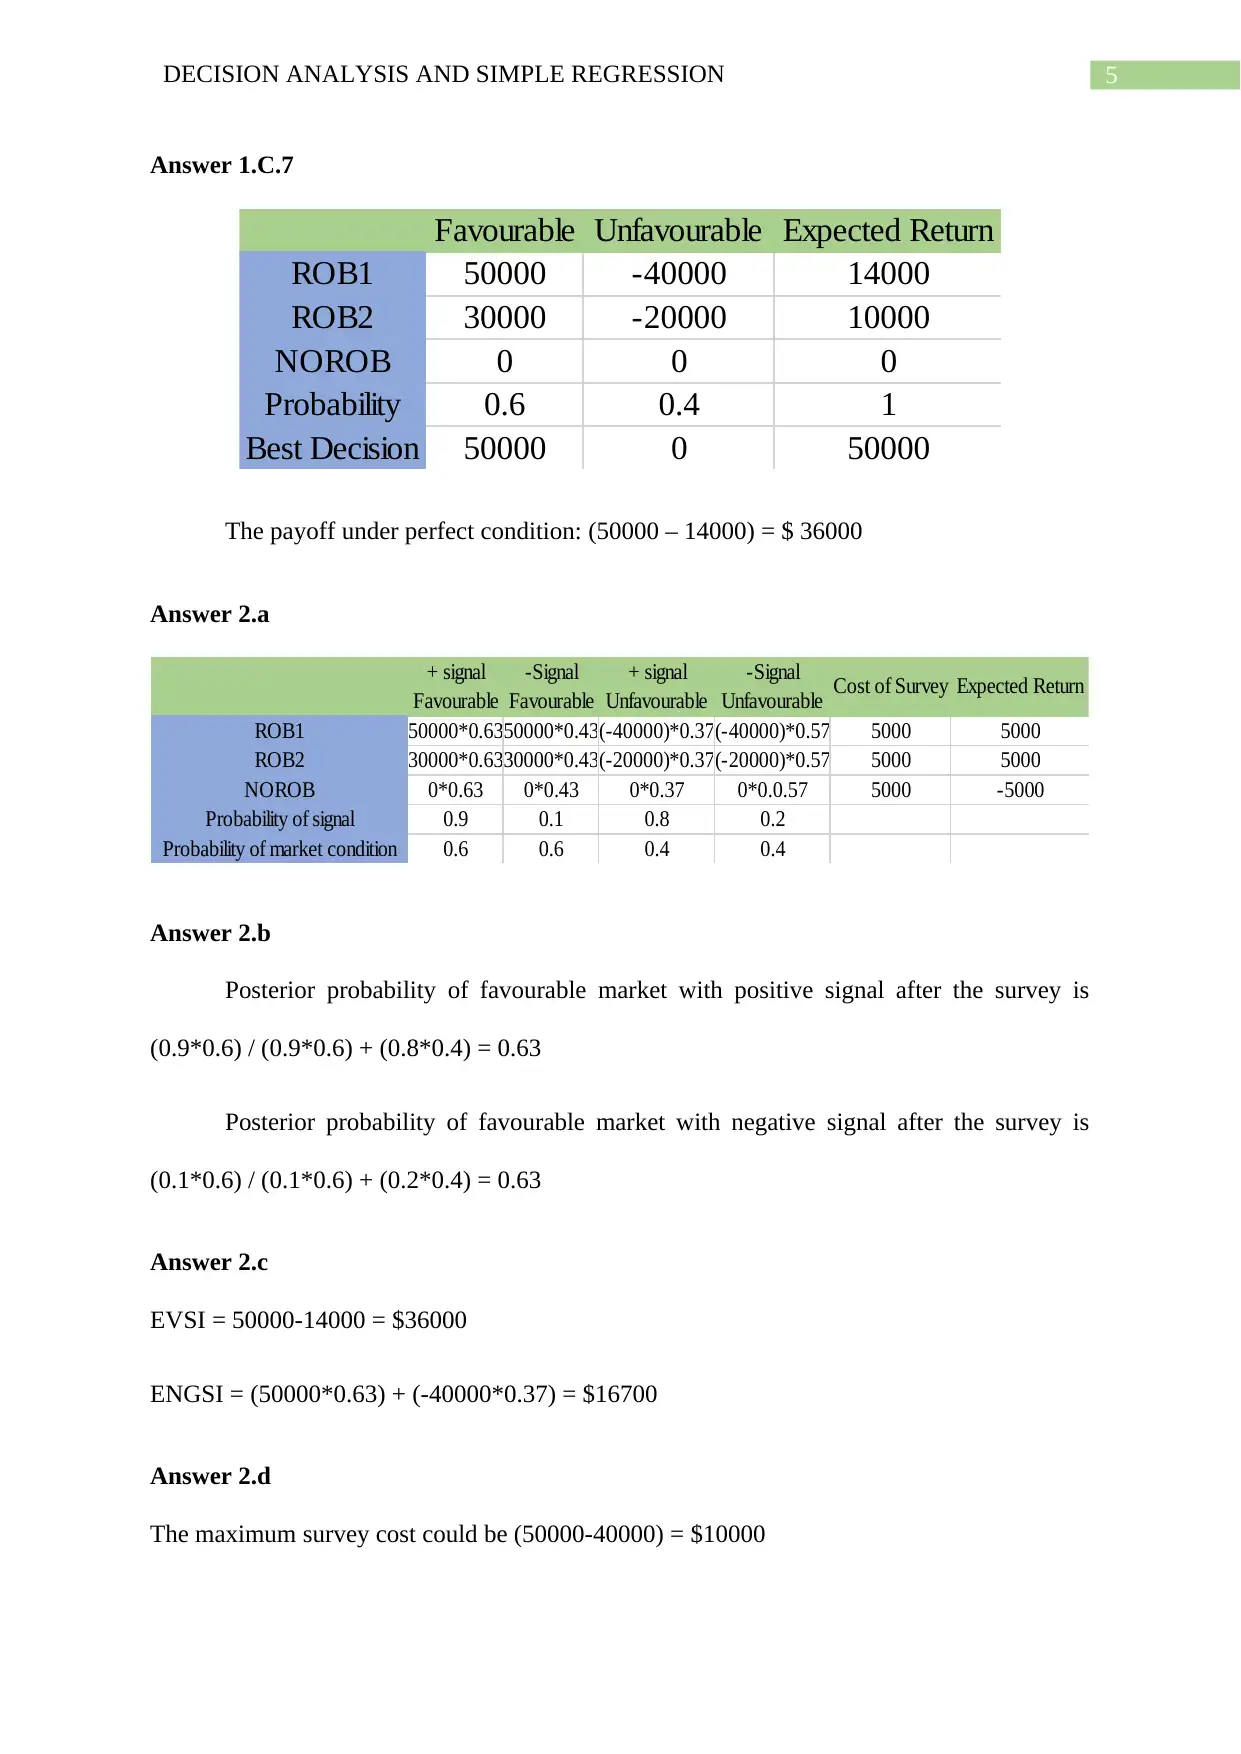
Answer 1.C.7
Favourable Unfavourable Expected Return
ROB1 50000 -40000 14000
ROB2 30000 -20000 10000
NOROB 0 0 0
Probability 0.6 0.4 1
Best Decision 50000 0 50000
The payoff under perfect condition: (50000 – 14000) = $ 36000
Answer 2.a
+ signal -Signal + signal -Signal
Favourable Favourable Unfavourable Unfavourable
ROB1 50000*0.6350000*0.43(-40000)*0.37(-40000)*0.57 5000 5000
ROB2 30000*0.6330000*0.43(-20000)*0.37(-20000)*0.57 5000 5000
NOROB 0*0.63 0*0.43 0*0.37 0*0.0.57 5000 -5000
Probability of signal 0.9 0.1 0.8 0.2
Probability of market condition 0.6 0.6 0.4 0.4
Cost of Survey Expected Return
Answer 2.b
Posterior probability of favourable market with positive signal after the survey is
(0.9*0.6) / (0.9*0.6) + (0.8*0.4) = 0.63
Posterior probability of favourable market with negative signal after the survey is
(0.1*0.6) / (0.1*0.6) + (0.2*0.4) = 0.63
Answer 2.c
EVSI = 50000-14000 = $36000
ENGSI = (50000*0.63) + (-40000*0.37) = $16700
Answer 2.d
The maximum survey cost could be (50000-40000) = $10000
⊘ This is a preview!⊘
Do you want full access?
Subscribe today to unlock all pages.
Trusted by 1+ million students worldwide
6DECISION ANALYSIS AND SIMPLE REGRESSION
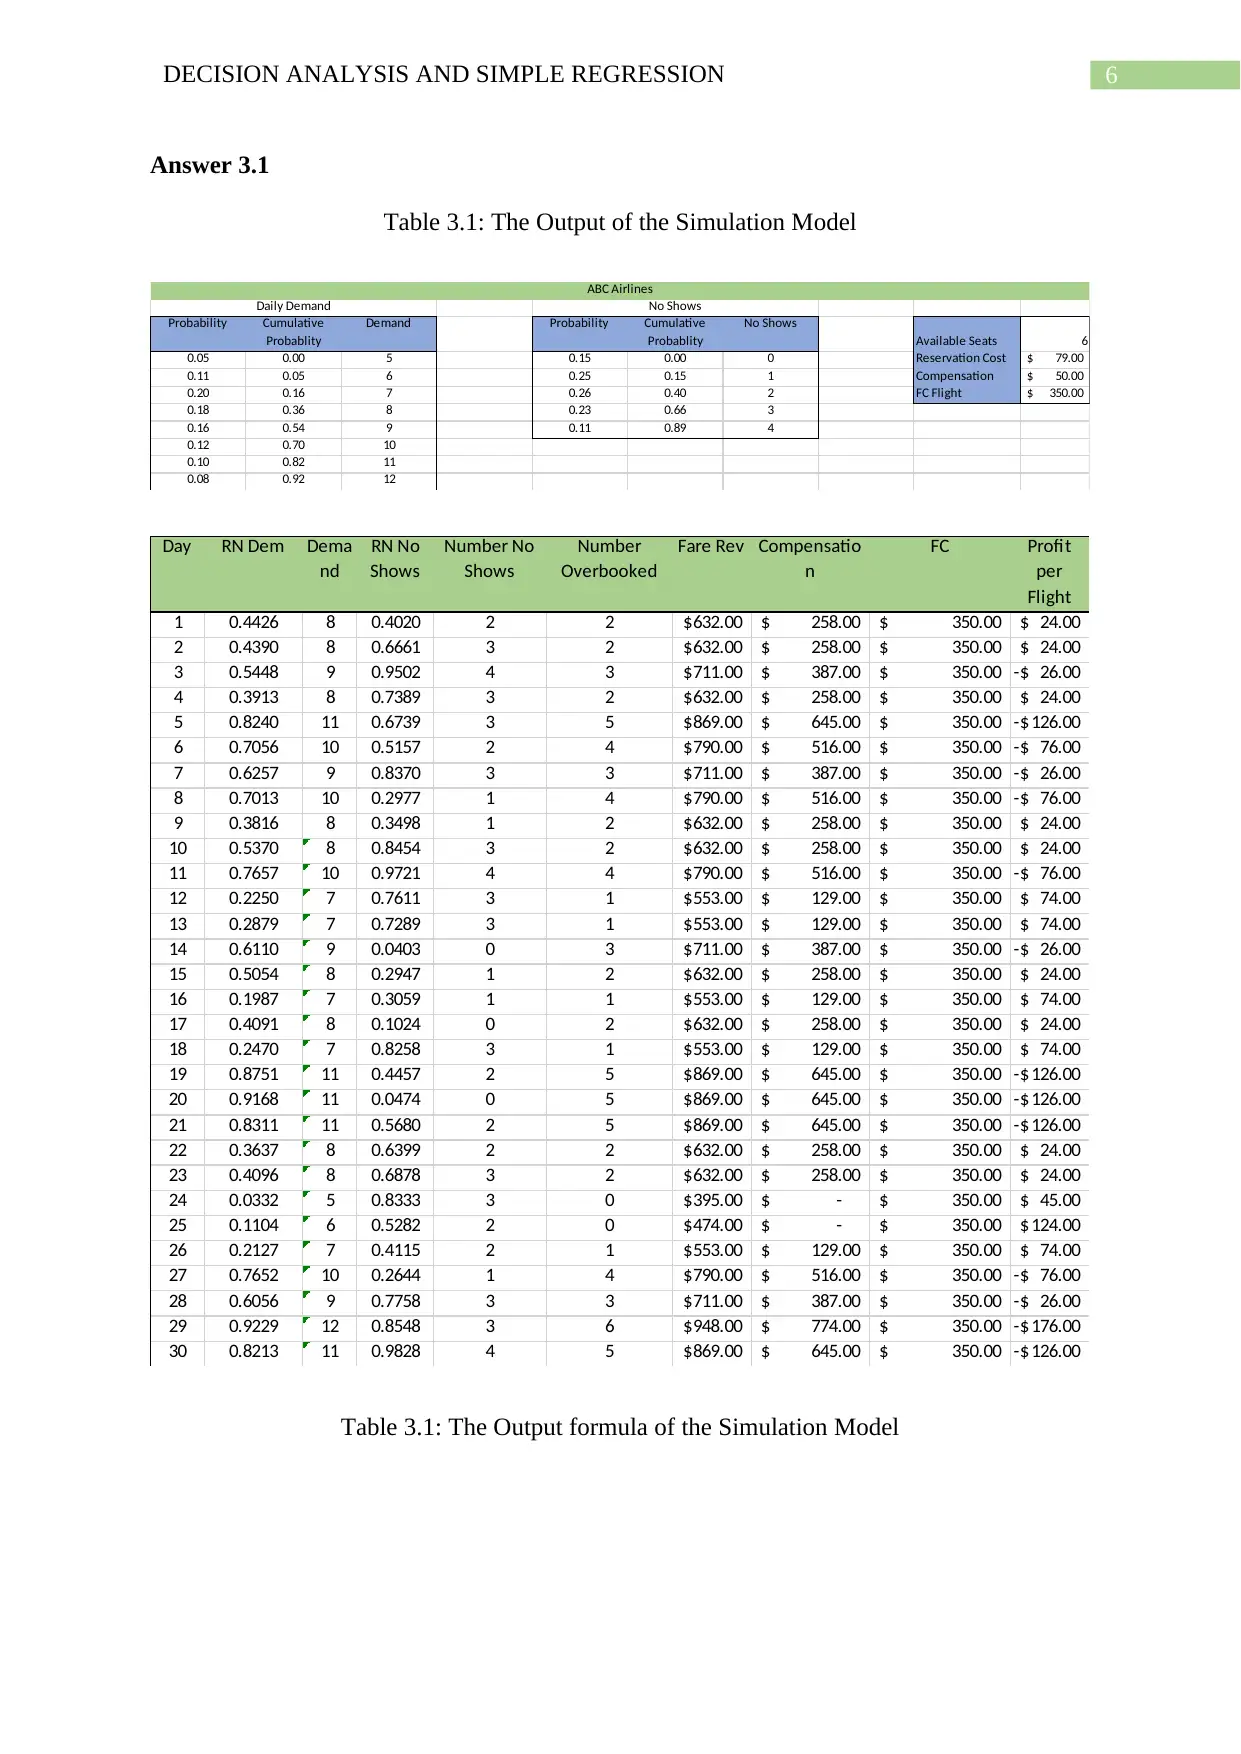
Answer 3.1
Table 3.1: The Output of the Simulation Model
Probability Cumulative
Probablity
Demand Probability Cumulative
Probablity
No Shows
Available Seats 6
0.05 0.00 5 0.15 0.00 0 Reservation Cost 79.00$
0.11 0.05 6 0.25 0.15 1 Compensation 50.00$
0.20 0.16 7 0.26 0.40 2 FC Flight 350.00$
0.18 0.36 8 0.23 0.66 3
0.16 0.54 9 0.11 0.89 4
0.12 0.70 10
0.10 0.82 11
0.08 0.92 12
Daily Demand No Shows
ABC Airlines
Day RN Dem Dema
nd
RN No
Shows
Number No
Shows
Number
Overbooked
Fare Rev Compensatio
n
FC Profit
per
Flight
1 0.4426 8 0.4020 2 2 632.00$ 258.00$ 350.00$ 24.00$
2 0.4390 8 0.6661 3 2 632.00$ 258.00$ 350.00$ 24.00$
3 0.5448 9 0.9502 4 3 711.00$ 387.00$ 350.00$ 26.00-$
4 0.3913 8 0.7389 3 2 632.00$ 258.00$ 350.00$ 24.00$
5 0.8240 11 0.6739 3 5 869.00$ 645.00$ 350.00$ 126.00-$
6 0.7056 10 0.5157 2 4 790.00$ 516.00$ 350.00$ 76.00-$
7 0.6257 9 0.8370 3 3 711.00$ 387.00$ 350.00$ 26.00-$
8 0.7013 10 0.2977 1 4 790.00$ 516.00$ 350.00$ 76.00-$
9 0.3816 8 0.3498 1 2 632.00$ 258.00$ 350.00$ 24.00$
10 0.5370 8 0.8454 3 2 632.00$ 258.00$ 350.00$ 24.00$
11 0.7657 10 0.9721 4 4 790.00$ 516.00$ 350.00$ 76.00-$
12 0.2250 7 0.7611 3 1 553.00$ 129.00$ 350.00$ 74.00$
13 0.2879 7 0.7289 3 1 553.00$ 129.00$ 350.00$ 74.00$
14 0.6110 9 0.0403 0 3 711.00$ 387.00$ 350.00$ 26.00-$
15 0.5054 8 0.2947 1 2 632.00$ 258.00$ 350.00$ 24.00$
16 0.1987 7 0.3059 1 1 553.00$ 129.00$ 350.00$ 74.00$
17 0.4091 8 0.1024 0 2 632.00$ 258.00$ 350.00$ 24.00$
18 0.2470 7 0.8258 3 1 553.00$ 129.00$ 350.00$ 74.00$
19 0.8751 11 0.4457 2 5 869.00$ 645.00$ 350.00$ 126.00-$
20 0.9168 11 0.0474 0 5 869.00$ 645.00$ 350.00$ 126.00-$
21 0.8311 11 0.5680 2 5 869.00$ 645.00$ 350.00$ 126.00-$
22 0.3637 8 0.6399 2 2 632.00$ 258.00$ 350.00$ 24.00$
23 0.4096 8 0.6878 3 2 632.00$ 258.00$ 350.00$ 24.00$
24 0.0332 5 0.8333 3 0 395.00$ -$ 350.00$ 45.00$
25 0.1104 6 0.5282 2 0 474.00$ -$ 350.00$ 124.00$
26 0.2127 7 0.4115 2 1 553.00$ 129.00$ 350.00$ 74.00$
27 0.7652 10 0.2644 1 4 790.00$ 516.00$ 350.00$ 76.00-$
28 0.6056 9 0.7758 3 3 711.00$ 387.00$ 350.00$ 26.00-$
29 0.9229 12 0.8548 3 6 948.00$ 774.00$ 350.00$ 176.00-$
30 0.8213 11 0.9828 4 5 869.00$ 645.00$ 350.00$ 126.00-$
Table 3.1: The Output formula of the Simulation Model
Answer 3.1
Table 3.1: The Output of the Simulation Model
Probability Cumulative
Probablity
Demand Probability Cumulative
Probablity
No Shows
Available Seats 6
0.05 0.00 5 0.15 0.00 0 Reservation Cost 79.00$
0.11 0.05 6 0.25 0.15 1 Compensation 50.00$
0.20 0.16 7 0.26 0.40 2 FC Flight 350.00$
0.18 0.36 8 0.23 0.66 3
0.16 0.54 9 0.11 0.89 4
0.12 0.70 10
0.10 0.82 11
0.08 0.92 12
Daily Demand No Shows
ABC Airlines
Day RN Dem Dema
nd
RN No
Shows
Number No
Shows
Number
Overbooked
Fare Rev Compensatio
n
FC Profit
per
Flight
1 0.4426 8 0.4020 2 2 632.00$ 258.00$ 350.00$ 24.00$
2 0.4390 8 0.6661 3 2 632.00$ 258.00$ 350.00$ 24.00$
3 0.5448 9 0.9502 4 3 711.00$ 387.00$ 350.00$ 26.00-$
4 0.3913 8 0.7389 3 2 632.00$ 258.00$ 350.00$ 24.00$
5 0.8240 11 0.6739 3 5 869.00$ 645.00$ 350.00$ 126.00-$
6 0.7056 10 0.5157 2 4 790.00$ 516.00$ 350.00$ 76.00-$
7 0.6257 9 0.8370 3 3 711.00$ 387.00$ 350.00$ 26.00-$
8 0.7013 10 0.2977 1 4 790.00$ 516.00$ 350.00$ 76.00-$
9 0.3816 8 0.3498 1 2 632.00$ 258.00$ 350.00$ 24.00$
10 0.5370 8 0.8454 3 2 632.00$ 258.00$ 350.00$ 24.00$
11 0.7657 10 0.9721 4 4 790.00$ 516.00$ 350.00$ 76.00-$
12 0.2250 7 0.7611 3 1 553.00$ 129.00$ 350.00$ 74.00$
13 0.2879 7 0.7289 3 1 553.00$ 129.00$ 350.00$ 74.00$
14 0.6110 9 0.0403 0 3 711.00$ 387.00$ 350.00$ 26.00-$
15 0.5054 8 0.2947 1 2 632.00$ 258.00$ 350.00$ 24.00$
16 0.1987 7 0.3059 1 1 553.00$ 129.00$ 350.00$ 74.00$
17 0.4091 8 0.1024 0 2 632.00$ 258.00$ 350.00$ 24.00$
18 0.2470 7 0.8258 3 1 553.00$ 129.00$ 350.00$ 74.00$
19 0.8751 11 0.4457 2 5 869.00$ 645.00$ 350.00$ 126.00-$
20 0.9168 11 0.0474 0 5 869.00$ 645.00$ 350.00$ 126.00-$
21 0.8311 11 0.5680 2 5 869.00$ 645.00$ 350.00$ 126.00-$
22 0.3637 8 0.6399 2 2 632.00$ 258.00$ 350.00$ 24.00$
23 0.4096 8 0.6878 3 2 632.00$ 258.00$ 350.00$ 24.00$
24 0.0332 5 0.8333 3 0 395.00$ -$ 350.00$ 45.00$
25 0.1104 6 0.5282 2 0 474.00$ -$ 350.00$ 124.00$
26 0.2127 7 0.4115 2 1 553.00$ 129.00$ 350.00$ 74.00$
27 0.7652 10 0.2644 1 4 790.00$ 516.00$ 350.00$ 76.00-$
28 0.6056 9 0.7758 3 3 711.00$ 387.00$ 350.00$ 26.00-$
29 0.9229 12 0.8548 3 6 948.00$ 774.00$ 350.00$ 176.00-$
30 0.8213 11 0.9828 4 5 869.00$ 645.00$ 350.00$ 126.00-$
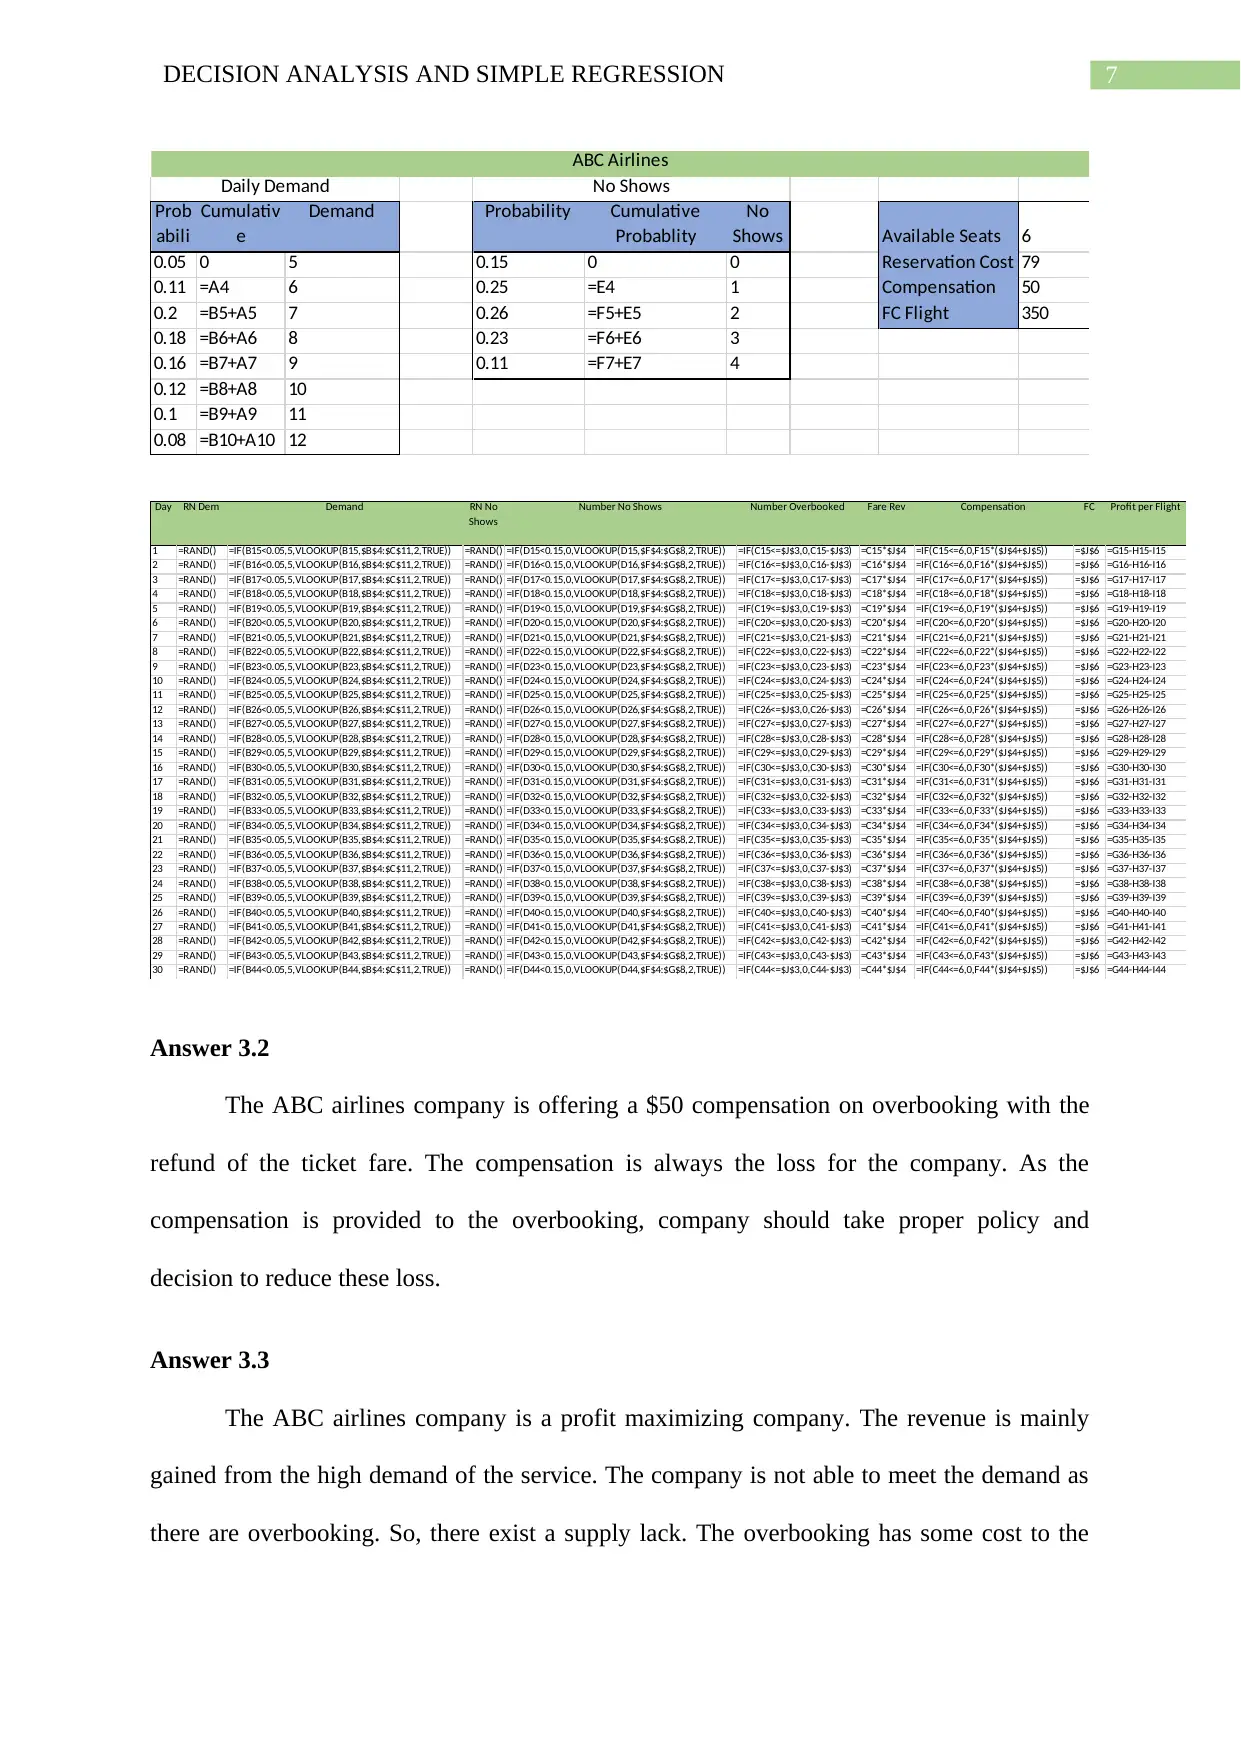
Table 3.1: The Output formula of the Simulation Model
Paraphrase This Document
Need a fresh take? Get an instant paraphrase of this document with our AI Paraphraser
7DECISION ANALYSIS AND SIMPLE REGRESSION
Prob
abili
Cumulativ
e
Demand Probability Cumulative
Probablity
No
Shows Available Seats 6
0.05 0 5 0.15 0 0 Reservation Cost 79
0.11 =A4 6 0.25 =E4 1 Compensation 50
0.2 =B5+A5 7 0.26 =F5+E5 2 FC Flight 350
0.18 =B6+A6 8 0.23 =F6+E6 3
0.16 =B7+A7 9 0.11 =F7+E7 4
0.12 =B8+A8 10
0.1 =B9+A9 11
0.08 =B10+A10 12
Daily Demand No Shows
ABC Airlines
Day RN Dem Demand RN No
Shows
Number No Shows Number Overbooked Fare Rev Compensation FC Profit per Flight
1 =RAND() =IF(B15<0.05,5,VLOOKUP(B15,$B$4:$C$11,2,TRUE)) =RAND() =IF(D15<0.15,0,VLOOKUP(D15,$F$4:$G$8,2,TRUE)) =IF(C15<=$J$3,0,C15-$J$3) =C15*$J$4 =IF(C15<=6,0,F15*($J$4+$J$5)) =$J$6 =G15-H15-I15
2 =RAND() =IF(B16<0.05,5,VLOOKUP(B16,$B$4:$C$11,2,TRUE)) =RAND() =IF(D16<0.15,0,VLOOKUP(D16,$F$4:$G$8,2,TRUE)) =IF(C16<=$J$3,0,C16-$J$3) =C16*$J$4 =IF(C16<=6,0,F16*($J$4+$J$5)) =$J$6 =G16-H16-I16
3 =RAND() =IF(B17<0.05,5,VLOOKUP(B17,$B$4:$C$11,2,TRUE)) =RAND() =IF(D17<0.15,0,VLOOKUP(D17,$F$4:$G$8,2,TRUE)) =IF(C17<=$J$3,0,C17-$J$3) =C17*$J$4 =IF(C17<=6,0,F17*($J$4+$J$5)) =$J$6 =G17-H17-I17
4 =RAND() =IF(B18<0.05,5,VLOOKUP(B18,$B$4:$C$11,2,TRUE)) =RAND() =IF(D18<0.15,0,VLOOKUP(D18,$F$4:$G$8,2,TRUE)) =IF(C18<=$J$3,0,C18-$J$3) =C18*$J$4 =IF(C18<=6,0,F18*($J$4+$J$5)) =$J$6 =G18-H18-I18
5 =RAND() =IF(B19<0.05,5,VLOOKUP(B19,$B$4:$C$11,2,TRUE)) =RAND() =IF(D19<0.15,0,VLOOKUP(D19,$F$4:$G$8,2,TRUE)) =IF(C19<=$J$3,0,C19-$J$3) =C19*$J$4 =IF(C19<=6,0,F19*($J$4+$J$5)) =$J$6 =G19-H19-I19
6 =RAND() =IF(B20<0.05,5,VLOOKUP(B20,$B$4:$C$11,2,TRUE)) =RAND() =IF(D20<0.15,0,VLOOKUP(D20,$F$4:$G$8,2,TRUE)) =IF(C20<=$J$3,0,C20-$J$3) =C20*$J$4 =IF(C20<=6,0,F20*($J$4+$J$5)) =$J$6 =G20-H20-I20
7 =RAND() =IF(B21<0.05,5,VLOOKUP(B21,$B$4:$C$11,2,TRUE)) =RAND() =IF(D21<0.15,0,VLOOKUP(D21,$F$4:$G$8,2,TRUE)) =IF(C21<=$J$3,0,C21-$J$3) =C21*$J$4 =IF(C21<=6,0,F21*($J$4+$J$5)) =$J$6 =G21-H21-I21
8 =RAND() =IF(B22<0.05,5,VLOOKUP(B22,$B$4:$C$11,2,TRUE)) =RAND() =IF(D22<0.15,0,VLOOKUP(D22,$F$4:$G$8,2,TRUE)) =IF(C22<=$J$3,0,C22-$J$3) =C22*$J$4 =IF(C22<=6,0,F22*($J$4+$J$5)) =$J$6 =G22-H22-I22
9 =RAND() =IF(B23<0.05,5,VLOOKUP(B23,$B$4:$C$11,2,TRUE)) =RAND() =IF(D23<0.15,0,VLOOKUP(D23,$F$4:$G$8,2,TRUE)) =IF(C23<=$J$3,0,C23-$J$3) =C23*$J$4 =IF(C23<=6,0,F23*($J$4+$J$5)) =$J$6 =G23-H23-I23
10 =RAND() =IF(B24<0.05,5,VLOOKUP(B24,$B$4:$C$11,2,TRUE)) =RAND() =IF(D24<0.15,0,VLOOKUP(D24,$F$4:$G$8,2,TRUE)) =IF(C24<=$J$3,0,C24-$J$3) =C24*$J$4 =IF(C24<=6,0,F24*($J$4+$J$5)) =$J$6 =G24-H24-I24
11 =RAND() =IF(B25<0.05,5,VLOOKUP(B25,$B$4:$C$11,2,TRUE)) =RAND() =IF(D25<0.15,0,VLOOKUP(D25,$F$4:$G$8,2,TRUE)) =IF(C25<=$J$3,0,C25-$J$3) =C25*$J$4 =IF(C25<=6,0,F25*($J$4+$J$5)) =$J$6 =G25-H25-I25
12 =RAND() =IF(B26<0.05,5,VLOOKUP(B26,$B$4:$C$11,2,TRUE)) =RAND() =IF(D26<0.15,0,VLOOKUP(D26,$F$4:$G$8,2,TRUE)) =IF(C26<=$J$3,0,C26-$J$3) =C26*$J$4 =IF(C26<=6,0,F26*($J$4+$J$5)) =$J$6 =G26-H26-I26
13 =RAND() =IF(B27<0.05,5,VLOOKUP(B27,$B$4:$C$11,2,TRUE)) =RAND() =IF(D27<0.15,0,VLOOKUP(D27,$F$4:$G$8,2,TRUE)) =IF(C27<=$J$3,0,C27-$J$3) =C27*$J$4 =IF(C27<=6,0,F27*($J$4+$J$5)) =$J$6 =G27-H27-I27
14 =RAND() =IF(B28<0.05,5,VLOOKUP(B28,$B$4:$C$11,2,TRUE)) =RAND() =IF(D28<0.15,0,VLOOKUP(D28,$F$4:$G$8,2,TRUE)) =IF(C28<=$J$3,0,C28-$J$3) =C28*$J$4 =IF(C28<=6,0,F28*($J$4+$J$5)) =$J$6 =G28-H28-I28
15 =RAND() =IF(B29<0.05,5,VLOOKUP(B29,$B$4:$C$11,2,TRUE)) =RAND() =IF(D29<0.15,0,VLOOKUP(D29,$F$4:$G$8,2,TRUE)) =IF(C29<=$J$3,0,C29-$J$3) =C29*$J$4 =IF(C29<=6,0,F29*($J$4+$J$5)) =$J$6 =G29-H29-I29
16 =RAND() =IF(B30<0.05,5,VLOOKUP(B30,$B$4:$C$11,2,TRUE)) =RAND() =IF(D30<0.15,0,VLOOKUP(D30,$F$4:$G$8,2,TRUE)) =IF(C30<=$J$3,0,C30-$J$3) =C30*$J$4 =IF(C30<=6,0,F30*($J$4+$J$5)) =$J$6 =G30-H30-I30
17 =RAND() =IF(B31<0.05,5,VLOOKUP(B31,$B$4:$C$11,2,TRUE)) =RAND() =IF(D31<0.15,0,VLOOKUP(D31,$F$4:$G$8,2,TRUE)) =IF(C31<=$J$3,0,C31-$J$3) =C31*$J$4 =IF(C31<=6,0,F31*($J$4+$J$5)) =$J$6 =G31-H31-I31
18 =RAND() =IF(B32<0.05,5,VLOOKUP(B32,$B$4:$C$11,2,TRUE)) =RAND() =IF(D32<0.15,0,VLOOKUP(D32,$F$4:$G$8,2,TRUE)) =IF(C32<=$J$3,0,C32-$J$3) =C32*$J$4 =IF(C32<=6,0,F32*($J$4+$J$5)) =$J$6 =G32-H32-I32
19 =RAND() =IF(B33<0.05,5,VLOOKUP(B33,$B$4:$C$11,2,TRUE)) =RAND() =IF(D33<0.15,0,VLOOKUP(D33,$F$4:$G$8,2,TRUE)) =IF(C33<=$J$3,0,C33-$J$3) =C33*$J$4 =IF(C33<=6,0,F33*($J$4+$J$5)) =$J$6 =G33-H33-I33
20 =RAND() =IF(B34<0.05,5,VLOOKUP(B34,$B$4:$C$11,2,TRUE)) =RAND() =IF(D34<0.15,0,VLOOKUP(D34,$F$4:$G$8,2,TRUE)) =IF(C34<=$J$3,0,C34-$J$3) =C34*$J$4 =IF(C34<=6,0,F34*($J$4+$J$5)) =$J$6 =G34-H34-I34
21 =RAND() =IF(B35<0.05,5,VLOOKUP(B35,$B$4:$C$11,2,TRUE)) =RAND() =IF(D35<0.15,0,VLOOKUP(D35,$F$4:$G$8,2,TRUE)) =IF(C35<=$J$3,0,C35-$J$3) =C35*$J$4 =IF(C35<=6,0,F35*($J$4+$J$5)) =$J$6 =G35-H35-I35
22 =RAND() =IF(B36<0.05,5,VLOOKUP(B36,$B$4:$C$11,2,TRUE)) =RAND() =IF(D36<0.15,0,VLOOKUP(D36,$F$4:$G$8,2,TRUE)) =IF(C36<=$J$3,0,C36-$J$3) =C36*$J$4 =IF(C36<=6,0,F36*($J$4+$J$5)) =$J$6 =G36-H36-I36
23 =RAND() =IF(B37<0.05,5,VLOOKUP(B37,$B$4:$C$11,2,TRUE)) =RAND() =IF(D37<0.15,0,VLOOKUP(D37,$F$4:$G$8,2,TRUE)) =IF(C37<=$J$3,0,C37-$J$3) =C37*$J$4 =IF(C37<=6,0,F37*($J$4+$J$5)) =$J$6 =G37-H37-I37
24 =RAND() =IF(B38<0.05,5,VLOOKUP(B38,$B$4:$C$11,2,TRUE)) =RAND() =IF(D38<0.15,0,VLOOKUP(D38,$F$4:$G$8,2,TRUE)) =IF(C38<=$J$3,0,C38-$J$3) =C38*$J$4 =IF(C38<=6,0,F38*($J$4+$J$5)) =$J$6 =G38-H38-I38
25 =RAND() =IF(B39<0.05,5,VLOOKUP(B39,$B$4:$C$11,2,TRUE)) =RAND() =IF(D39<0.15,0,VLOOKUP(D39,$F$4:$G$8,2,TRUE)) =IF(C39<=$J$3,0,C39-$J$3) =C39*$J$4 =IF(C39<=6,0,F39*($J$4+$J$5)) =$J$6 =G39-H39-I39
26 =RAND() =IF(B40<0.05,5,VLOOKUP(B40,$B$4:$C$11,2,TRUE)) =RAND() =IF(D40<0.15,0,VLOOKUP(D40,$F$4:$G$8,2,TRUE)) =IF(C40<=$J$3,0,C40-$J$3) =C40*$J$4 =IF(C40<=6,0,F40*($J$4+$J$5)) =$J$6 =G40-H40-I40
27 =RAND() =IF(B41<0.05,5,VLOOKUP(B41,$B$4:$C$11,2,TRUE)) =RAND() =IF(D41<0.15,0,VLOOKUP(D41,$F$4:$G$8,2,TRUE)) =IF(C41<=$J$3,0,C41-$J$3) =C41*$J$4 =IF(C41<=6,0,F41*($J$4+$J$5)) =$J$6 =G41-H41-I41
28 =RAND() =IF(B42<0.05,5,VLOOKUP(B42,$B$4:$C$11,2,TRUE)) =RAND() =IF(D42<0.15,0,VLOOKUP(D42,$F$4:$G$8,2,TRUE)) =IF(C42<=$J$3,0,C42-$J$3) =C42*$J$4 =IF(C42<=6,0,F42*($J$4+$J$5)) =$J$6 =G42-H42-I42
29 =RAND() =IF(B43<0.05,5,VLOOKUP(B43,$B$4:$C$11,2,TRUE)) =RAND() =IF(D43<0.15,0,VLOOKUP(D43,$F$4:$G$8,2,TRUE)) =IF(C43<=$J$3,0,C43-$J$3) =C43*$J$4 =IF(C43<=6,0,F43*($J$4+$J$5)) =$J$6 =G43-H43-I43
30 =RAND() =IF(B44<0.05,5,VLOOKUP(B44,$B$4:$C$11,2,TRUE)) =RAND() =IF(D44<0.15,0,VLOOKUP(D44,$F$4:$G$8,2,TRUE)) =IF(C44<=$J$3,0,C44-$J$3) =C44*$J$4 =IF(C44<=6,0,F44*($J$4+$J$5)) =$J$6 =G44-H44-I44
Answer 3.2
The ABC airlines company is offering a $50 compensation on overbooking with the
refund of the ticket fare. The compensation is always the loss for the company. As the
compensation is provided to the overbooking, company should take proper policy and
decision to reduce these loss.
Answer 3.3
The ABC airlines company is a profit maximizing company. The revenue is mainly
gained from the high demand of the service. The company is not able to meet the demand as
there are overbooking. So, there exist a supply lack. The overbooking has some cost to the
8DECISION ANALYSIS AND SIMPLE REGRESSION
company which is equal to $50 per overbooking. This loss could be reduced by providing the
seats to all the customers. This could be done by proper estimation of the demand for the
ABC airlines. It can be said that the overbooking is the excess demand for the company. One
other way, is to charge a higher price to compensate the overbooking charges to the company
which is provided to the customers at the time of refund as a compensation. The fare can be
calculated by the following equation:
The new fare=fare + (no . of overbooking)∗50
the number of passenger
However, the formula needs the predicted number of passenger and the no. of over
bookings. Therefore, it is very important to predict the demand for the services of ABC
airlines.
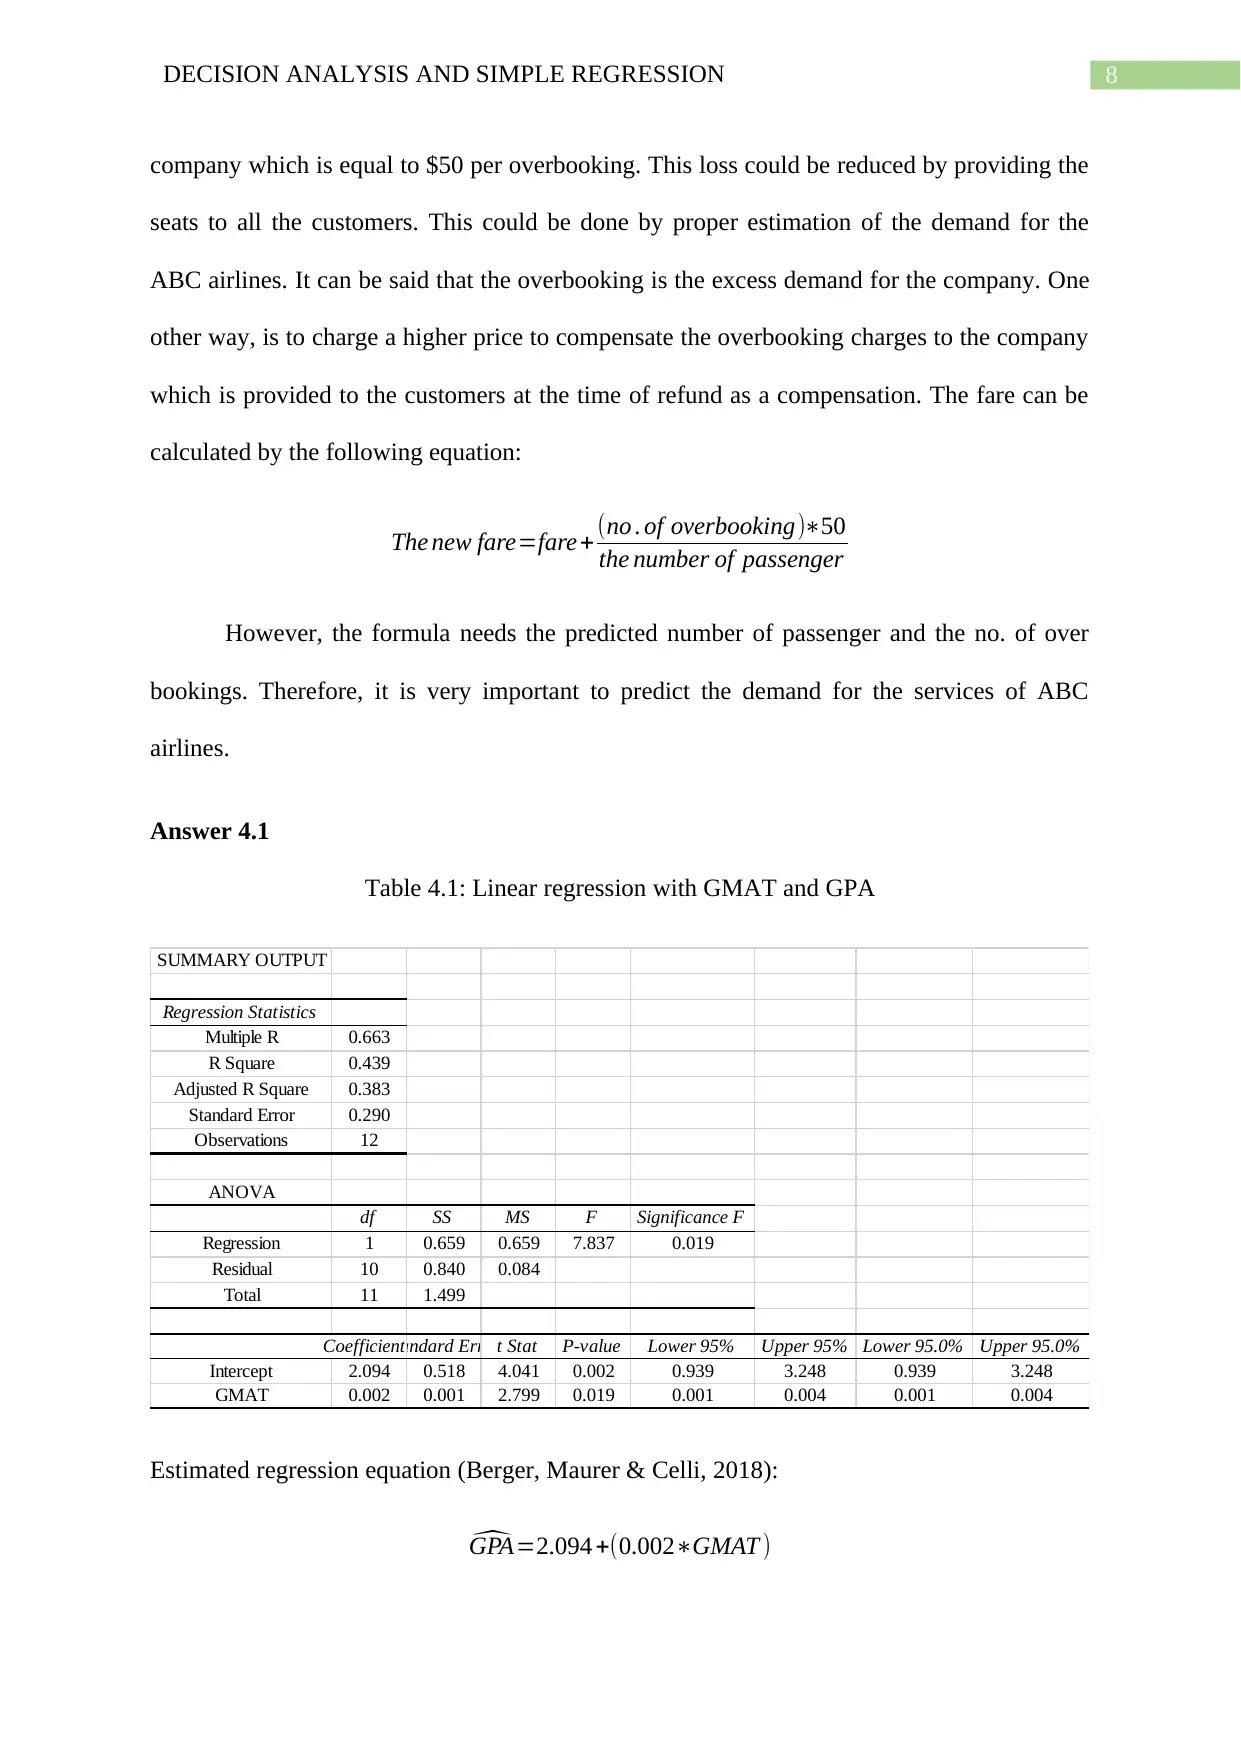
Answer 4.1
Table 4.1: Linear regression with GMAT and GPA
SUMMARY OUTPUT
Regression Statistics
Multiple R 0.663
R Square 0.439
Adjusted R Square 0.383
Standard Error 0.290
Observations 12
ANOVA
df SS MS F Significance F
Regression 1 0.659 0.659 7.837 0.019
Residual 10 0.840 0.084
Total 11 1.499
CoefficientsStandard Errort Stat P-value Lower 95% Upper 95% Lower 95.0% Upper 95.0%
Intercept 2.094 0.518 4.041 0.002 0.939 3.248 0.939 3.248
GMAT 0.002 0.001 2.799 0.019 0.001 0.004 0.001 0.004
Estimated regression equation (Berger, Maurer & Celli, 2018):
^GPA=2.094 +(0.002∗GMAT )
company which is equal to $50 per overbooking. This loss could be reduced by providing the
seats to all the customers. This could be done by proper estimation of the demand for the
ABC airlines. It can be said that the overbooking is the excess demand for the company. One
other way, is to charge a higher price to compensate the overbooking charges to the company
which is provided to the customers at the time of refund as a compensation. The fare can be
calculated by the following equation:
The new fare=fare + (no . of overbooking)∗50
the number of passenger
However, the formula needs the predicted number of passenger and the no. of over
bookings. Therefore, it is very important to predict the demand for the services of ABC
airlines.
Answer 4.1
Table 4.1: Linear regression with GMAT and GPA
SUMMARY OUTPUT
Regression Statistics
Multiple R 0.663
R Square 0.439
Adjusted R Square 0.383
Standard Error 0.290
Observations 12
ANOVA
df SS MS F Significance F
Regression 1 0.659 0.659 7.837 0.019
Residual 10 0.840 0.084
Total 11 1.499
CoefficientsStandard Errort Stat P-value Lower 95% Upper 95% Lower 95.0% Upper 95.0%
Intercept 2.094 0.518 4.041 0.002 0.939 3.248 0.939 3.248
GMAT 0.002 0.001 2.799 0.019 0.001 0.004 0.001 0.004
Estimated regression equation (Berger, Maurer & Celli, 2018):
^GPA=2.094 +(0.002∗GMAT )
⊘ This is a preview!⊘
Do you want full access?
Subscribe today to unlock all pages.
Trusted by 1+ million students worldwide
9DECISION ANALYSIS AND SIMPLE REGRESSION
The R2 is 0.439. This implies that the model is able to predict GPA with GMAT by
43.9% accuracy. The F-stat is F (1, 10) = 7.837 with the p-value 0.019. The model is able to
explain the GPA by GMAT at 5% significance level.
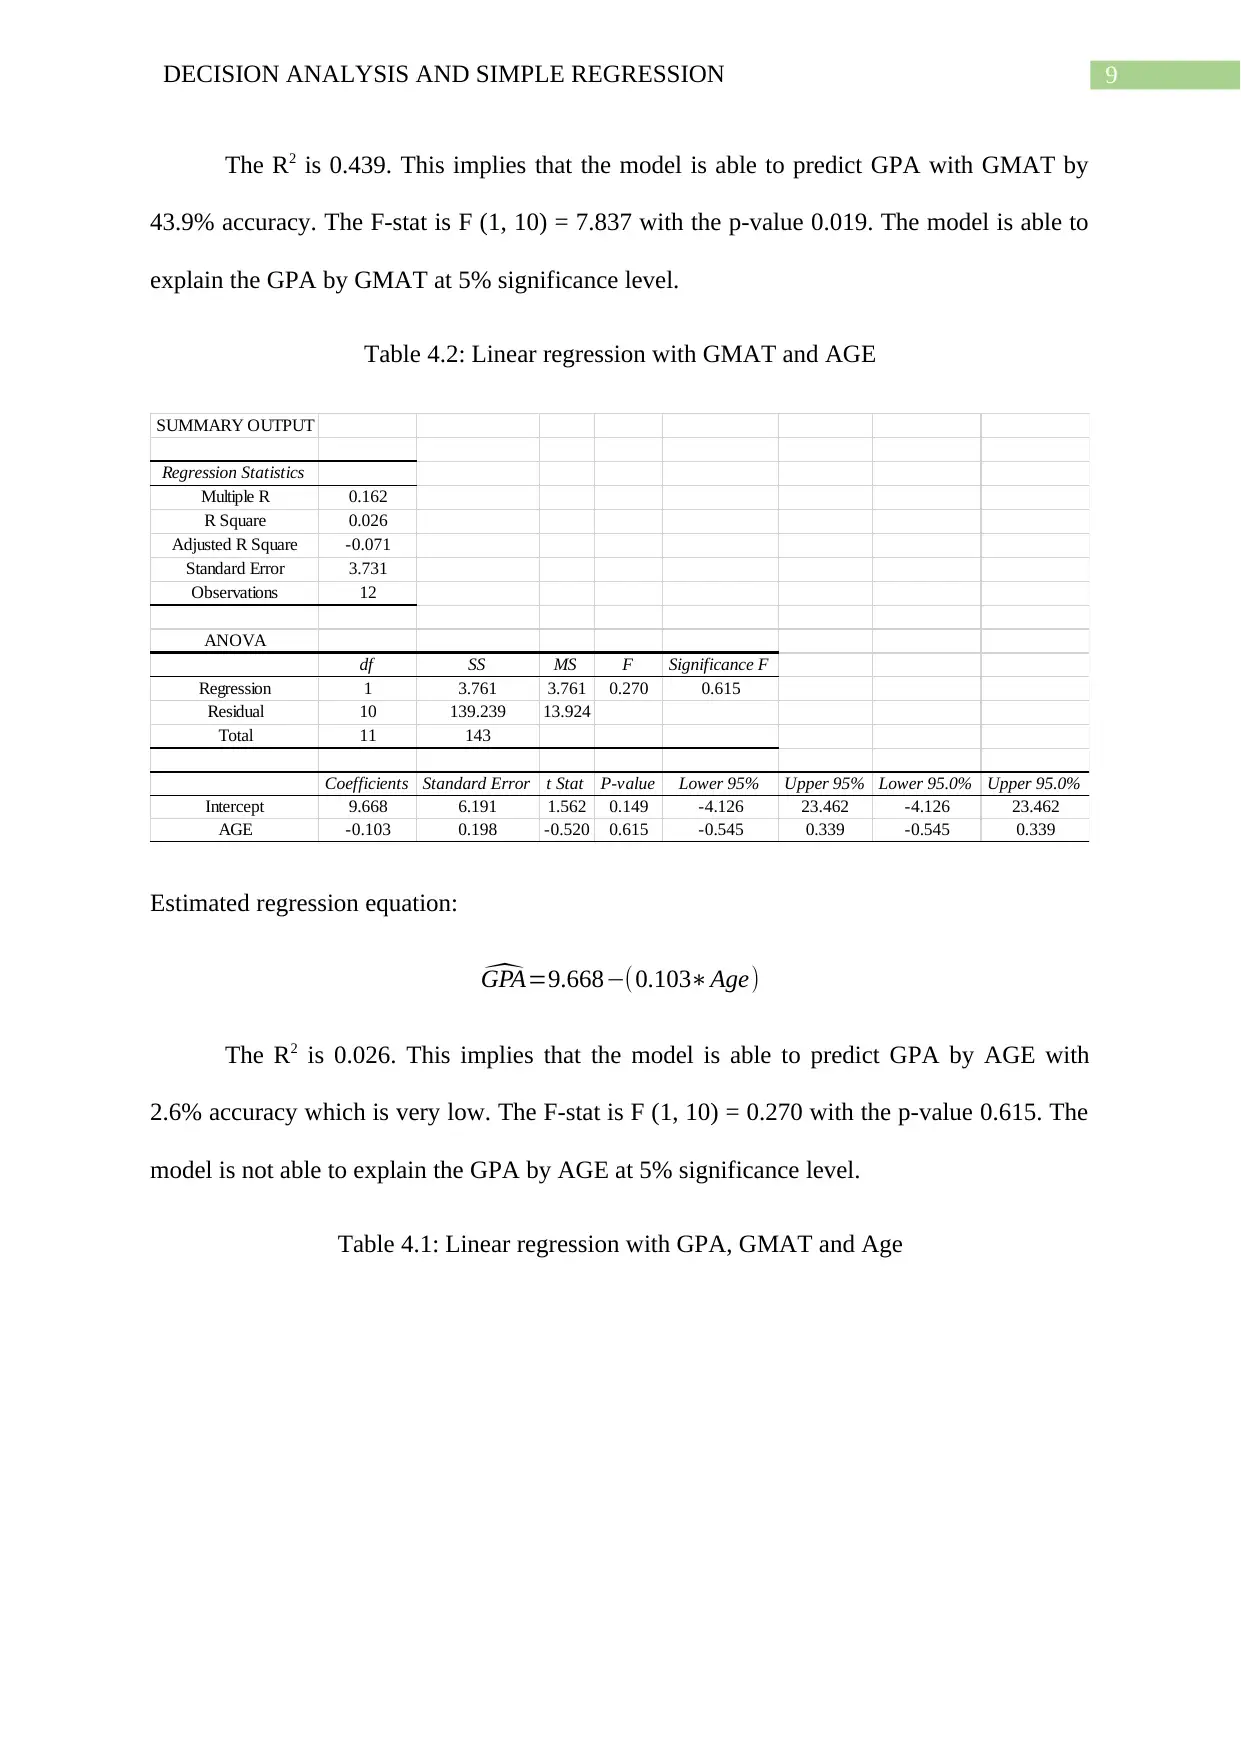
Table 4.2: Linear regression with GMAT and AGE
SUMMARY OUTPUT
Regression Statistics
Multiple R 0.162
R Square 0.026
Adjusted R Square -0.071
Standard Error 3.731
Observations 12
ANOVA
df SS MS F Significance F
Regression 1 3.761 3.761 0.270 0.615
Residual 10 139.239 13.924
Total 11 143
Coefficients Standard Error t Stat P-value Lower 95% Upper 95% Lower 95.0% Upper 95.0%
Intercept 9.668 6.191 1.562 0.149 -4.126 23.462 -4.126 23.462
AGE -0.103 0.198 -0.520 0.615 -0.545 0.339 -0.545 0.339
Estimated regression equation:
^GPA=9.668−(0.103∗Age)
The R2 is 0.026. This implies that the model is able to predict GPA by AGE with
2.6% accuracy which is very low. The F-stat is F (1, 10) = 0.270 with the p-value 0.615. The
model is not able to explain the GPA by AGE at 5% significance level.
Table 4.1: Linear regression with GPA, GMAT and Age
The R2 is 0.439. This implies that the model is able to predict GPA with GMAT by
43.9% accuracy. The F-stat is F (1, 10) = 7.837 with the p-value 0.019. The model is able to
explain the GPA by GMAT at 5% significance level.
Table 4.2: Linear regression with GMAT and AGE
SUMMARY OUTPUT
Regression Statistics
Multiple R 0.162
R Square 0.026
Adjusted R Square -0.071
Standard Error 3.731
Observations 12
ANOVA
df SS MS F Significance F
Regression 1 3.761 3.761 0.270 0.615
Residual 10 139.239 13.924
Total 11 143
Coefficients Standard Error t Stat P-value Lower 95% Upper 95% Lower 95.0% Upper 95.0%
Intercept 9.668 6.191 1.562 0.149 -4.126 23.462 -4.126 23.462
AGE -0.103 0.198 -0.520 0.615 -0.545 0.339 -0.545 0.339
Estimated regression equation:
^GPA=9.668−(0.103∗Age)
The R2 is 0.026. This implies that the model is able to predict GPA by AGE with
2.6% accuracy which is very low. The F-stat is F (1, 10) = 0.270 with the p-value 0.615. The
model is not able to explain the GPA by AGE at 5% significance level.
Table 4.1: Linear regression with GPA, GMAT and Age
Paraphrase This Document
Need a fresh take? Get an instant paraphrase of this document with our AI Paraphraser
10DECISION ANALYSIS AND SIMPLE REGRESSION
SUMMARY OUTPUT
Regression Statistics
Multiple R 0.833
R Square 0.695
Adjusted R Square 0.627
Standard Error 0.226
Observations 12
ANOVA
df SS MS F Significance F
Regression 2 1.041 0.521 10.232 0.005
Residual 9 0.458 0.051
Total 11 1.499
Coefficients Standard Error t Stat P-value Lower 95% Upper 95% Lower 95.0% Upper 95.0%
Intercept 1.378 0.480 2.870 0.018 0.292 2.464 0.292 2.464
GMAT 0.002 0.001 2.607 0.028 0.000 0.004 0.000 0.004
AGE 0.034 0.013 2.742 0.023 0.006 0.063 0.006 0.063
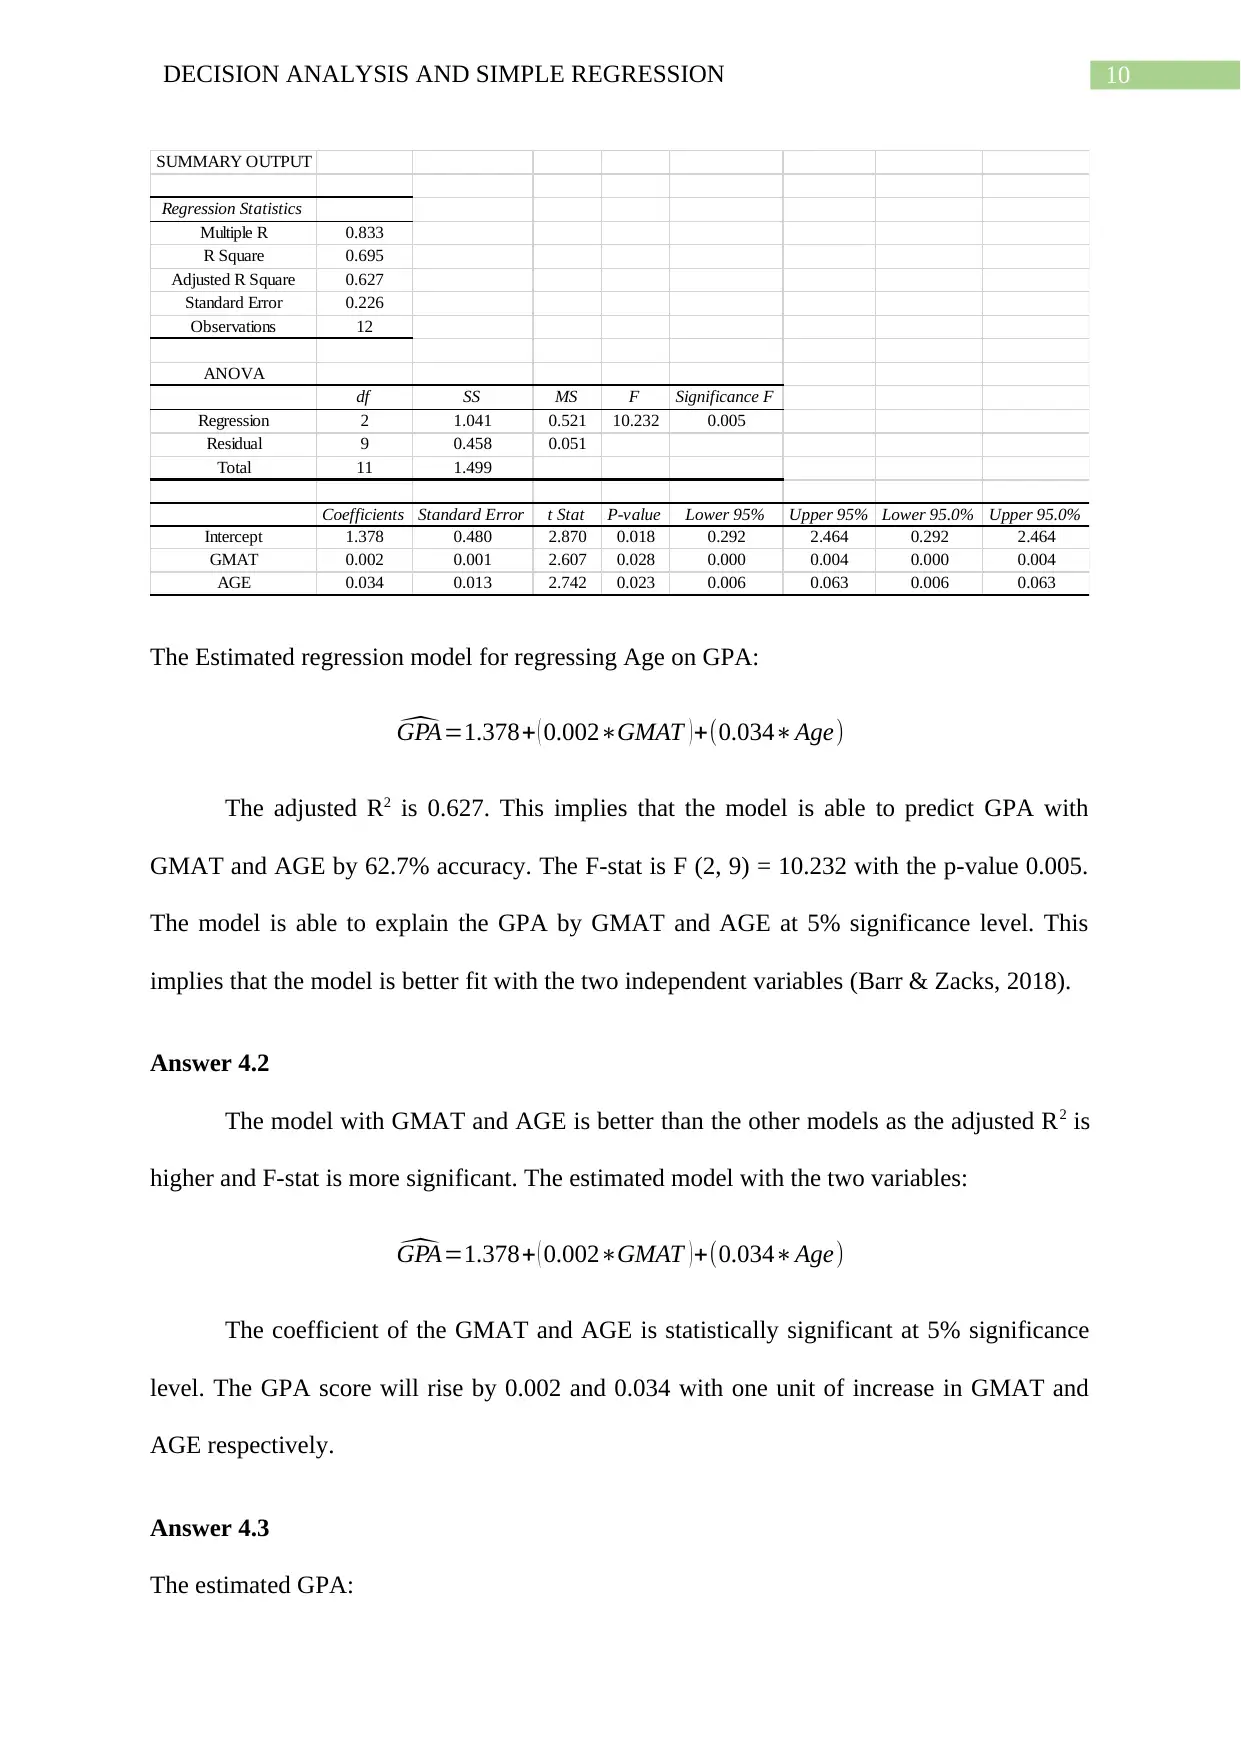
The Estimated regression model for regressing Age on GPA:
^GPA=1.378+ ( 0.002∗GMAT )+(0.034∗Age)
The adjusted R2 is 0.627. This implies that the model is able to predict GPA with
GMAT and AGE by 62.7% accuracy. The F-stat is F (2, 9) = 10.232 with the p-value 0.005.
The model is able to explain the GPA by GMAT and AGE at 5% significance level. This
implies that the model is better fit with the two independent variables (Barr & Zacks, 2018).
Answer 4.2
The model with GMAT and AGE is better than the other models as the adjusted R2 is
higher and F-stat is more significant. The estimated model with the two variables:
^GPA=1.378+ ( 0.002∗GMAT )+(0.034∗Age)
The coefficient of the GMAT and AGE is statistically significant at 5% significance
level. The GPA score will rise by 0.002 and 0.034 with one unit of increase in GMAT and
AGE respectively.
Answer 4.3
The estimated GPA:
SUMMARY OUTPUT
Regression Statistics
Multiple R 0.833
R Square 0.695
Adjusted R Square 0.627
Standard Error 0.226
Observations 12
ANOVA
df SS MS F Significance F
Regression 2 1.041 0.521 10.232 0.005
Residual 9 0.458 0.051
Total 11 1.499
Coefficients Standard Error t Stat P-value Lower 95% Upper 95% Lower 95.0% Upper 95.0%
Intercept 1.378 0.480 2.870 0.018 0.292 2.464 0.292 2.464
GMAT 0.002 0.001 2.607 0.028 0.000 0.004 0.000 0.004
AGE 0.034 0.013 2.742 0.023 0.006 0.063 0.006 0.063
The Estimated regression model for regressing Age on GPA:
^GPA=1.378+ ( 0.002∗GMAT )+(0.034∗Age)
The adjusted R2 is 0.627. This implies that the model is able to predict GPA with
GMAT and AGE by 62.7% accuracy. The F-stat is F (2, 9) = 10.232 with the p-value 0.005.
The model is able to explain the GPA by GMAT and AGE at 5% significance level. This
implies that the model is better fit with the two independent variables (Barr & Zacks, 2018).
Answer 4.2
The model with GMAT and AGE is better than the other models as the adjusted R2 is
higher and F-stat is more significant. The estimated model with the two variables:
^GPA=1.378+ ( 0.002∗GMAT )+(0.034∗Age)
The coefficient of the GMAT and AGE is statistically significant at 5% significance
level. The GPA score will rise by 0.002 and 0.034 with one unit of increase in GMAT and
AGE respectively.
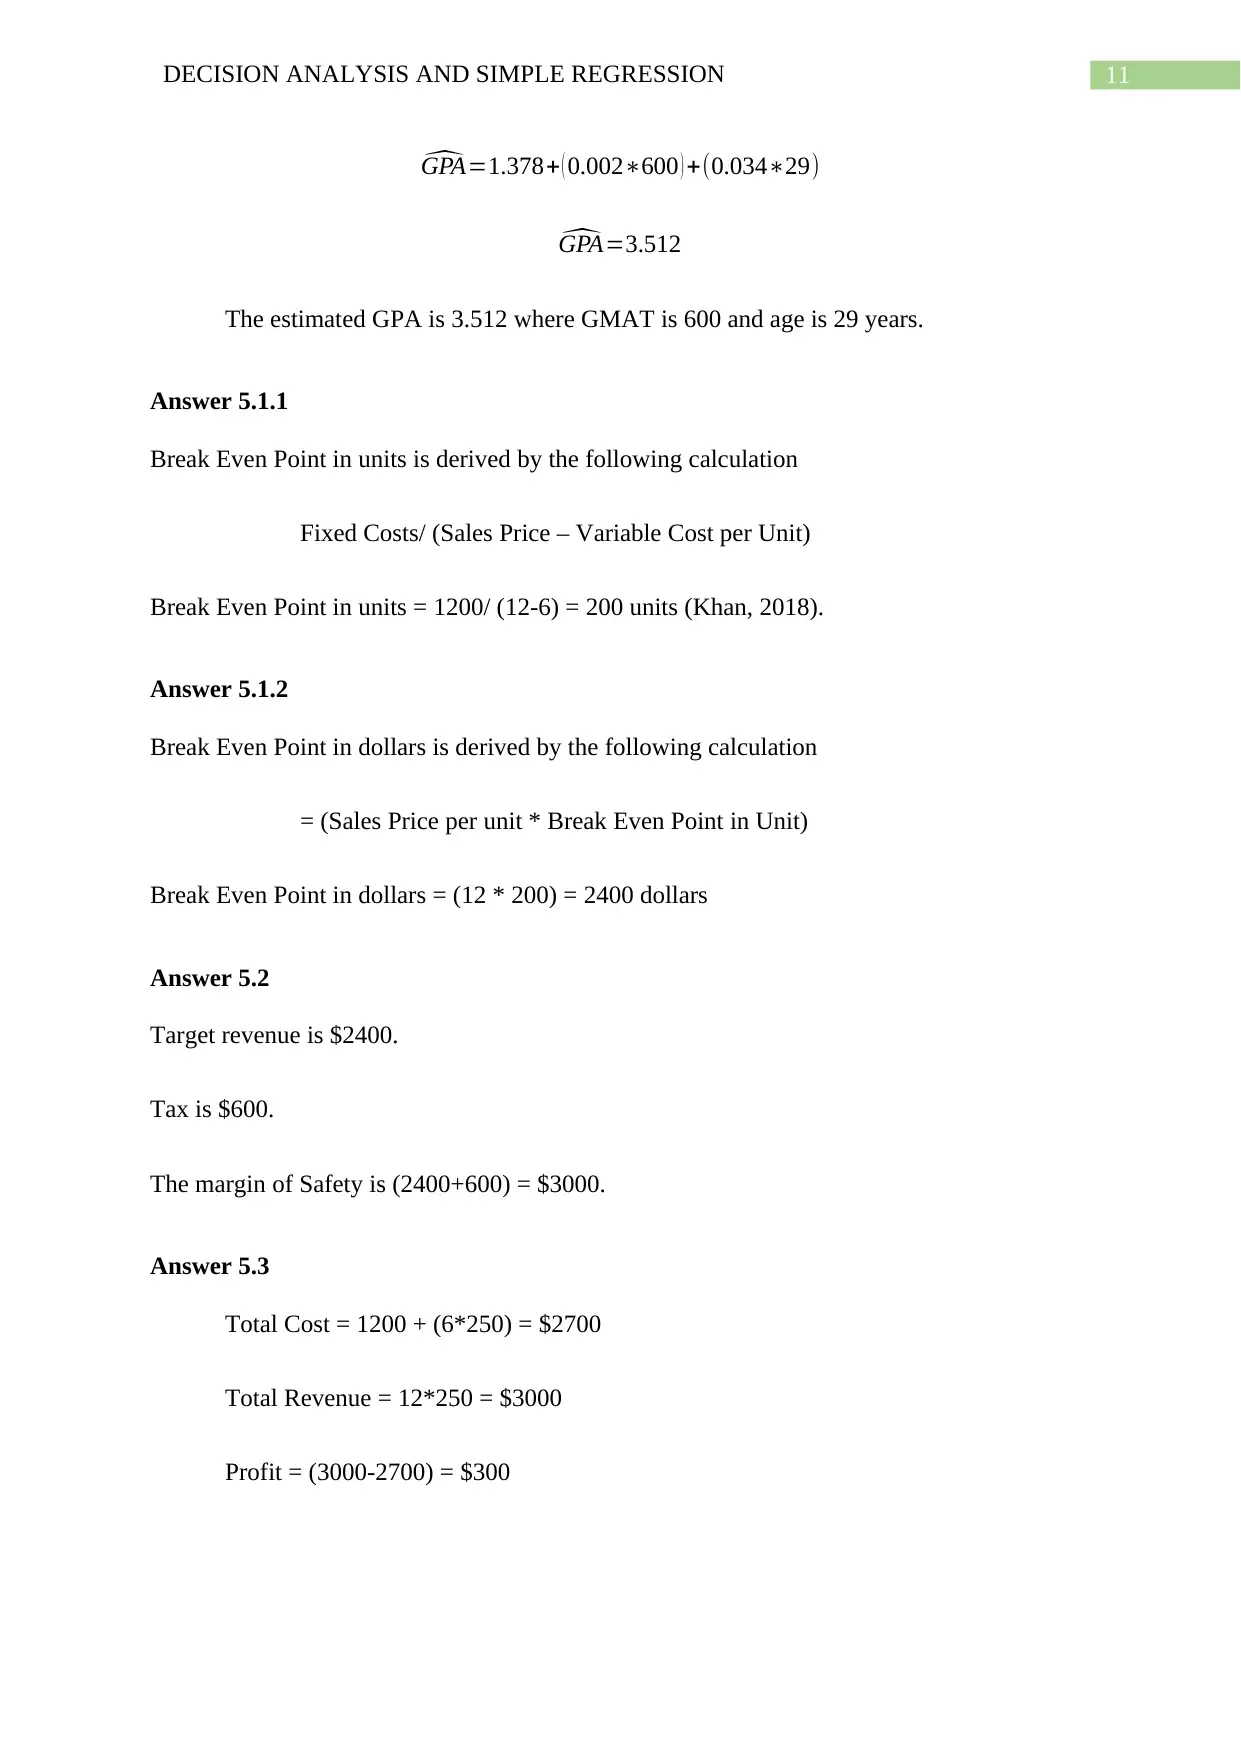
Answer 4.3
The estimated GPA:
11DECISION ANALYSIS AND SIMPLE REGRESSION
^GPA=1.378+ ( 0.002∗600 ) +(0.034∗29)
^GPA=3.512
The estimated GPA is 3.512 where GMAT is 600 and age is 29 years.
Answer 5.1.1
Break Even Point in units is derived by the following calculation
Fixed Costs/ (Sales Price – Variable Cost per Unit)
Break Even Point in units = 1200/ (12-6) = 200 units (Khan, 2018).
Answer 5.1.2
Break Even Point in dollars is derived by the following calculation
= (Sales Price per unit * Break Even Point in Unit)
Break Even Point in dollars = (12 * 200) = 2400 dollars
Answer 5.2
Target revenue is $2400.
Tax is $600.
The margin of Safety is (2400+600) = $3000.
Answer 5.3
Total Cost = 1200 + (6*250) = $2700
Total Revenue = 12*250 = $3000
Profit = (3000-2700) = $300
⊘ This is a preview!⊘
Do you want full access?
Subscribe today to unlock all pages.
Trusted by 1+ million students worldwide
1 out of 14
Related Documents


Your All-in-One AI-Powered Toolkit for Academic Success.
+13062052269
info@desklib.com
Available 24*7 on WhatsApp / Email
![[object Object]](/_next/static/media/star-bottom.7253800d.svg)
Unlock your academic potential
Copyright © 2020–2026 A2Z Services. All Rights Reserved. Developed and managed by ZUCOL.