Business Decision Making: Chart Analysis, Findings, and Suggestions

Verified

Added on  2023/03/30

|20
|563
|162
Report
AI Summary
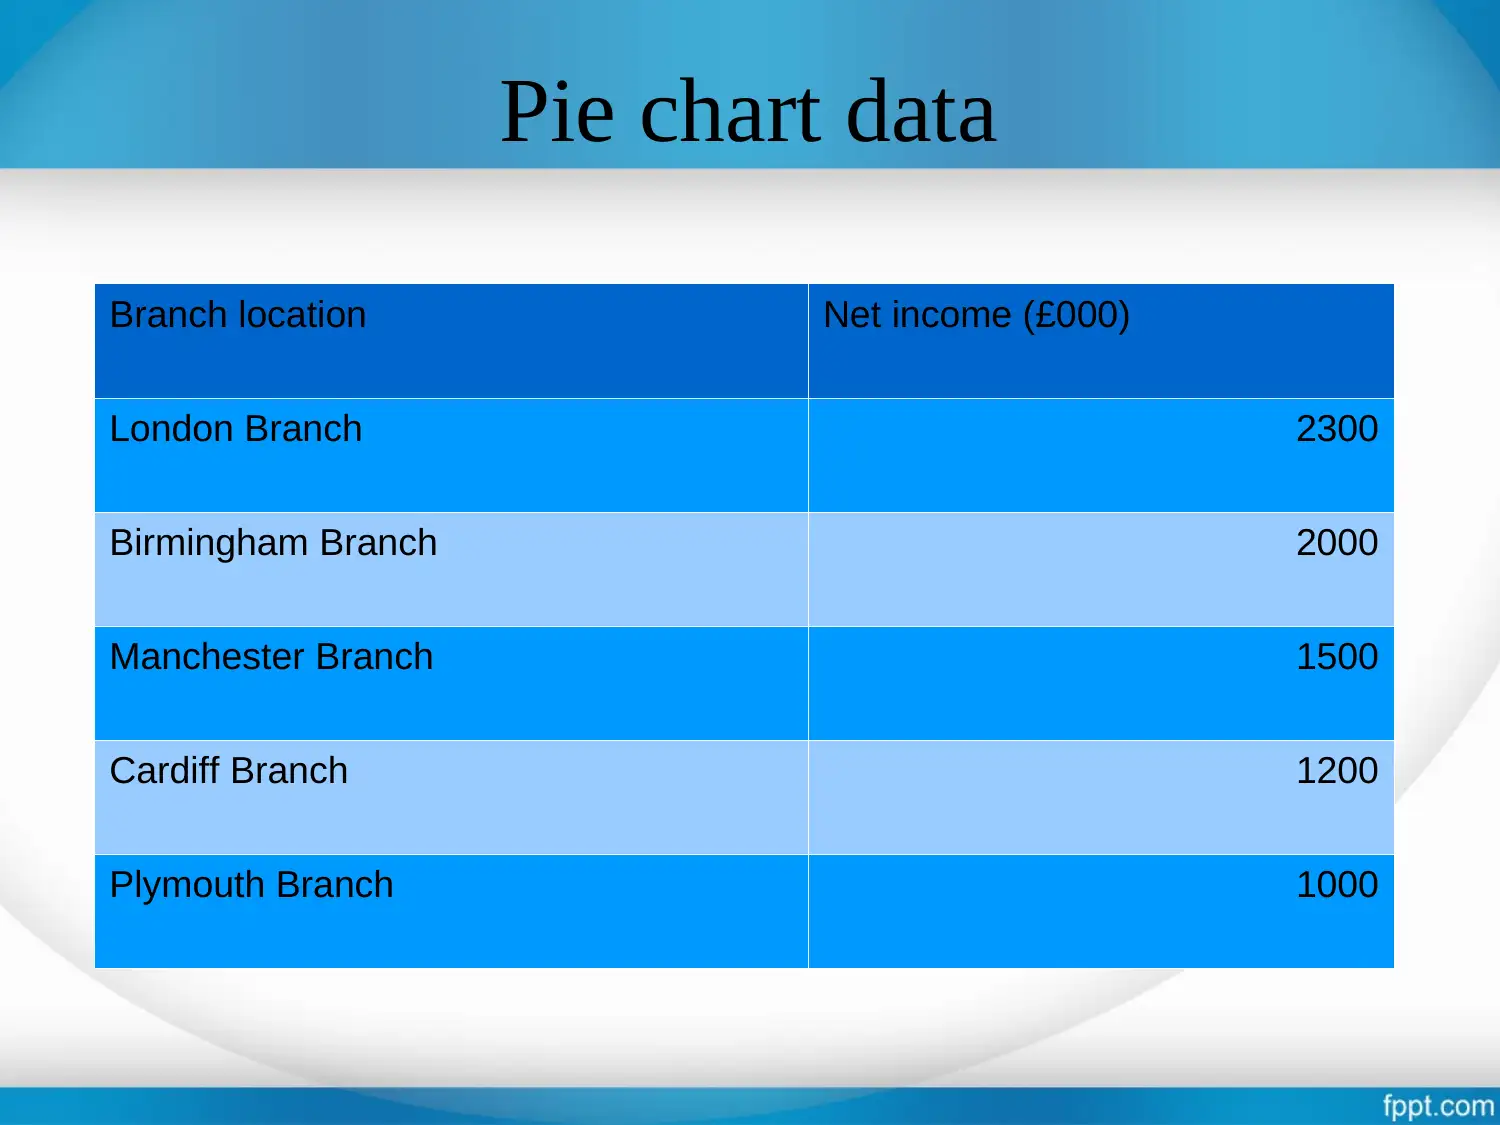
This report explores business decision-making through data visualization and analysis. It uses various charts and graphs, including line charts, scatter graphs, pie charts, bar charts, histograms, and column charts, to analyze advertising expenses, sales income, and branch performance. The findings indicate continuous sales growth in 2019, with the London branch generating the most profit. The report suggests reducing costs on other expenses, increasing promotional activities, and making effective decisions to maintain a balanced growth rate. References to relevant academic articles on decision-making are also included. Desklib provides a platform for students to access similar solved assignments and study resources.
Document Page
Business Decision
Making
Task 3
tabler-icon-diamond-filled.svg

Paraphrase This Document

Need a fresh take? Get an instant paraphrase of this document with our AI Paraphraser
Document Page
Covered content
Introduction
Objectives
Data collection
Line chart, scatter graph
Pie chart, Bar chart, histogram graph and column
Findings
Suggestions
References
Document Page
INTRODUCTION
Business decision making is the concept the are required
by every business to evaluate and control its functional
and operational areas of particular department .
Document Page
OBJECTIVES
The main objective of this research work is to know about
performance of organization though preparing various charts
and graphs.
tabler-icon-diamond-filled.svg

Paraphrase This Document

Need a fresh take? Get an instant paraphrase of this document with our AI Paraphraser
Document Page
Data collection
Year Advertising Expenses (000) Sales Income ( 000)
2001 110 1200
2002 120 1400
2003 150 1500
2004 170 1800
2005 200 2200
2006 240 2300
2007 260 2400
2008 320 2550
2009 380 3200
2010 440 3750
2011 460 4460
2012 490 4820
2013 510 5000
2014 550 5670
2015 585 5900
2016 600 6300
Document Page
Line chart
1 2 3 4 5 6 7 8 9 10 11 12 13 14 15 16
0
1000
2000
3000
4000
5000
6000
7000
line chart
Year
Advertising Expenses (000)
Sales Income ( 000)
Document Page
Scatter graph
2000 2002 2004 2006 2008 2010 2012 2014 2016 2018
0
1000
2000
3000
4000
5000
6000
7000
Advertising Expenses (000)
Sales Income ( 000)
tabler-icon-diamond-filled.svg

Paraphrase This Document

Need a fresh take? Get an instant paraphrase of this document with our AI Paraphraser
Document Page
Pie chart data
Branch location Net income (£000)
London Branch 2300
Birmingham Branch 2000
Manchester Branch 1500
Cardiff Branch 1200
Plymouth Branch 1000
Document Page
Pie Chart
2300
2000
1500
1200
1000
London Branch
Birmingham Branch
Manchester Branch
Cardiff Branch
Plymouth Branch
Document Page
Bar chart data
Year Sales
2017 10710
2018 18421
2019 32237
tabler-icon-diamond-filled.svg

Paraphrase This Document

Need a fresh take? Get an instant paraphrase of this document with our AI Paraphraser
Document Page
Continue..
1 2 3
0
5000
10000
15000
20000
25000
30000
35000
2017 2018 2019
10710
18421.2
32237.1
Year
Sales
Document Page
Linear equation at scatter graph
2000 2002 2004 2006 2008 2010 2012 2014 2016 2018
0
1000
2000
3000
4000
5000
6000
7000
Advertising Expenses (000)
Mean (Advertising Expenses
(000))
Sales Income ( 000)
Mean (Sales Income ( 000))
chevron_up_icon
1 out of 20
circle_padding
hide_on_mobile
zoom_out_icon
[object Object]