MSO4730: Analysis of UK Cinemas for Business Expansion Strategies
VerifiedAdded on 2022/11/24
|13
|2355
|272
Report
AI Summary
This report analyzes the performance of 128 UK cinemas to provide business expansion recommendations. The study investigates relationships between monthly sales and cinema location, manager gender, and monthly rent. It also examines the association between gender and cinema size, and whether total monthly sales meet a specific target. Employing descriptive and inferential statistics, the analysis reveals significant associations between gender and cinema size, and between gender of the manager and monthly sales, with male-managed cinemas exhibiting higher sales. Furthermore, a positive correlation is established between advertising expenditure and total monthly sales, and the study rejects the claim that total monthly sales reach £285,000. The report concludes with recommendations for advertising expenditure, emphasizing the importance of these factors for cinema business success.
Module Code: MSO4730
Module Name: Decision Making for International Managers
Name of the Module Leader: David Ebrahimoff
Students Names:
Students Numbers:
Students e-mail addresses:
Student’s degree course:
Module Name: Decision Making for International Managers
Name of the Module Leader: David Ebrahimoff
Students Names:
Students Numbers:
Students e-mail addresses:
Student’s degree course:
Paraphrase This Document
Need a fresh take? Get an instant paraphrase of this document with our AI Paraphraser
Introduction
The main aim of any business enterprise is to make profit and be able to expand their portfolios
in other new markets. The theme of this study is to analyze a data from 128 cinemas in the UK
and advise the managers on how they can expand the business. Based on this, analysis was
performed on 128 cinemas to understand the performance of these cinemas. The study sought to
answer the following objectives;
1. Investigate the relationship that exists between the monthly sales and the cinema location.
2. Investigate the relationship that exists between the monthly sales and the gender of the
manager who is managing the cinema
3. Investigate the relationship that exists between monthly rent and the monthly sales made
by the cinema.
4. Investigate the association between gender and the cinema size.
5. Investigate whether the total monthly cinema sales is £285,000.
Methodology
Context of the study
This is study was done in UK (England, Scotland and Wales). Data was collected from a random
sample of 128 cinemas in the mentioned three countries.
About the data
The dataset comprised of 11 variables with 128 cases.
Variable Variable name Variable type
Number Number of cinema Quantitative variable
Chain Cinema chain Qualitative variable
Region Regional location of the cinema Qualitative variable
Location Location of the cinema Qualitative variable
Size Size of the cinema Qualitative variable
Gender Gender of the manager Qualitative variable
Rent Monthly rent Quantitative variable
Distance Distance of the cinema away from the High
street
Quantitative variable
Advert Monthly advertising expenditure Quantitative variable
Weekend Monthly weekend sales Quantitative variable
Weekday Monthly weekday sales Quantitative variable
Total Monthly
Sales
Total monthly sales Quantitative variable
Missing data
There were no missing data values in the dataset.
Software used
Minitab software version 19 was used for the purposes of analysis
Statistical methods used
Both descriptive and inferential statistics were employed to analyze the data. Descriptive
statistics used included the mean, median, mode, standard deviation, frequency distribution
tables. For the inferential statistics, Chi-square test of association, t-test and regression analysis
were used to analyze the data.
Statistical Analysis
Descriptive statistics
Table 1 below gives the summary (descriptive) statistics of the data. As can be seen, a total of
128 cinemas were analyzed and the average monthly rent was found to be £2,032 with the
median monthly rent paid out being £2,000. The maximum and the minimum monthly rent paid
by the sampled cinemas was £3,200 and £900 respectively. The average distance of the cinema
away from the High street was found to be 2.446 miles with the farthest distance being 6.25
miles.
Table 1: Statistics
Variable N Mean SE
Mean
StDev Minim
um
Q1 Median Q3 Maximum
Rent 128 20.320 0.544 6.154 9.000 15.250 20.000 25.000 32.000
Distance 128 2.446 0.148 1.631 0.250 1.000 2.000 4.000 6.250
Advert 128 2285.5 59.5 672.9 1100.0 1832.5 2070.0 2970.0 3600.0
Weekend 128 157020 7400 83717 10540 89661 143539 216714 398456
Weekday 128 90372 5081 57488 3457 44208 85595 132630 287345
Total Monthly
Sales
128 247392 12416 140469 14098 133002 228319 354166 624896
The average monthly advertising expenses was found to be £2,285.5 with the highest recorded
expense being £3,600 and the lowest advertising expenses being £1,100. The average monthly
weekend sales were found to be £157,020 while the average monthly sales for the weekday was
found to be £90,372. Highest monthly sales for the weekend was found to be £398,456 while for
the weekend it was £287,345. Combining the weekend sales and the weekday sales, the average
total sales was found to be £247,392.
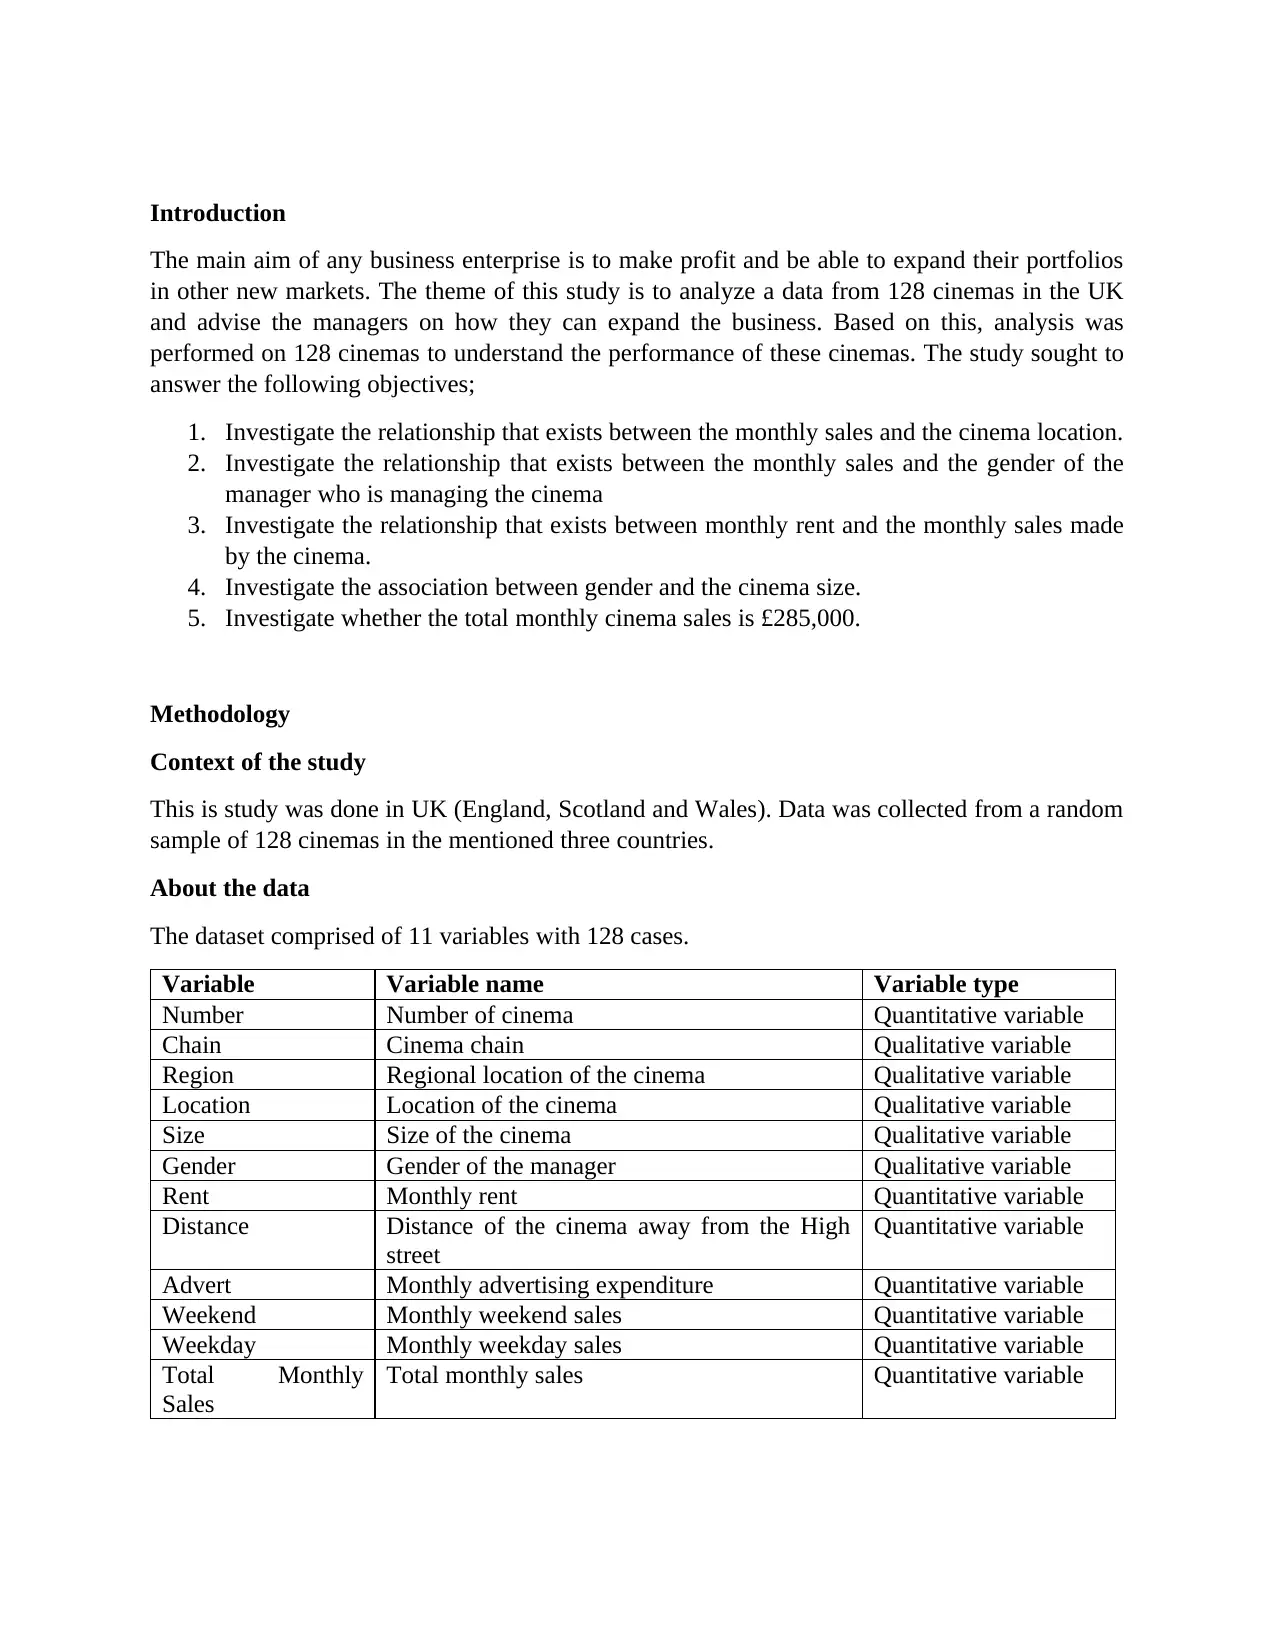
Frequency distributions
In terms of the chain distribution, most of the chains (n = 44) in the study were chain B. Chains
A and C were both represented by 42 chains in total.
There were no missing data values in the dataset.
Software used
Minitab software version 19 was used for the purposes of analysis
Statistical methods used
Both descriptive and inferential statistics were employed to analyze the data. Descriptive
statistics used included the mean, median, mode, standard deviation, frequency distribution
tables. For the inferential statistics, Chi-square test of association, t-test and regression analysis
were used to analyze the data.
Statistical Analysis
Descriptive statistics
Table 1 below gives the summary (descriptive) statistics of the data. As can be seen, a total of
128 cinemas were analyzed and the average monthly rent was found to be £2,032 with the
median monthly rent paid out being £2,000. The maximum and the minimum monthly rent paid
by the sampled cinemas was £3,200 and £900 respectively. The average distance of the cinema
away from the High street was found to be 2.446 miles with the farthest distance being 6.25
miles.
Table 1: Statistics
Variable N Mean SE
Mean
StDev Minim
um
Q1 Median Q3 Maximum
Rent 128 20.320 0.544 6.154 9.000 15.250 20.000 25.000 32.000
Distance 128 2.446 0.148 1.631 0.250 1.000 2.000 4.000 6.250
Advert 128 2285.5 59.5 672.9 1100.0 1832.5 2070.0 2970.0 3600.0
Weekend 128 157020 7400 83717 10540 89661 143539 216714 398456
Weekday 128 90372 5081 57488 3457 44208 85595 132630 287345
Total Monthly
Sales
128 247392 12416 140469 14098 133002 228319 354166 624896
The average monthly advertising expenses was found to be £2,285.5 with the highest recorded
expense being £3,600 and the lowest advertising expenses being £1,100. The average monthly
weekend sales were found to be £157,020 while the average monthly sales for the weekday was
found to be £90,372. Highest monthly sales for the weekend was found to be £398,456 while for
the weekend it was £287,345. Combining the weekend sales and the weekday sales, the average
total sales was found to be £247,392.
Frequency distributions
In terms of the chain distribution, most of the chains (n = 44) in the study were chain B. Chains
A and C were both represented by 42 chains in total.
⊘ This is a preview!⊘
Do you want full access?
Subscribe today to unlock all pages.
Trusted by 1+ million students worldwide
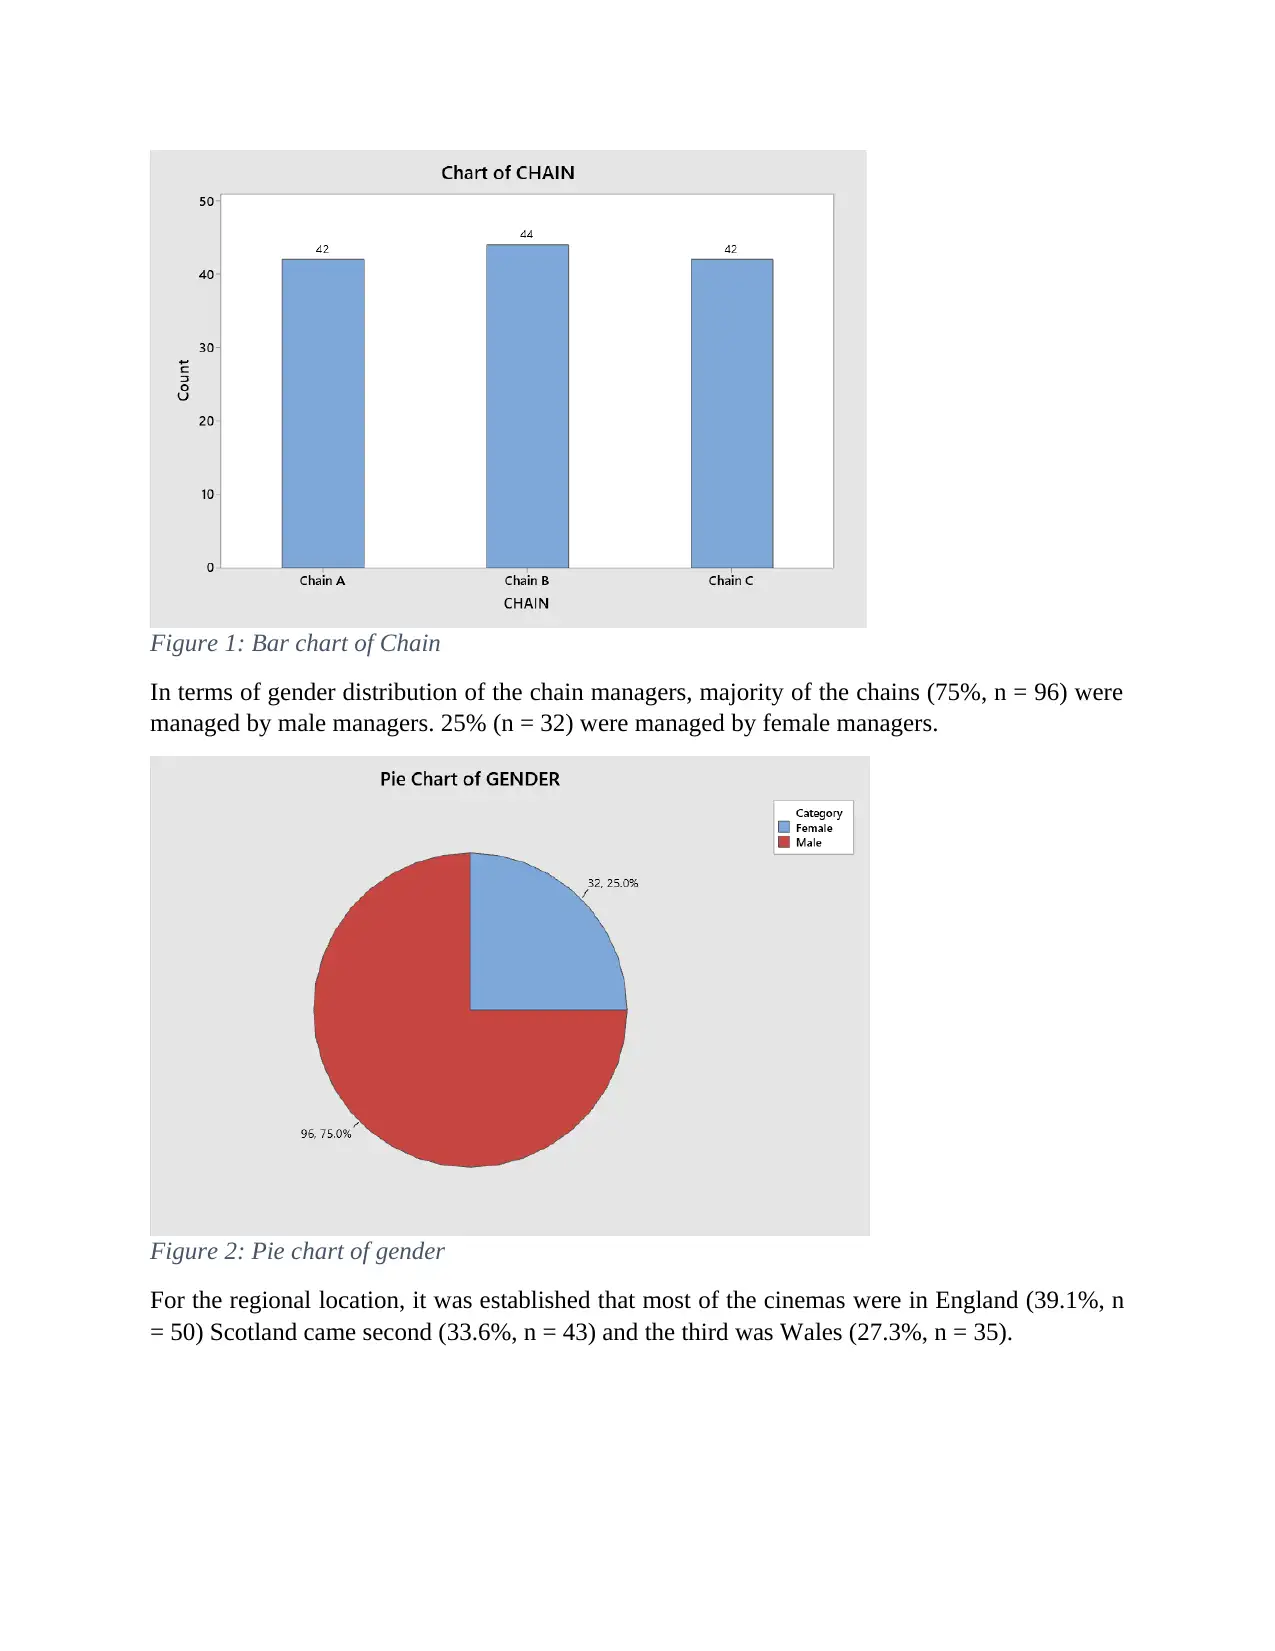
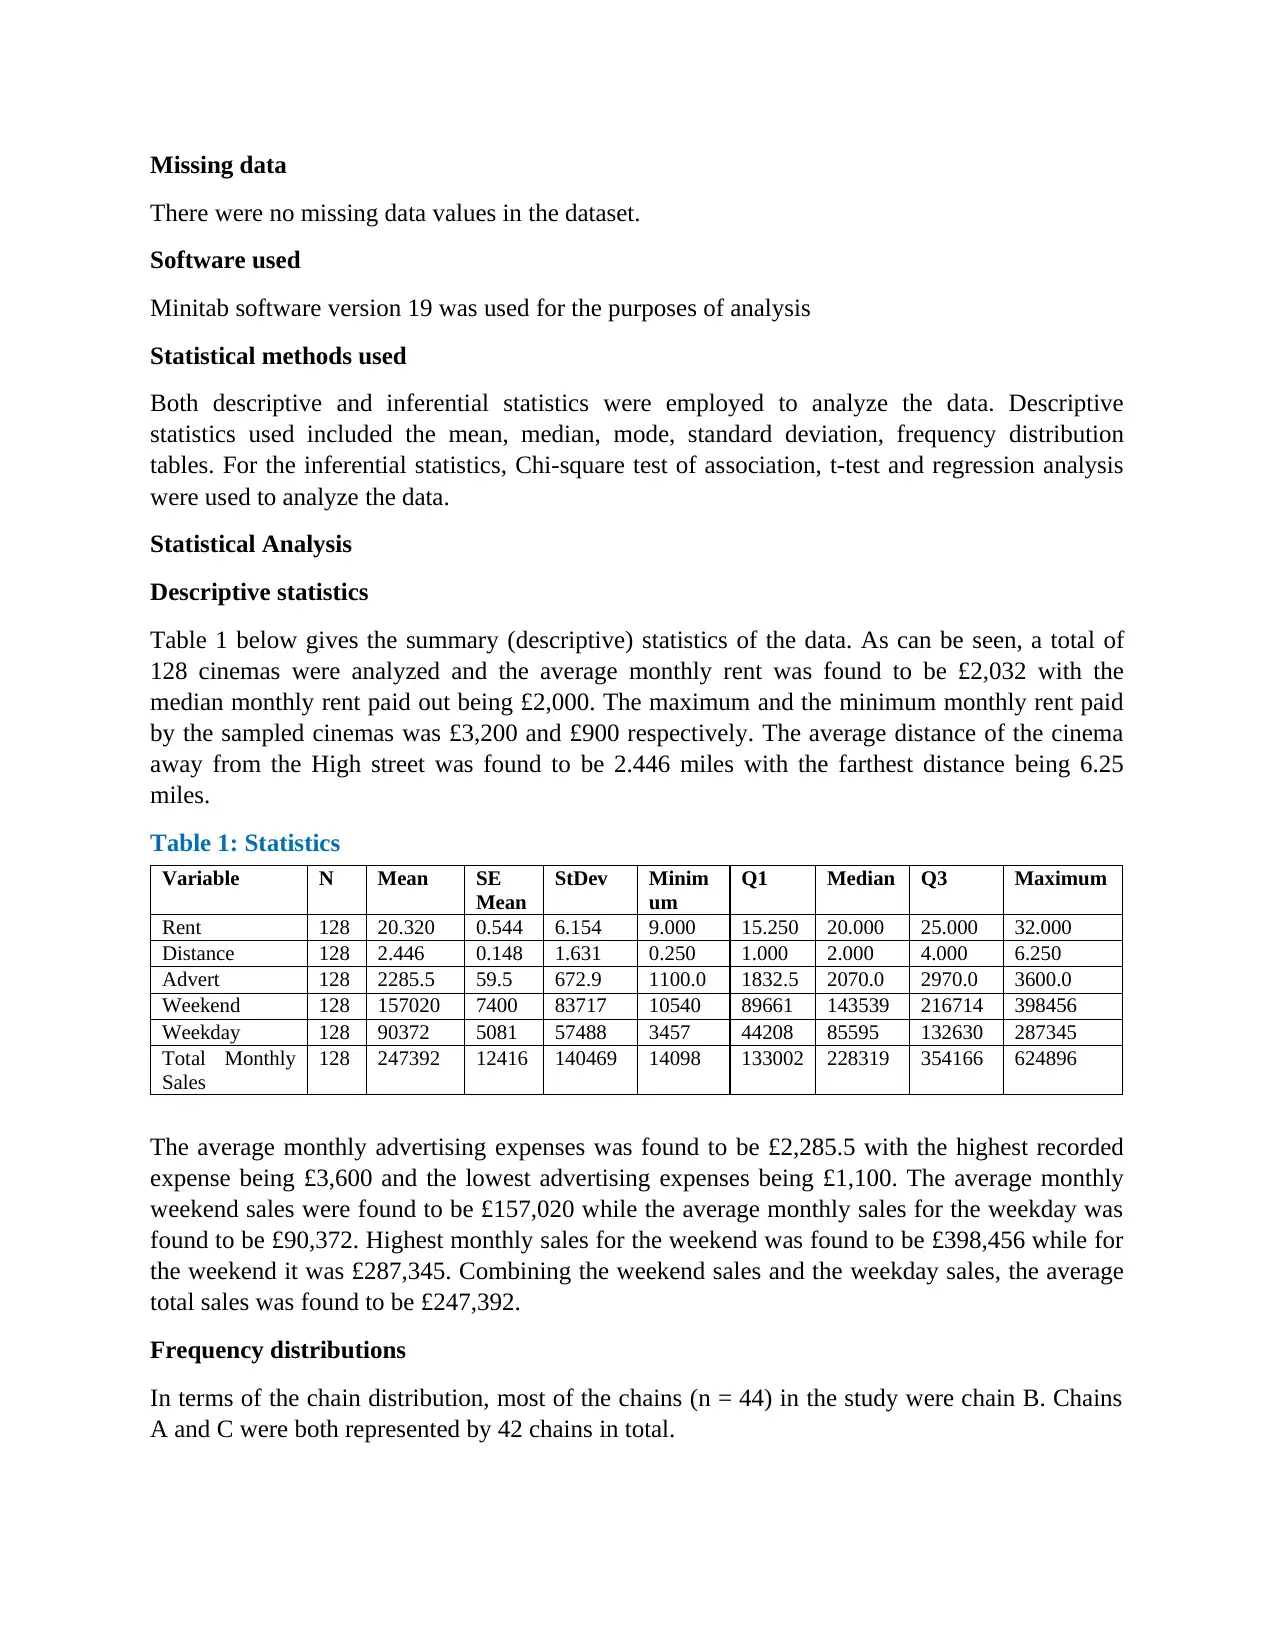
Figure 1: Bar chart of Chain
In terms of gender distribution of the chain managers, majority of the chains (75%, n = 96) were
managed by male managers. 25% (n = 32) were managed by female managers.
Figure 2: Pie chart of gender
For the regional location, it was established that most of the cinemas were in England (39.1%, n
= 50) Scotland came second (33.6%, n = 43) and the third was Wales (27.3%, n = 35).
Paraphrase This Document
Need a fresh take? Get an instant paraphrase of this document with our AI Paraphraser
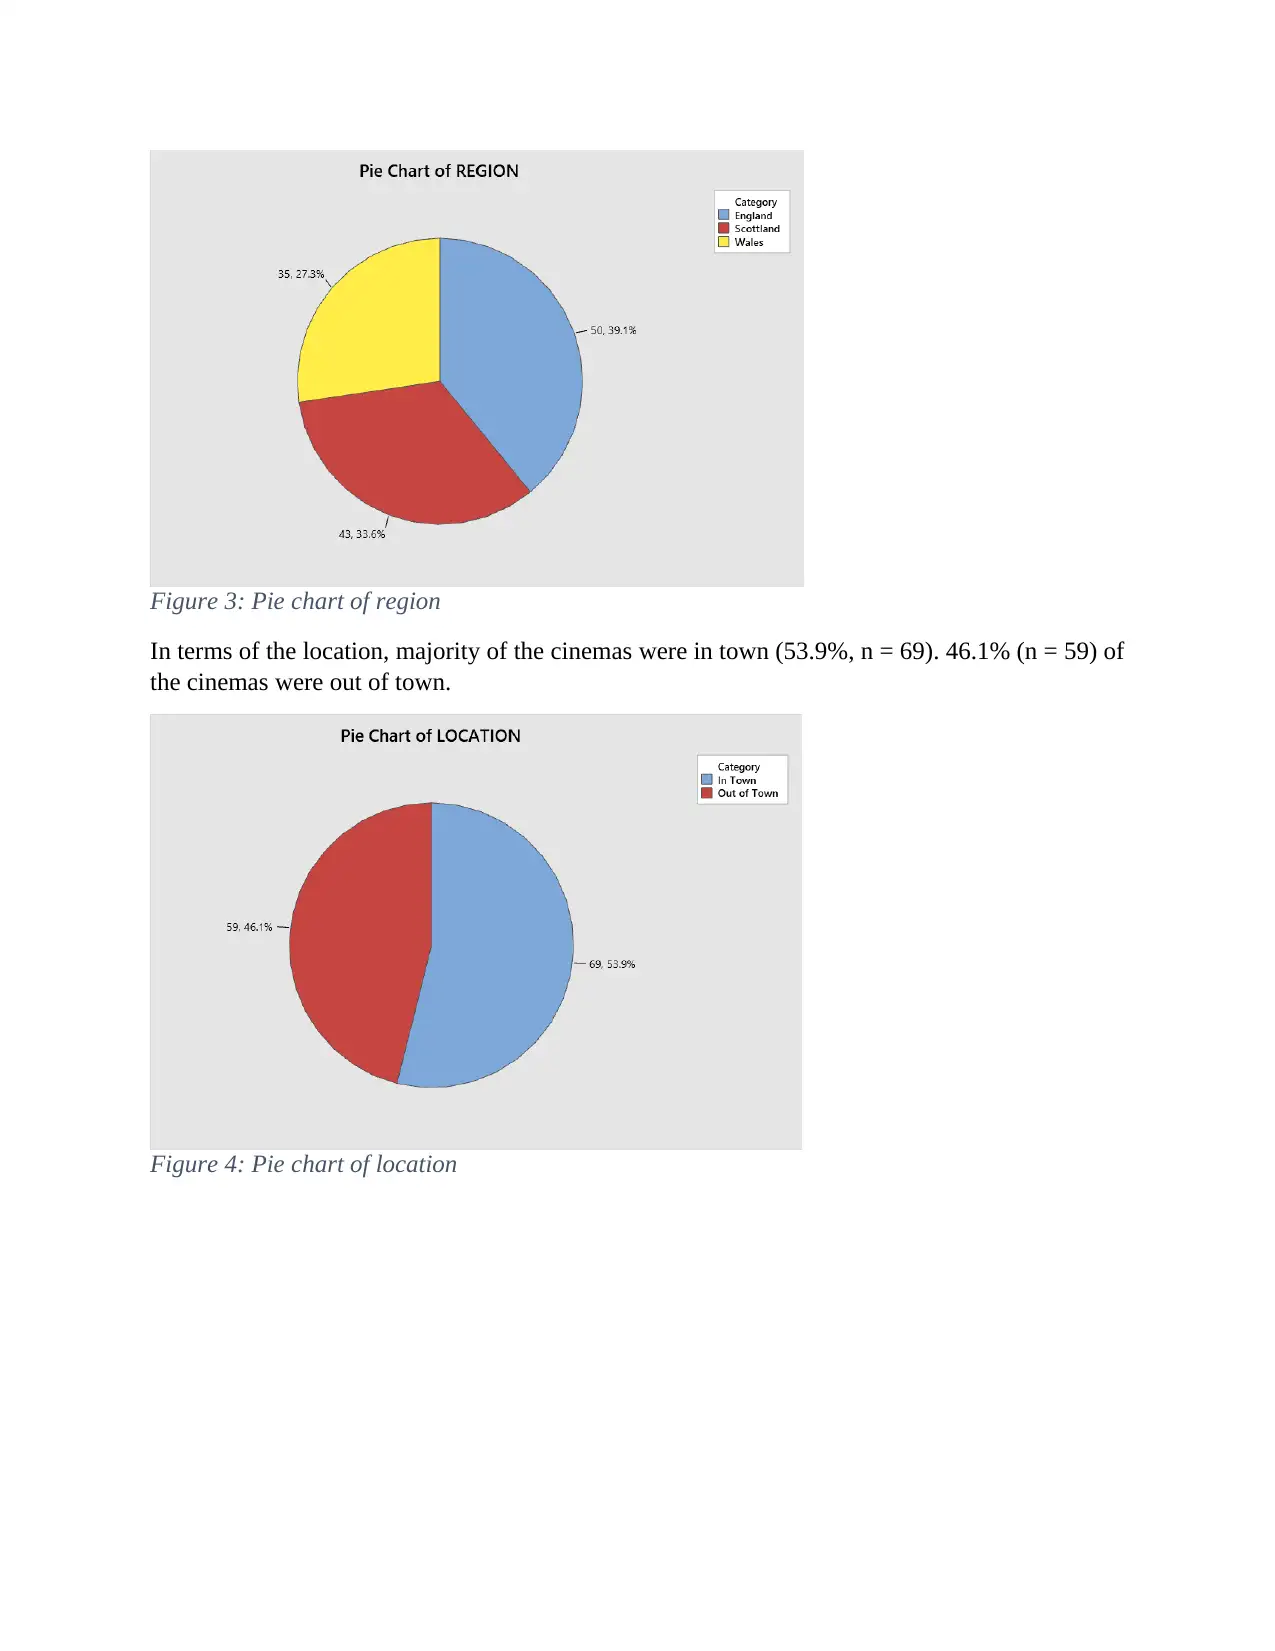
Figure 3: Pie chart of region
In terms of the location, majority of the cinemas were in town (53.9%, n = 69). 46.1% (n = 59) of
the cinemas were out of town.
Figure 4: Pie chart of location
In terms of the location, majority of the cinemas were in town (53.9%, n = 69). 46.1% (n = 59) of
the cinemas were out of town.
Figure 4: Pie chart of location
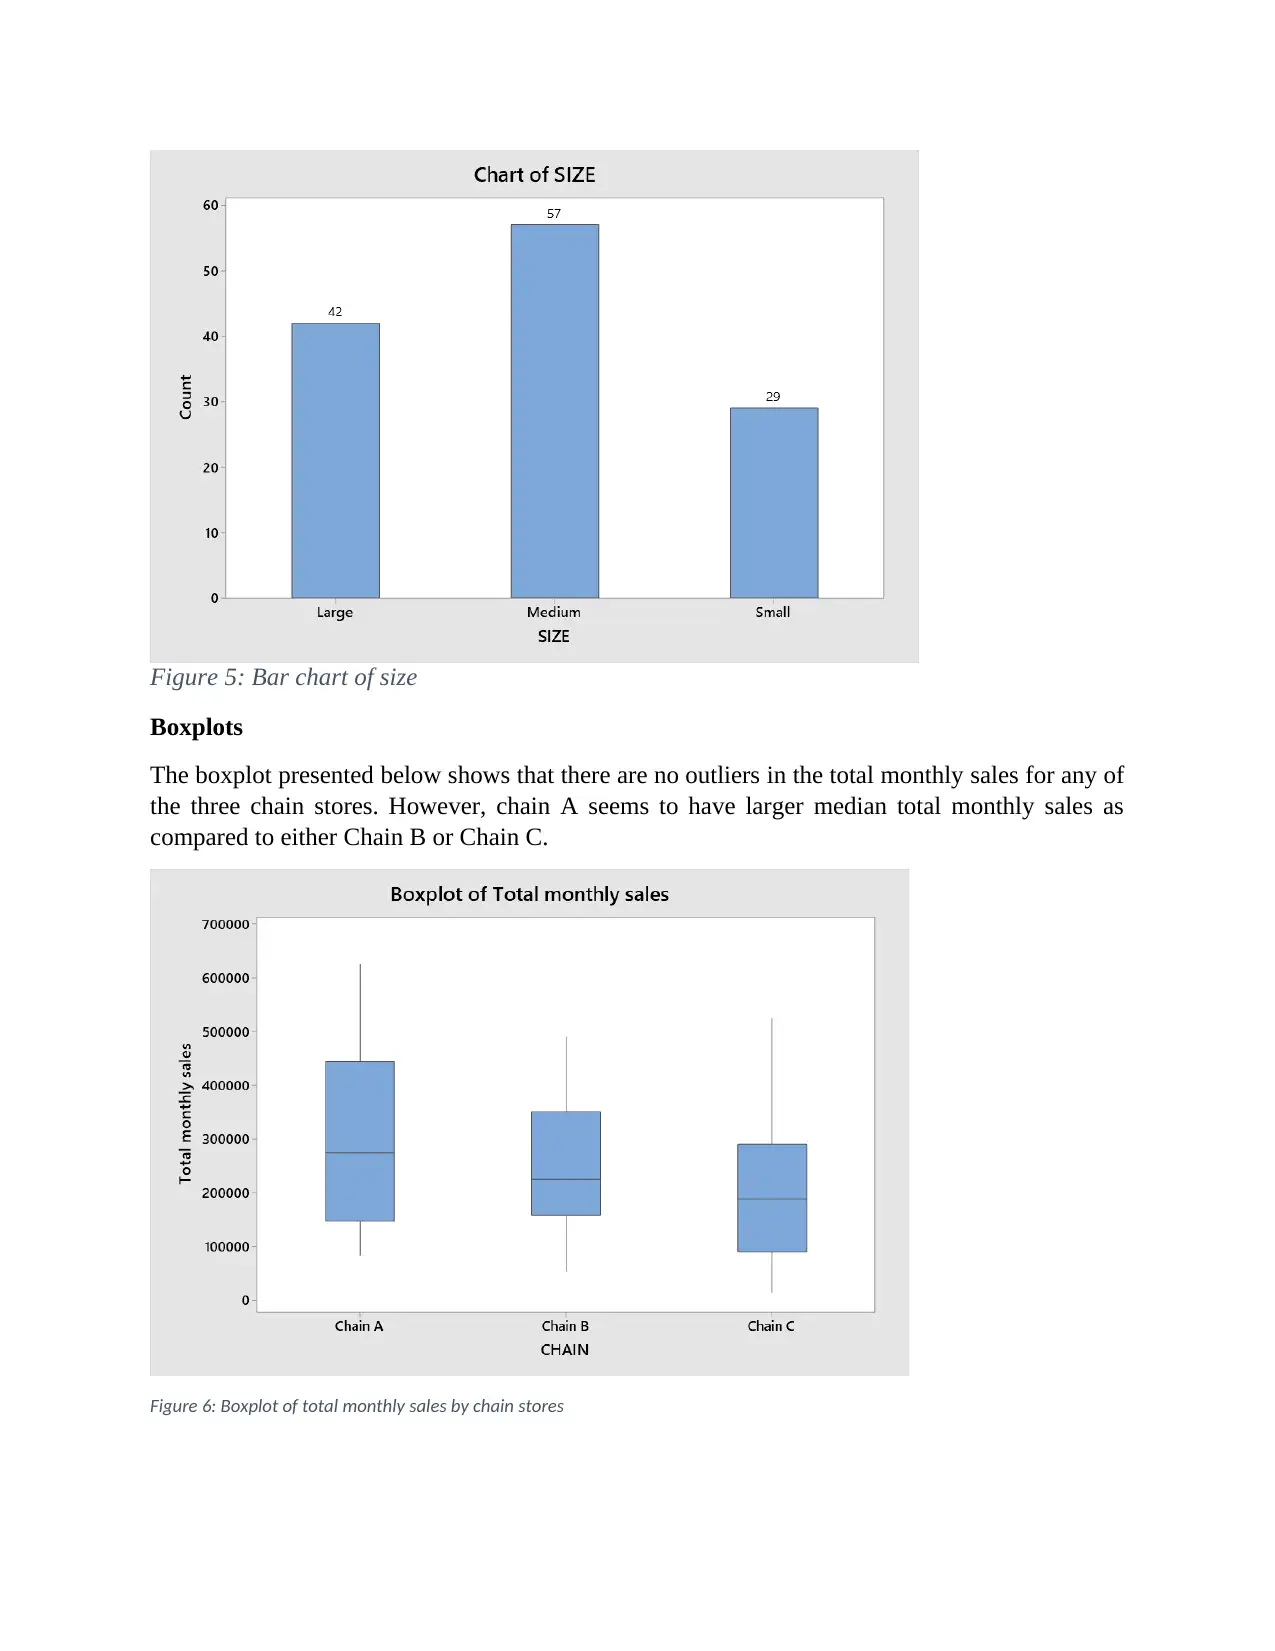
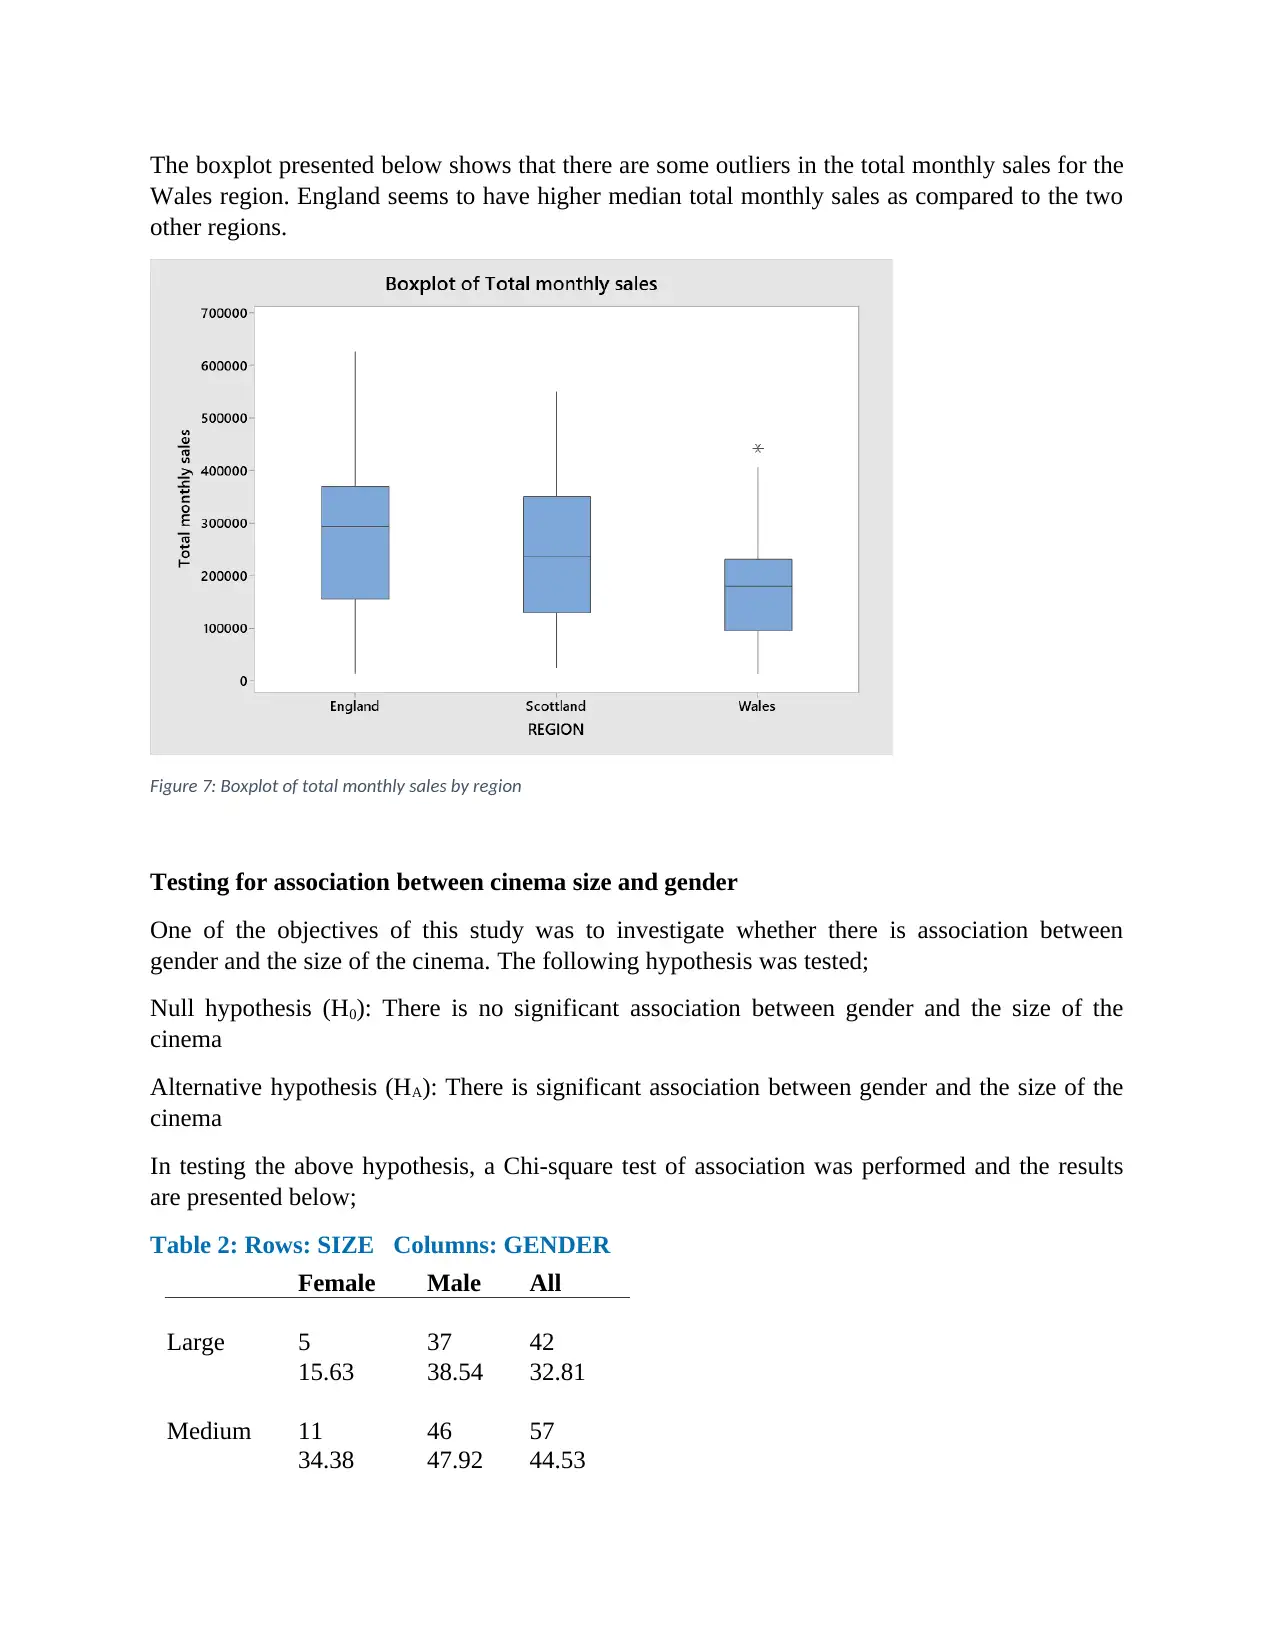
Figure 5: Bar chart of size
Boxplots
The boxplot presented below shows that there are no outliers in the total monthly sales for any of
the three chain stores. However, chain A seems to have larger median total monthly sales as
compared to either Chain B or Chain C.
Figure 6: Boxplot of total monthly sales by chain stores
Boxplots
The boxplot presented below shows that there are no outliers in the total monthly sales for any of
the three chain stores. However, chain A seems to have larger median total monthly sales as
compared to either Chain B or Chain C.
Figure 6: Boxplot of total monthly sales by chain stores
⊘ This is a preview!⊘
Do you want full access?
Subscribe today to unlock all pages.
Trusted by 1+ million students worldwide
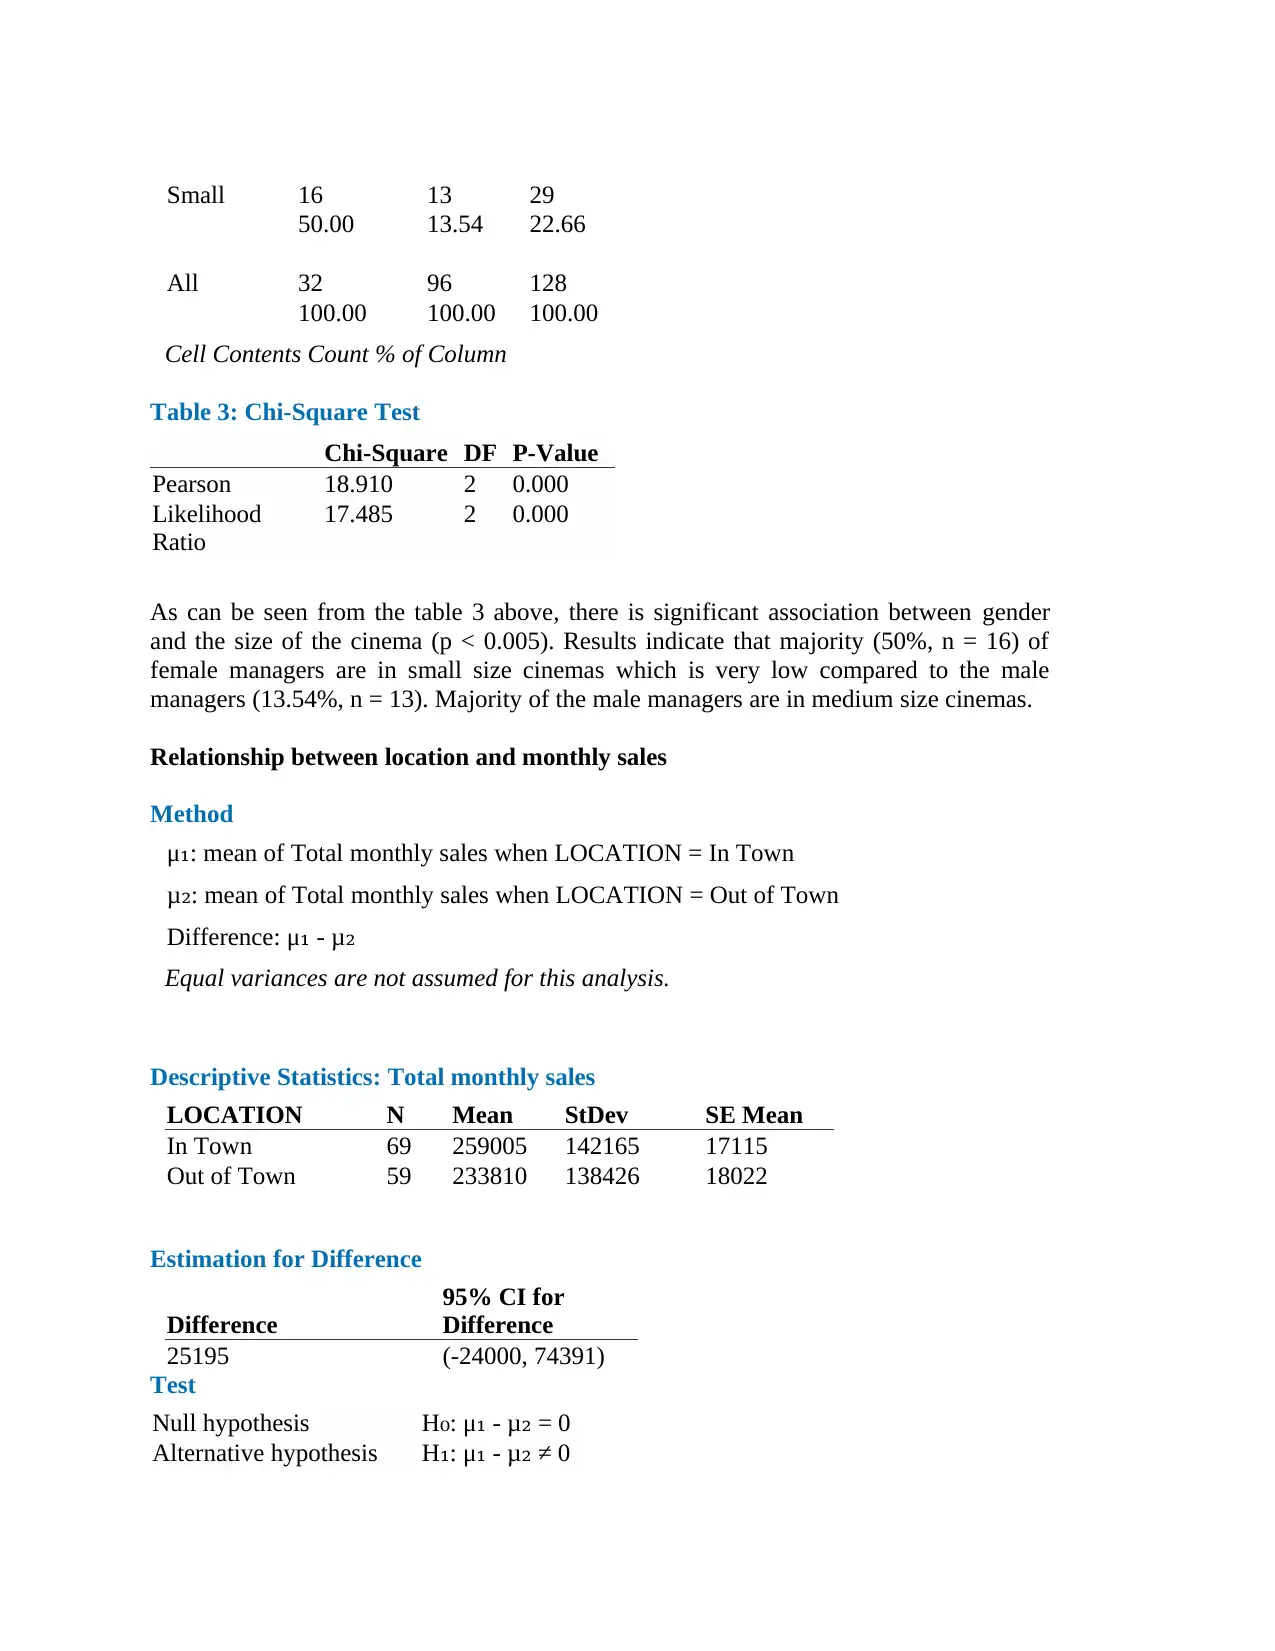
The boxplot presented below shows that there are some outliers in the total monthly sales for the
Wales region. England seems to have higher median total monthly sales as compared to the two
other regions.
Figure 7: Boxplot of total monthly sales by region
Testing for association between cinema size and gender
One of the objectives of this study was to investigate whether there is association between
gender and the size of the cinema. The following hypothesis was tested;
Null hypothesis (H0): There is no significant association between gender and the size of the
cinema
Alternative hypothesis (HA): There is significant association between gender and the size of the
cinema
In testing the above hypothesis, a Chi-square test of association was performed and the results
are presented below;
Table 2: Rows: SIZE Columns: GENDER
Female Male All
Large 5 37 42
15.63 38.54 32.81
Medium 11 46 57
34.38 47.92 44.53
Paraphrase This Document
Need a fresh take? Get an instant paraphrase of this document with our AI Paraphraser
Small 16 13 29
50.00 13.54 22.66
All 32 96 128
100.00 100.00 100.00
Cell Contents Count % of Column
Table 3: Chi-Square Test
Chi-Square DF P-Value
Pearson 18.910 2 0.000
Likelihood
Ratio
17.485 2 0.000
As can be seen from the table 3 above, there is significant association between gender
and the size of the cinema (p < 0.005). Results indicate that majority (50%, n = 16) of
female managers are in small size cinemas which is very low compared to the male
managers (13.54%, n = 13). Majority of the male managers are in medium size cinemas.
Relationship between location and monthly sales
Method
μ : mean of Total monthly sales when LOCATION = In Town₁
μ : mean of Total monthly sales when LOCATION = Out of Town₂
Difference: μ - μ₁ ₂
Equal variances are not assumed for this analysis.
Descriptive Statistics: Total monthly sales
LOCATION N Mean StDev SE Mean
In Town 69 259005 142165 17115
Out of Town 59 233810 138426 18022
Estimation for Difference
Difference
95% CI for
Difference
25195 (-24000, 74391)
Test
Null hypothesis H : μ - μ = 0₀ ₁ ₂
Alternative hypothesis H : μ - μ ≠ 0₁ ₁ ₂
T-Value DF P-Value
1.01 123 0.313
An independent-samples t-test was conducted to compare total monthly sales for cinemas
in town and cinemas out of town. There was no significant difference in the total monthly
sales for cinemas in town (M = 259005, SD =142165, N = 69) and cinemas out of town
(M = 233810, SD = 138426, N = 59) conditions; t (123) = 1.01, p = 0.313. These results
suggest that location of the cinema does not have an effect on total monthly sales.
Relationship between gender and monthly sales
Method
μ₁: mean of Total monthly sales when GENDER =
Female
μ₂: mean of Total monthly sales when GENDER =
Male
Difference: μ₁ - μ₂
Equal variances are not assumed for this analysis.
Descriptive Statistics: Total monthly sales
GENDE
R N Mean StDev SE Mean
Female 32 177280 130132 23004
Male 96 270762 136544 13936
Estimation for Difference
Differenc
e
95% CI for
Difference
-93482 (-147384, -39581)
Test
Null hypothesis H₀: μ₁ - μ₂ = 0
Alternative hypothesis H₁: μ₁ - μ₂ ≠ 0
T-Value DF P-Value
-3.48 55 0.001
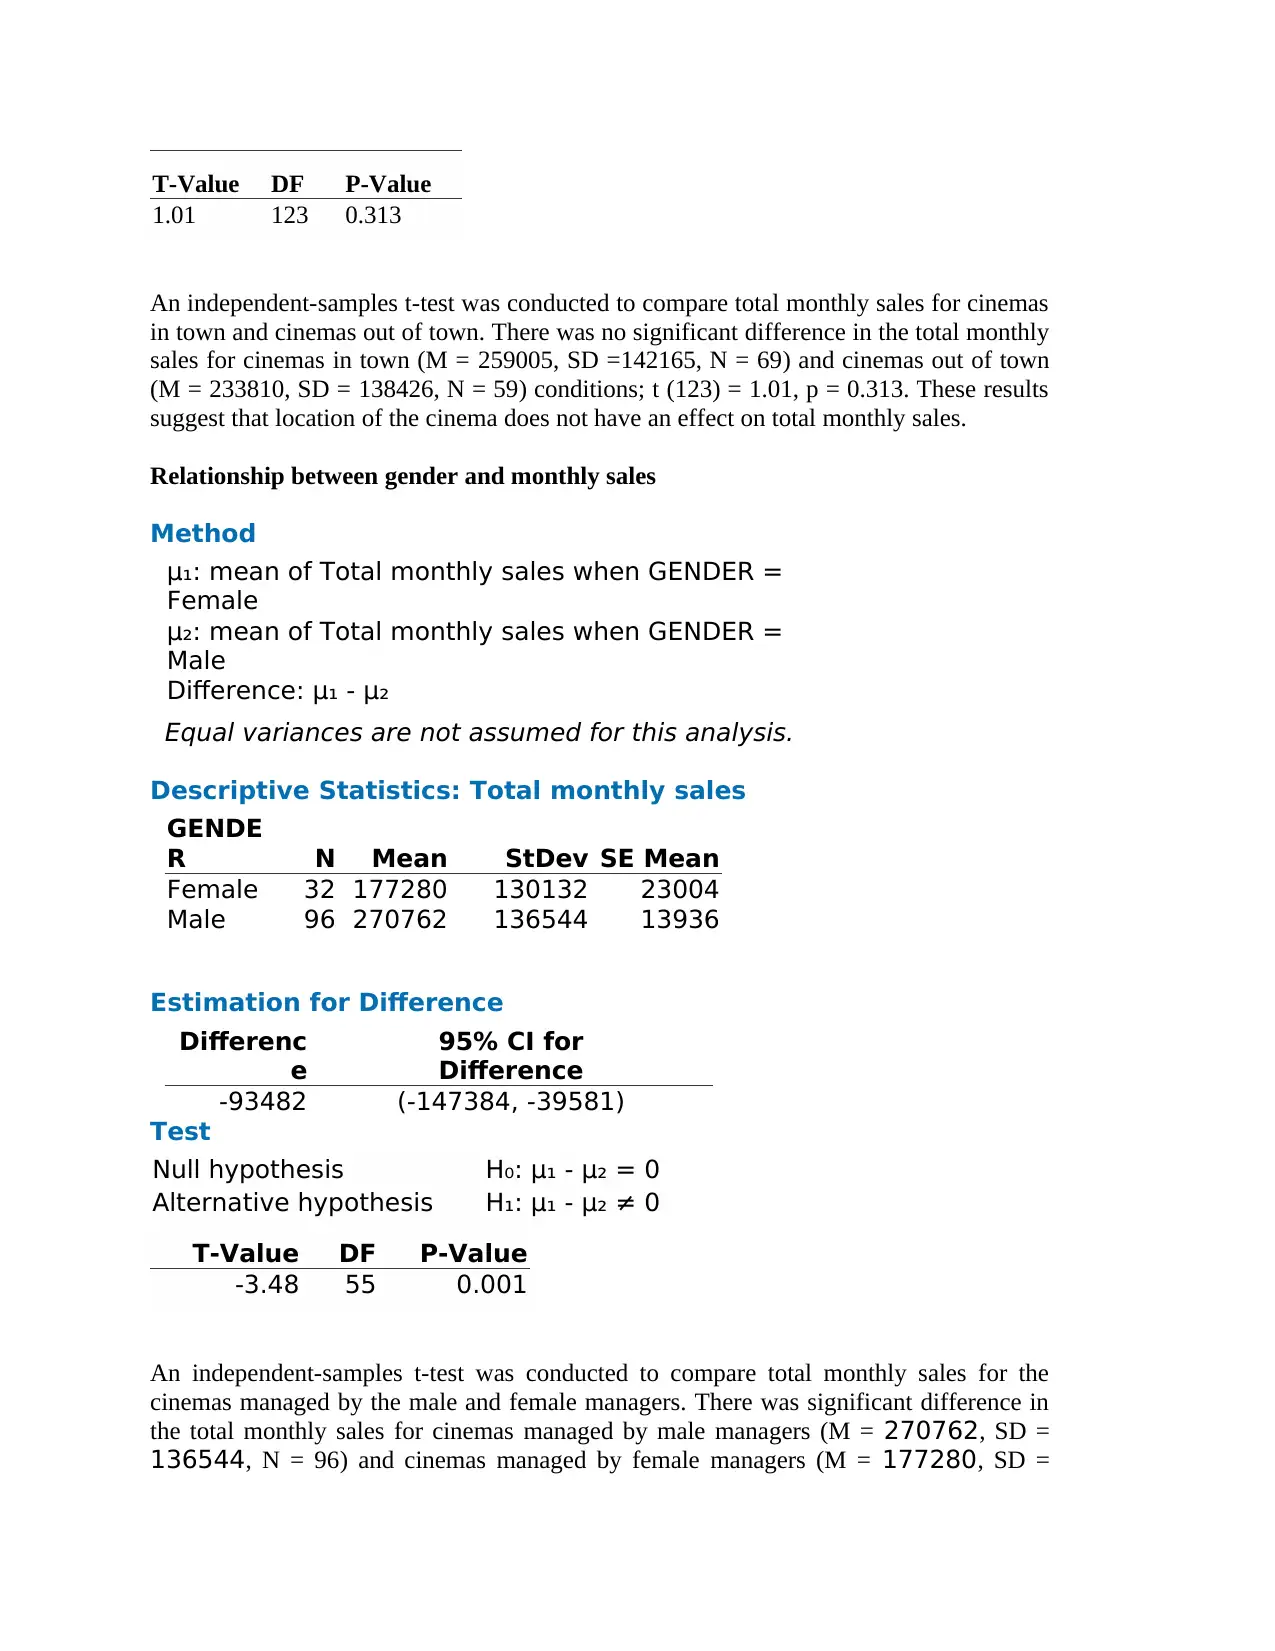
An independent-samples t-test was conducted to compare total monthly sales for the
cinemas managed by the male and female managers. There was significant difference in
the total monthly sales for cinemas managed by male managers (M = 270762, SD =
136544, N = 96) and cinemas managed by female managers (M = 177280, SD =
1.01 123 0.313
An independent-samples t-test was conducted to compare total monthly sales for cinemas
in town and cinemas out of town. There was no significant difference in the total monthly
sales for cinemas in town (M = 259005, SD =142165, N = 69) and cinemas out of town
(M = 233810, SD = 138426, N = 59) conditions; t (123) = 1.01, p = 0.313. These results
suggest that location of the cinema does not have an effect on total monthly sales.
Relationship between gender and monthly sales
Method
μ₁: mean of Total monthly sales when GENDER =
Female
μ₂: mean of Total monthly sales when GENDER =
Male
Difference: μ₁ - μ₂
Equal variances are not assumed for this analysis.
Descriptive Statistics: Total monthly sales
GENDE
R N Mean StDev SE Mean
Female 32 177280 130132 23004
Male 96 270762 136544 13936
Estimation for Difference
Differenc
e
95% CI for
Difference
-93482 (-147384, -39581)
Test
Null hypothesis H₀: μ₁ - μ₂ = 0
Alternative hypothesis H₁: μ₁ - μ₂ ≠ 0
T-Value DF P-Value
-3.48 55 0.001
An independent-samples t-test was conducted to compare total monthly sales for the
cinemas managed by the male and female managers. There was significant difference in
the total monthly sales for cinemas managed by male managers (M = 270762, SD =
136544, N = 96) and cinemas managed by female managers (M = 177280, SD =
⊘ This is a preview!⊘
Do you want full access?
Subscribe today to unlock all pages.
Trusted by 1+ million students worldwide
130132, N = 32) conditions; t (55) = -3.48, p = 0.001. These results suggest that gender
of the cinema manager does have an effect on total monthly sales. Specifically, our
results suggest that cinemas managed by male managers have higher total monthly sales
as compared to the cinemas that are managed by female managers (Mahdavi , 2012).
Relationship between monthly advertising expenditure and total monthly sales
The study sought to investigate the relationship between monthly advertising expenditure
and the total monthly sales. The hypothesis we sought to test is as follows;
Null hypothesis (H0): There is no significant relationship between monthly advertising
expenditure and the total monthly sales.
Alternative hypothesis (HA): There is significant relationship between monthly
advertising expenditure and the total monthly sales.
To test the hypothesis, we performed a regression analysis test as well as scatter plot was
plotted to check on the relationship.
Scatter plot
The scatter plot below shows that there is positive linear relationship between monthly
advertising expenditure and the total monthly sales. This means that increasing monthly
advertising expenditure is expected to result in an increase in total monthly sales.
Paraphrase This Document
Need a fresh take? Get an instant paraphrase of this document with our AI Paraphraser
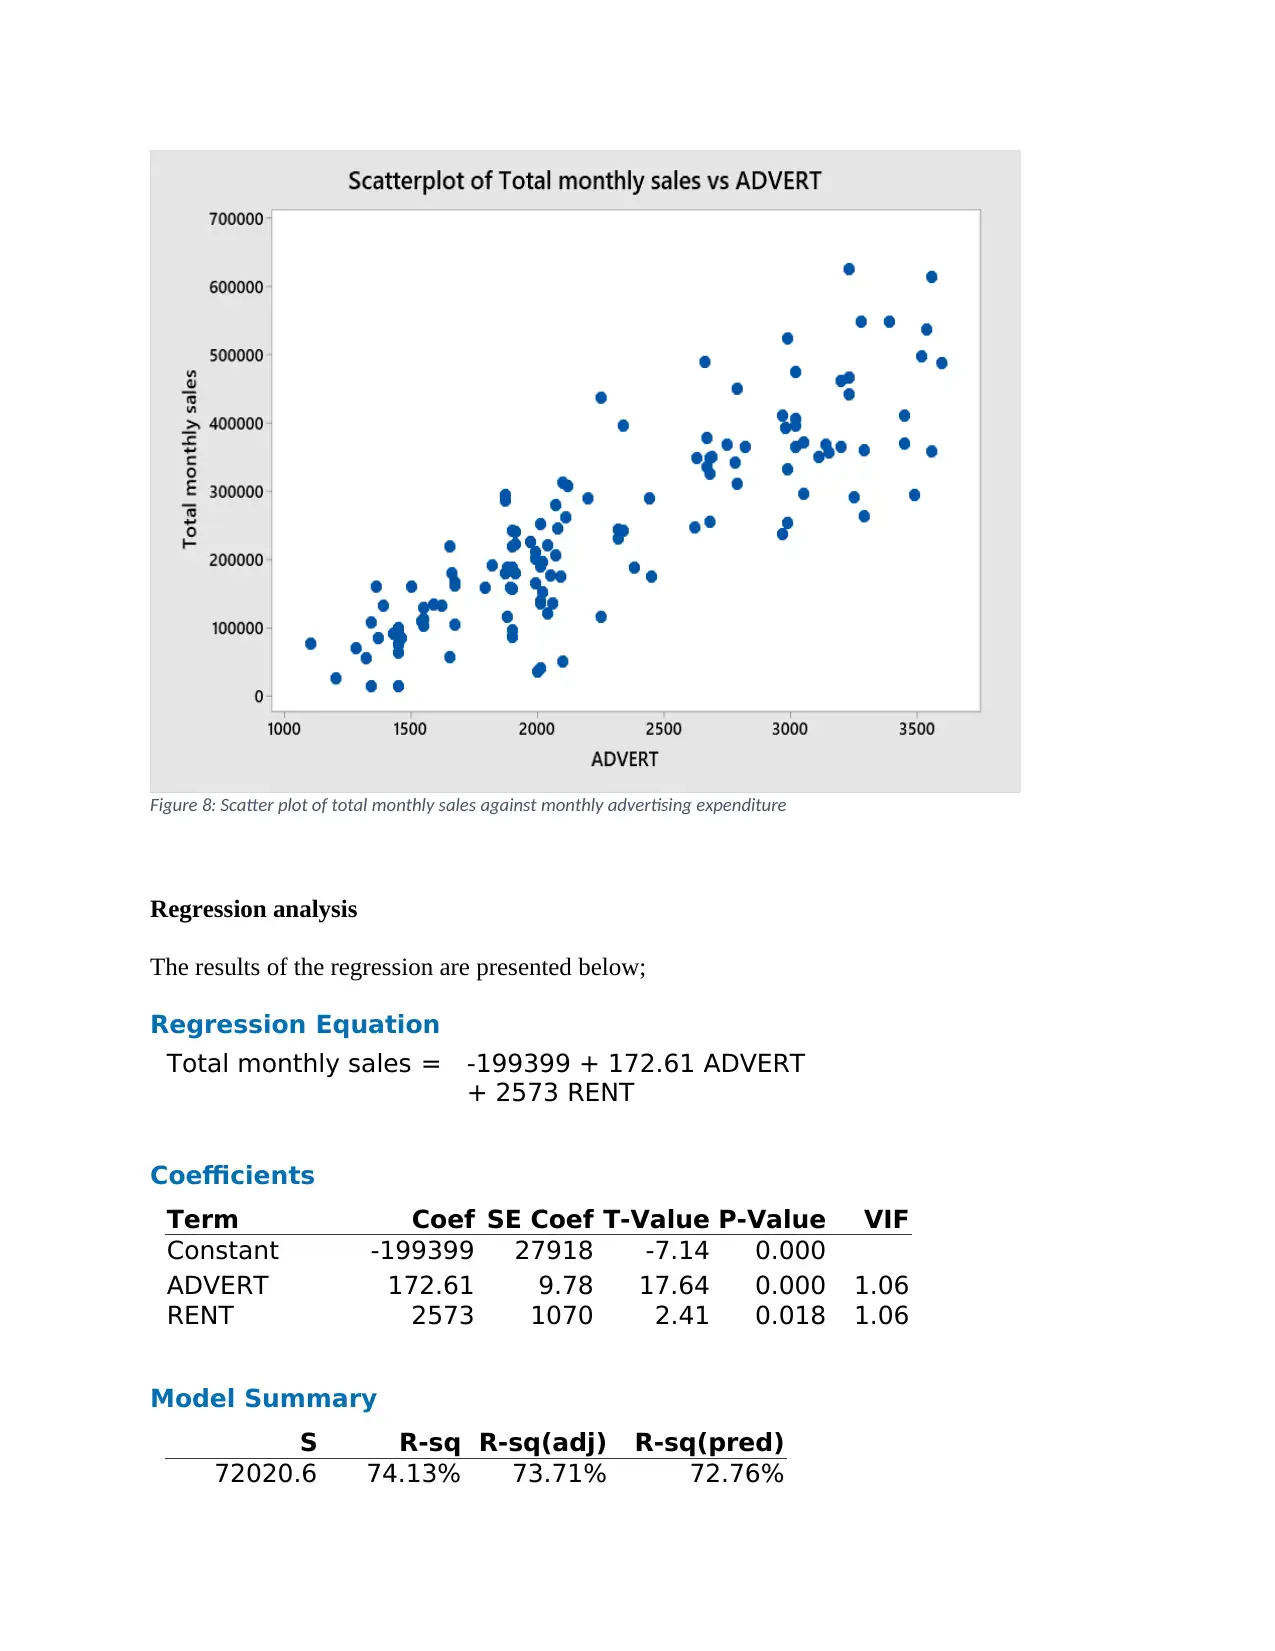
Figure 8: Scatter plot of total monthly sales against monthly advertising expenditure
Regression analysis
The results of the regression are presented below;
Regression Equation
Total monthly sales = -199399 + 172.61 ADVERT
+ 2573 RENT
Coefficients
Term Coef SE Coef T-Value P-Value VIF
Constant -199399 27918 -7.14 0.000
ADVERT 172.61 9.78 17.64 0.000 1.06
RENT 2573 1070 2.41 0.018 1.06
Model Summary
S R-sq R-sq(adj) R-sq(pred)
72020.6 74.13% 73.71% 72.76%
From the above results, we can see that there is significant relationship between monthly
advertising expenditures and total monthly sales made by the cinemas. The coefficient of
determination (R-squared) was found to be 74.13%; this implies that 74.13% of the
variation in the response (dependent) variable (total monthly sales) is explained by the
two independent variables (monthly expenditures and monthly rent).
The coefficient of advertising expenditure is 172.61; this means that a unit increase in
monthly expenditure would result in an increase in the total monthly sales by 172.61
(Tofallis, 2012).
The coefficient of rent is 2573; this means that a unit increase in monthly rent would
result in an increase in the total monthly sales by 2573.
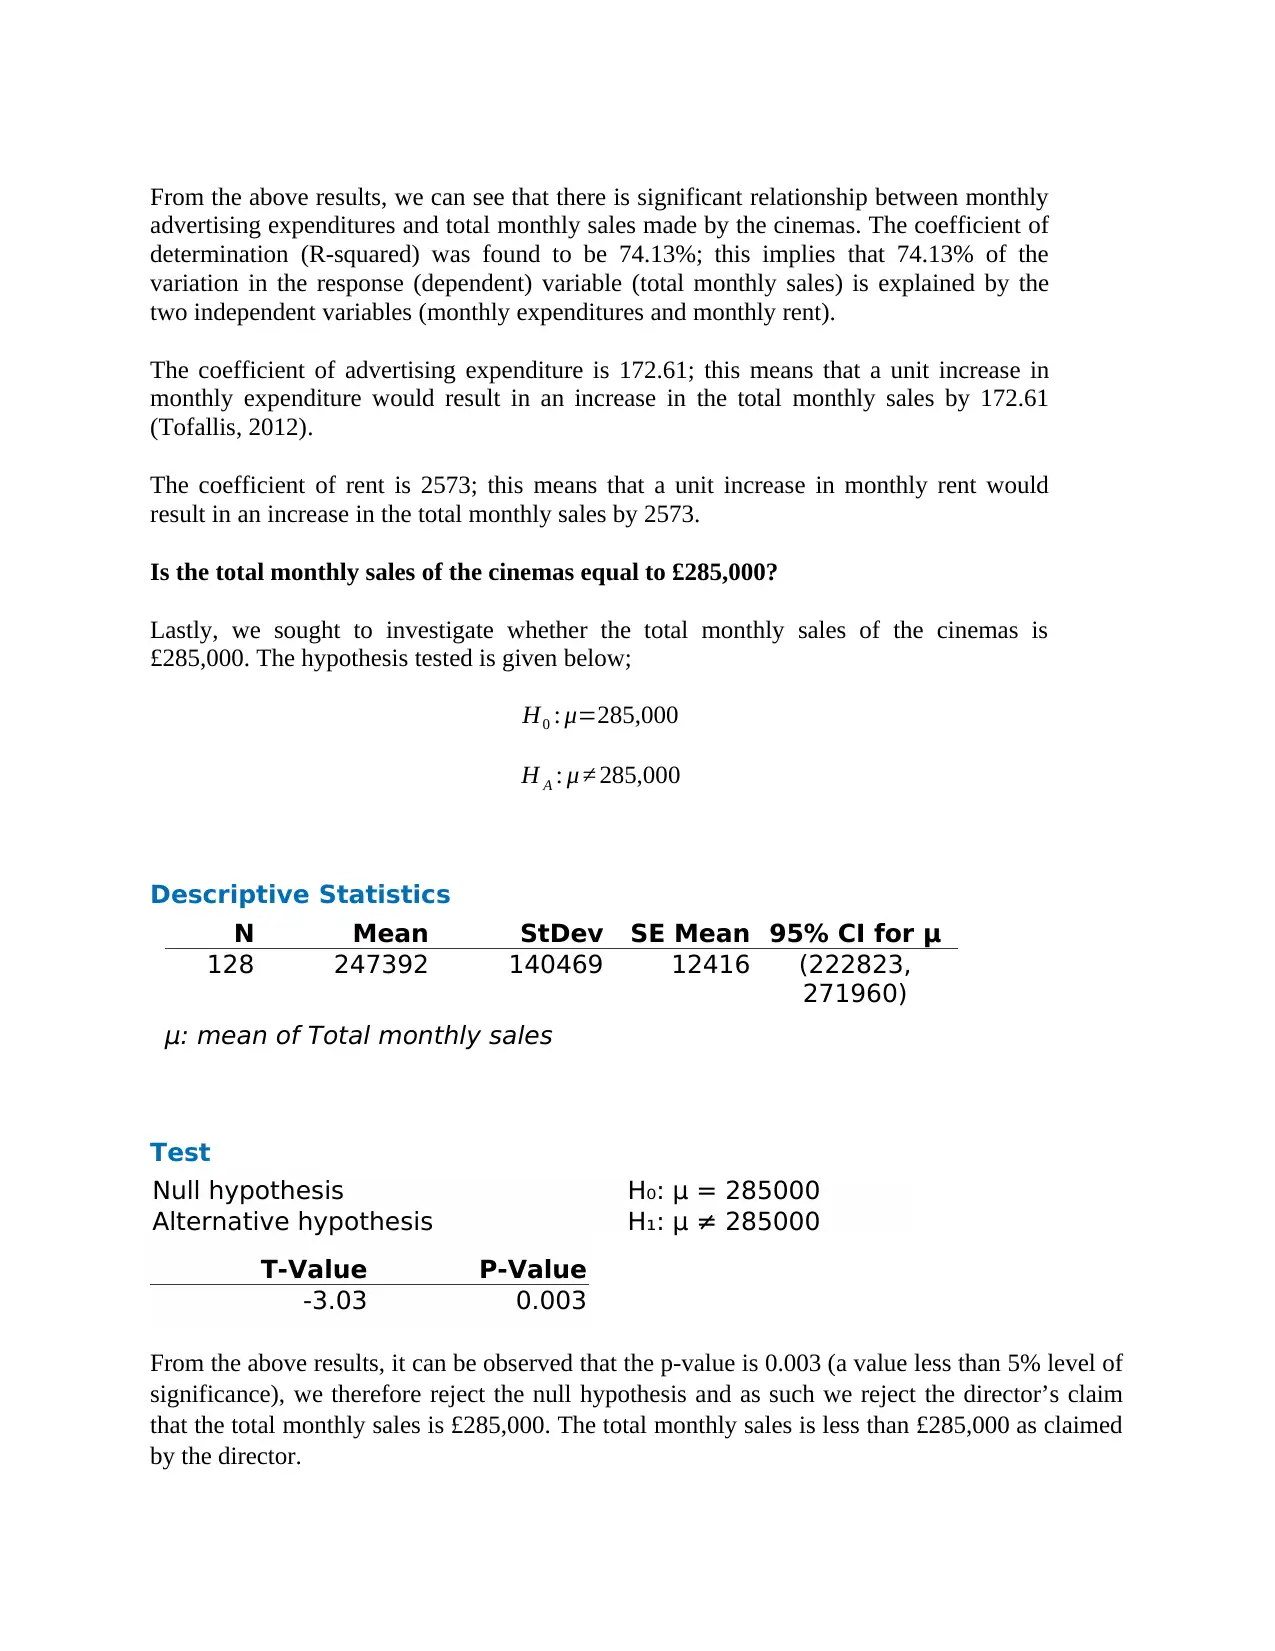
Is the total monthly sales of the cinemas equal to £285,000?
Lastly, we sought to investigate whether the total monthly sales of the cinemas is
£285,000. The hypothesis tested is given below;
H0 : μ=285,000
H A : μ ≠ 285,000
Descriptive Statistics
N Mean StDev SE Mean 95% CI for μ
128 247392 140469 12416 (222823,
271960)
μ: mean of Total monthly sales
Test
Null hypothesis H₀: μ = 285000
Alternative hypothesis H₁: μ ≠ 285000
T-Value P-Value
-3.03 0.003
From the above results, it can be observed that the p-value is 0.003 (a value less than 5% level of
significance), we therefore reject the null hypothesis and as such we reject the director’s claim
that the total monthly sales is £285,000. The total monthly sales is less than £285,000 as claimed
by the director.
advertising expenditures and total monthly sales made by the cinemas. The coefficient of
determination (R-squared) was found to be 74.13%; this implies that 74.13% of the
variation in the response (dependent) variable (total monthly sales) is explained by the
two independent variables (monthly expenditures and monthly rent).
The coefficient of advertising expenditure is 172.61; this means that a unit increase in
monthly expenditure would result in an increase in the total monthly sales by 172.61
(Tofallis, 2012).
The coefficient of rent is 2573; this means that a unit increase in monthly rent would
result in an increase in the total monthly sales by 2573.
Is the total monthly sales of the cinemas equal to £285,000?
Lastly, we sought to investigate whether the total monthly sales of the cinemas is
£285,000. The hypothesis tested is given below;
H0 : μ=285,000
H A : μ ≠ 285,000
Descriptive Statistics
N Mean StDev SE Mean 95% CI for μ
128 247392 140469 12416 (222823,
271960)
μ: mean of Total monthly sales
Test
Null hypothesis H₀: μ = 285000
Alternative hypothesis H₁: μ ≠ 285000
T-Value P-Value
-3.03 0.003
From the above results, it can be observed that the p-value is 0.003 (a value less than 5% level of
significance), we therefore reject the null hypothesis and as such we reject the director’s claim
that the total monthly sales is £285,000. The total monthly sales is less than £285,000 as claimed
by the director.
⊘ This is a preview!⊘
Do you want full access?
Subscribe today to unlock all pages.
Trusted by 1+ million students worldwide
1 out of 13

Your All-in-One AI-Powered Toolkit for Academic Success.
+13062052269
info@desklib.com
Available 24*7 on WhatsApp / Email
![[object Object]](/_next/static/media/star-bottom.7253800d.svg)
Unlock your academic potential
Copyright © 2020–2026 A2Z Services. All Rights Reserved. Developed and managed by ZUCOL.