Business Decision Making: Analyzing Data with Statistical Tools
VerifiedAdded on 2023/06/10
|12
|3168
|426
Report
AI Summary
This report delves into the realm of business decision-making, emphasizing the significance of data analysis and statistical tools. It examines the role of primary and secondary data, highlighting their collection and analysis within the context of Centaur company in the UK. Various statistical tools, including descriptive analysis, predictive analysis, and regression, are explored for their utility in problem-solving and informed decision-making. The report also reflects on potential threats and risks to business operations, incorporating data computation and visualization through graphs and charts for enhanced clarity. Furthermore, it provides a comparative analysis of primary and secondary data, underlining the suitability of each for different scales of information gathering. The financial aspects of Centaur Ltd. are analyzed using a statement of profit and loss to determine the performance of the company.

BUSINESS
DECISION MAKING
DECISION MAKING
Paraphrase This Document
Need a fresh take? Get an instant paraphrase of this document with our AI Paraphraser
Contents
INTRODUCTION...........................................................................................................................3
MAIN BODY..................................................................................................................................3
Accumulate and analyse primary and secondary data helpful in decision making.....................3
Adapt statistical tool and techniques which would help in analysing problems and facilitate
decision making as well...............................................................................................................7
Reflect the findings in a format of business report......................................................................9
CONCLUSION..............................................................................................................................10
REFERENCES..............................................................................................................................12
INTRODUCTION
The report prepared as under takes in account the topic which is Business decision making,
thus it explains the methods, tools and techniques helpful for deciding whether it would be
fruitful and beneficial to invest in a certain business (Agarwal, 2020). It further helps to
understand the importance of primary and secondary data so far collected by Centaur company
located in UK. It also explains various tools and techniques which would be useful in finding
solutions for related issues and problems surrounding the organisation in competitive
environment. There are statistical tools explained as under which includes predictive analysis,
descriptive analysis and regression as well. It further helps the company to have an idea about
threats and risks which can harm the running and functioning of business in long run. The report
also counts computation of data so far collected and presented with the help of graphs and charts.
It would give a more transparent and clearer picture regarding the business being run. The
prepared report helps to develop a comparison between primary and secondary data as well.
Primary is useful when information is collected on a small ground whereas for larger scale
secondary data is recommended.
MAIN BODY
Accumulate and analyse primary and secondary data helpful in decision making.
Primary Data: The primary data is a first hand and pure data which is collected by the
researcher personally. This form of data is the easiest of all the data. The researcher gathers the
information through communication, interaction, surveys or some experiments. It is taken place
specially when a particular topic, product or services are popular or in demand in the market
place and also some research are taken on the basis of requirement. The data and topic of
primary research is collected after fixing the goal and target customer need to be identified.
There are following method of primary data sources are:
Interviews: It is the tool of primary data which perform between two or more groups of peoples.
In this method two types of peoples are gather, one is for questioning and the other one
is for answering the questions. This tool is performing by 2 ways, face to face and vital
interviews (SA, 2020).
Merits of interviews:
⊘ This is a preview!⊘
Do you want full access?
Subscribe today to unlock all pages.
Trusted by 1+ million students worldwide
More information is collected.
Easy to detect and differentiate between response and non-response.
It is also helpful to control the sample also.
Demerits of Interviews:
First hand data collection is more time consuming activity.
It is also very costly.
Interviewer may be unfair.
Inspections and Questionnaires: It is done after the giving the necessary responses, the
researcher need to record and overlook. It is appropriate to conduct a leader study where the
questions are filled by experienced and also have to analyse the techniques which are not up to
the mark.
Merits of Inspections and Questionnaires:
This method is conducted in both the terms online or offline.
There is no time boundation.
It is less expensive then interview.
Demerits of Inspections and Questionnaires:
Degree of non-response bias are high.
It is fixed and can't be modify once sent.
Process of survey are slow.
Questionnaire on primary data:
1. Are the Customers satisfied enough with the present performance recorded by the
company?
Yes
No
Can do better
Very little
2. Are the investors getting enough return on investment made by them in the business?
No
Yes
Not adequate
Paraphrase This Document
Need a fresh take? Get an instant paraphrase of this document with our AI Paraphraser
Very little
3. Is there any growth observed between pre and post implementation of IFRS 16?
No
Yes
Maybe a little
4. Are the revenues generated by the company enough for carrying out its related
operational work?
Yes
No
Can do better
Very little
5. Is the company adapting new and innovative ideas for maintaining sustainability in
environment?
Not aware
Yes
No
Maybe
6. According to you has the company improved its performance rate over years?
No
Yes
Maybe
Not sure
Secondary data is collected from various sources which already have collected data
according to their need of research. The data is filtered according to the need of the research and
shortlisted from already collected sources. Data may be collected from the internal sources which
has early collected for the research purpose. External sources are those sources which are outside
the organisation and data is collected from those sources according to the need of the research.
Internal sources further include,
Balance sheet
Profit and Loss statement
Sales Figure
Previous marketing studies
Inventory records
If the data collected will not be adequate in order to conduct a research, then the data can be
collected from external sources which includes,
Universities
Corporate filings
Business, trade and professional association
Government sources
Types of secondary data:
Websites: It is a type of secondary information through which data can be
collected such as sites developed by the company for better accessibility through
customers. Websites helps to access data which would provide useful details
about business such as what is its profit and loss statements and records, financial
position of a related firm in economy whether customer engagement has increased
or not. It also gives knowledge about upcoming projects of an enterprise over
years (Ahmad, Shah and Abbass 2020).
Articles, Books, Journals: With the help of books, journals and articles published
one can find out operational and market related activities carried out by a firm
over a period of time. It further provides guidance about partners and sponsors
who have engaged and formed a relationship with the company. It also helps to
access their experiences in context of organisation. Thus, secondary data is
helpful to have a thorough knowledge about the working of companies in
environment. It would be having less possibilities of errors to be occurred in the
collection of data as it is being collected by experts and published by experienced
people.
Government publication: It is considered as a type of data which states that the
business is ethical in its practices and is not involved in any fraud actions or
activities. Thus it serves as a strong evidence in the eye of law and customers
present as well as linked with the company too. Records checked and published
⊘ This is a preview!⊘
Do you want full access?
Subscribe today to unlock all pages.
Trusted by 1+ million students worldwide
by the government authorities are accurate and reliable. Thus it is useful for
investors to make effective decisions in lesser course of time (Alamdar Youli and
et.al., 2020).
Internal records: These are such records which are prepared by staff persons
working inside the firm for external users such as employment status, number of
investors and clients linked, future plans, budgets being prepared and financial
records being developed. It is helpful for company’s managers to assess if any
variation recorded and for customers it would help to examine related growth and
expansion over a period of time.
Adapt statistical tool and techniques which would help in analysing problems and facilitate
decision making as well.
Statistical analysis is useful as it involves collection of information and data which is organised
in a specific manner serving meaning to it. It has various functions linked such as predicting
risks and future related situations, develop models and adapt trends. There are many methods and
ways that would be useful for finding solutions of related issues occurring in a Centaur Ltd .
Company in UK. It is necessary for every business to find effective ways which would contribute
in process of decision making. Some tools are explained as under:
Descriptive statistical analysis: It is considered one of the easiest form of analysis in
statistical area which is adapted and used for explaining the qualities present in a data set.
It is a tool that would assist Centaur company in minimizing huge data set in an easy
understandable and simple form which would guide in interpretations as well. It takes in
account use of visualised techniques such as charts, graphs and tables for making
assessment of information easier. It is not counted as an accurate method for reaching
conclusion. It can only provide assistance in representing data in such a way that tools
can be applied in the data set for drawing inferences. It counts Mean, median and mode
for ascertaining central value from a formed data set (Chiheb, Boumahdi and Bouarfa,
2022).
Predictive analysis: As the name suggests it is used in companies to use information for
providing related guidance in the process of decision making. Business can use methods
such as algorithms, machine learning and graph preparations as well. It further is
considered as best technique for choosing among available alterative courses of action.
Paraphrase This Document
Need a fresh take? Get an instant paraphrase of this document with our AI Paraphraser
Explanatory data analysis: It is a method which is used by data scientists for identifying
trends and patterns available in a data set. IT can also be adapted for determining
relationship between samples available in a population, testing of hypothesis and finding
missing data values as well. Firms can use such analysis for making insights that are on
the basis of information and find errors present in a data set.
Associational statistical analysis: It is a technique which is helpful in making predictions
and finding causality if any. They use it for judgement and assessment of relationships if
prevailing any between several variables. It is useful in determining if researchers are
able to make related predictions in relation with a data set. For measuring association and
linkage researchers adapt an extensive range of coefficient of variation that takes in
account regression and correlation as well (Delen, 2019).
Statistical methods helpful in business for related decision making:
Multiple Regression: It is a statistical tool which is used for finding an association
between independent variable and dependent variable. It is helpful in assessing whether
the relation among two variables is strong, weak or is variable over a time interval. The
formula applicable for such methods is:
Y= a + b(x)
Where y stands for independent variable or the information is helpful in predicting the
dependent variable as well.
X denotes dependent variable that is sort of variable which is to be measured.
a stands for y intercept or the amount of y when is equivalent to zero.
B defines the slope of regression graph.
Single variable linear regression: It is helpful for two effective purposes such as for
evaluating the association between two variables and forecasting a variable which relies
on its relation with other one. In such cases the relation is evaluated by understanding the
line which best fits. The formula applied is stated as under:
ŷ = α + βx + ε
Hypothesis testing: It is used for testing if a conclusion is appropriate and accurate for a
certain data set with the help of comparison between information collected against a
specified assumption. The outcome of the test can be either null or alternate hypothesis
where in case of null hypothesis it defines that there is no significant relationship between
variables selected. If anything disturbs the null hypothesis is known as hypothesis 1
(Kurilovas, 2020).
Reflect the findings in a format of business report.
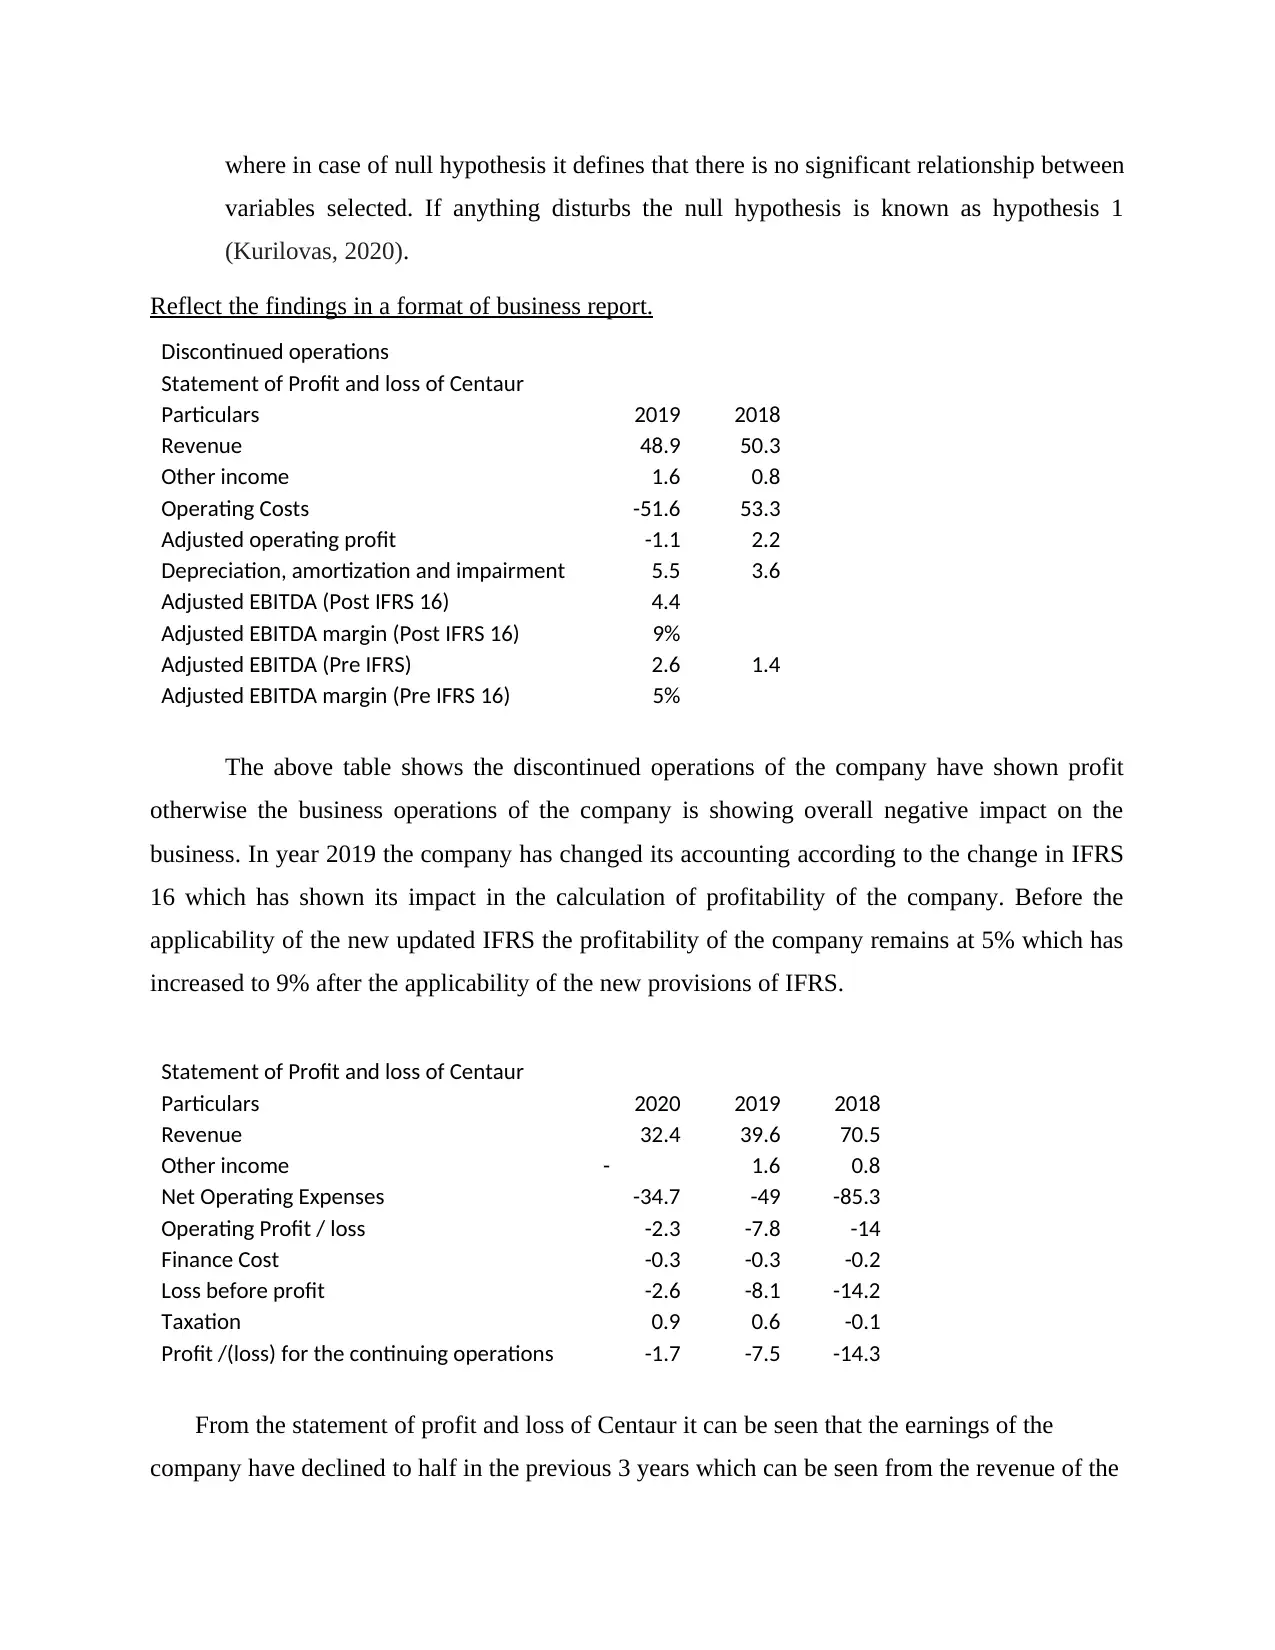
Discontinued operations
Statement of Profit and loss of Centaur
Particulars 2019 2018
Revenue 48.9 50.3
Other income 1.6 0.8
Operating Costs -51.6 53.3
Adjusted operating profit -1.1 2.2
Depreciation, amortization and impairment 5.5 3.6
Adjusted EBITDA (Post IFRS 16) 4.4
Adjusted EBITDA margin (Post IFRS 16) 9%
Adjusted EBITDA (Pre IFRS) 2.6 1.4
Adjusted EBITDA margin (Pre IFRS 16) 5%
The above table shows the discontinued operations of the company have shown profit
otherwise the business operations of the company is showing overall negative impact on the
business. In year 2019 the company has changed its accounting according to the change in IFRS
16 which has shown its impact in the calculation of profitability of the company. Before the
applicability of the new updated IFRS the profitability of the company remains at 5% which has
increased to 9% after the applicability of the new provisions of IFRS.
Statement of Profit and loss of Centaur
Particulars 2020 2019 2018
Revenue 32.4 39.6 70.5
Other income - 1.6 0.8
Net Operating Expenses -34.7 -49 -85.3
Operating Profit / loss -2.3 -7.8 -14
Finance Cost -0.3 -0.3 -0.2
Loss before profit -2.6 -8.1 -14.2
Taxation 0.9 0.6 -0.1
Profit /(loss) for the continuing operations -1.7 -7.5 -14.3
From the statement of profit and loss of Centaur it can be seen that the earnings of the
company have declined to half in the previous 3 years which can be seen from the revenue of the
variables selected. If anything disturbs the null hypothesis is known as hypothesis 1
(Kurilovas, 2020).
Reflect the findings in a format of business report.
Discontinued operations
Statement of Profit and loss of Centaur
Particulars 2019 2018
Revenue 48.9 50.3
Other income 1.6 0.8
Operating Costs -51.6 53.3
Adjusted operating profit -1.1 2.2
Depreciation, amortization and impairment 5.5 3.6
Adjusted EBITDA (Post IFRS 16) 4.4
Adjusted EBITDA margin (Post IFRS 16) 9%
Adjusted EBITDA (Pre IFRS) 2.6 1.4
Adjusted EBITDA margin (Pre IFRS 16) 5%
The above table shows the discontinued operations of the company have shown profit
otherwise the business operations of the company is showing overall negative impact on the
business. In year 2019 the company has changed its accounting according to the change in IFRS
16 which has shown its impact in the calculation of profitability of the company. Before the
applicability of the new updated IFRS the profitability of the company remains at 5% which has
increased to 9% after the applicability of the new provisions of IFRS.
Statement of Profit and loss of Centaur
Particulars 2020 2019 2018
Revenue 32.4 39.6 70.5
Other income - 1.6 0.8
Net Operating Expenses -34.7 -49 -85.3
Operating Profit / loss -2.3 -7.8 -14
Finance Cost -0.3 -0.3 -0.2
Loss before profit -2.6 -8.1 -14.2
Taxation 0.9 0.6 -0.1
Profit /(loss) for the continuing operations -1.7 -7.5 -14.3
From the statement of profit and loss of Centaur it can be seen that the earnings of the
company have declined to half in the previous 3 years which can be seen from the revenue of the
⊘ This is a preview!⊘
Do you want full access?
Subscribe today to unlock all pages.
Trusted by 1+ million students worldwide
company. Companies net operating have declined over the period of time which is considered as
good but with this company’s overall revenue has also declined over the period of time.
Organisation’s operating loss have decreased every year which shows company is working on
reduction of cost of the company to increase its profits. In year 2018 the loss of the company was
-14.3 which has decreased to -1.7 in the year 2020.
Organisation’s Net current assets and current assets have also decline in values over the period of
time company is not been able to maintain its level of assets which were previously held by the
corporate. Current liabilities and non-current liabilities of the company have decreased which
shows that the company has paid is creditors and also reduced its other liabilities associated with
the company.
CONCLUSION
From the above prepared report, it can be asserted as well as concluded that it is very
necessary for every company whether small or medium to understand the base which is
being used for collecting, organising and sorting of data. It further helps to understand which
tool would best fit in the requirements of organisation. It is necessary for the business to
collect relevant and accurate data for predicting future courses of action. It promotes
contribution in finding best method which could be adapted. The report also serves as a
guiding light in the eyes of linked customers and investors of whether the company is in a
profitable situation or not. It also helps the managers to understand where the operations
related to organisation are lacking and lagging behind. It helps to find out best and effective
solutions for minimizing losses and risks. On other hand it also focuses on generating
revenues and profit in problematic situations as well. Therefore, it can be said that primary
and secondary data as well as methods are important for reaching a conclusion as which tool
must be adapted for effective and efficient solutions related to firm.
Paraphrase This Document
Need a fresh take? Get an instant paraphrase of this document with our AI Paraphraser

REFERENCES
Books and Journals
Agarwal, R., 2020. Decision-making with temporal association rule mining and clustering in
supply chains. In Optimization and Inventory Management (pp. 459-470). Springer,
Singapore.
Ahmad, M., Shah, S.Z.A. and Abbass, Y., 2020. The role of heuristic-driven biases in
entrepreneurial strategic decision-making: evidence from an emerging
economy. Management Decision.
Alamdar Youli, F and et.al., 2020. Designing a sustainable business model by using soft systems
methodology and value triangle business model canvas (case study: Farassan
Manufacturing and Industrial Company). Modern Research in Decision Making. 5(1).
pp.95-117.
Chiheb, F., Boumahdi, F. and Bouarfa, H., 2022. A Conceptual Model for Describing the
Integration of Decision Aspect into Big Data. In Research Anthology on Big Data
Analytics, Architectures, and Applications (pp. 294-318). IGI Global.
Delen, D., 2019. Prescriptive analytics: The final frontier for evidence-based management and
optimal decision making. FT Press.
Kurilovas, E., 2020. On data-driven decision-making for quality education. Computers in Human
Behavior. 107. p.105774.
Mola, L nd et.al., 2020. Business Intelligence System Design and its Consequences for
Knowledge Sharing, Collaboration, and Decision-Making: An Exploratory Study.
In Information Diffusion Management and Knowledge Sharing: Breakthroughs in
Research and Practice (pp. 382-402). IGI Global.
SA, Z.E.P.C., 2020. Enhancing Decision-Making Skills: Know and Avoid Frame Dependence
Bias. Management Accounting Quarterly. 21(3). pp.23-31.
Shaw, S., Rowland, Z. and Machova, V., 2021. Internet of Things smart devices, sustainable
industrial big data, and artificial intelligence-based decision-making algorithms in cyber-
physical system-based manufacturing. Economics, Management and Financial
Markets. 16(2). pp.106-116.
Stephens, S., Lyons, R. and Cunningham, I., 2021. The Decision-Making Environment for the
Entrepreneurial Student. Journal of Enterprising Culture. 29(01). pp.65-78.
Westgren, R.E., Sonka, S.T. and Vitins, G.S., 2019. The Comprehensiveness of Strategic
Decision Making and Its Relationship to Business Unit Performance. In Competitive
Strategy Analysis in the Food System (pp. 351-369). CRC Press.
Xue, R nd et.al., 2019, April. Financial literacy and financial decision-making: The mediating
role of financial concerns. In The 10th Financial Markets & Corporate Governance
Conference: Capital Markets, Sustainability and Disruptive Technologies.
⊘ This is a preview!⊘
Do you want full access?
Subscribe today to unlock all pages.
Trusted by 1+ million students worldwide
1 out of 12
Related Documents


Your All-in-One AI-Powered Toolkit for Academic Success.
+13062052269
info@desklib.com
Available 24*7 on WhatsApp / Email
![[object Object]](/_next/static/media/star-bottom.7253800d.svg)
Unlock your academic potential
Copyright © 2020–2026 A2Z Services. All Rights Reserved. Developed and managed by ZUCOL.