Business Decision Making: Data Analysis, Investment & Market Research
VerifiedAdded on 2023/04/23
|23
|4480
|344
Report
AI Summary
This report provides a comprehensive analysis of business decision-making, focusing on data analysis, statistical methods, and project evaluation. It begins with a research plan for collecting primary and secondary data to understand market dynamics for a new trainer brand launch. The report then calculates mean, mode, median, range, standard deviation, and correlation coefficients to analyze sales data and advise on pricing strategies. Graphical presentations, including line and bar graphs, illustrate sales, cost, and profitability trends, leading to insights on cost reduction for improved profitability. The study also employs critical path method, Gantt charts, and PERT for operational decision-making and investment appraisal methods like Payback, NPV, and IRR for financial decisions, culminating in project selection recommendations with justification. The report concludes by emphasizing the importance of informed financial and operational decisions for organizational success.

Business Decision Making
Paraphrase This Document
Need a fresh take? Get an instant paraphrase of this document with our AI Paraphraser
TABLE OF CONTENTS
introduction......................................................................................................................................4
task 1................................................................................................................................................4
1. 1 Research plan for collecting primary and secondary data....................................................4
1. 2 Survey methodology and Sampling frame for research.......................................................4
1.3 Sample of questionnaire........................................................................................................5
Task 2...............................................................................................................................................6
2.1 Calculation of mean mode median........................................................................................6
2. 2 Analysis of the calculation and advise Karen on the most popular price for orders over the
last month.....................................................................................................................................7
2.3 Calculation of Range, standard deviation, quartile, percentile and interquartile range.........7
2.4 Calculation of correlation coefficient....................................................................................8
Task 3...............................................................................................................................................9
3.1 & 4.1 Line/ Bar graphs of showing sales profitability and cost with valid conclusion.........9
3. 2 Trend line graph for sales, costs and profit.........................................................................10
3. 3 Power Point Presentation....................................................................................................12
3.4 Business report.....................................................................................................................15
Task 4.............................................................................................................................................16
4.2 Calculation of the project duration and critical path...........................................................16
Task 5.............................................................................................................................................18
4. 3 Calculation of the Payback, NPV and IRR for Project Super & Project Sonic and
appropriate recommendations for project selection with justification......................................18
Conclusion.....................................................................................................................................21
References......................................................................................................................................22
TABLE OF FIGURES
Figure 1: Line graph showing sales, cost and profitability..............................................................9
Figure 2: Bar graph showing sales, cost and profitability.............................................................10
Figure 3: Trend line graph for sales, cost and profit......................................................................11
Figure 4: Gantt chart for new project of Ace.................................................................................17
Figure 5: Network Diagram for new project of Ace......................................................................18
LIST OF TABLES
Table 1: Calculation of range, quartile and interquartile range.......................................................7
Table 2: Correlation coefficient.......................................................................................................8
Table 3: Calculation of the critical path........................................................................................16
Table 4: Calculation of Payback period.........................................................................................18
Table 5: Calculation of Net Present...............................................................................................19
Table 6: Calculation of Internal Rate of Return............................................................................20
⊘ This is a preview!⊘
Do you want full access?
Subscribe today to unlock all pages.
Trusted by 1+ million students worldwide
INTRODUCTION
Financial and operational decisions are considered as major important decisions of an
organization. Every business needs to focus on these decisions and should apply appropriate
techniques at the time of decision making process (Hobbs, 2009). The current research study is
based on business decision making and regarding this it will focus on different business scenario
and case studies. This research shed lights on the use of research plan, statistical analysis of data
and graphical presentation in business decisions. Along with this, it includes critical path
method, Gantt chart and PERT for operational decision making. Including this, it will also
describe how an organization can use investment appraisal methods for financial decision
making of an organization.
TASK 1
1. 1 Research plan for collecting primary and secondary data
As per the given business scenario client wants to launch a new brand of trainers in
London. Regarding this, he/she wants to conduct market research for understanding needs and
requirements of customers and market dynamics.
Research plan for primary and secondary data collection:
According to this research plan, consultant will collect relevant facts and figures using
both primary and secondary data collection methods. Primary data helps in collecting
information about the present and fresh situation of market. On the other hand, secondary data
will help in collecting historical facts of this market. Primary data will be collected by survey
methodology and regarding this researcher will develop an appropriate questionnaire (Lind,
Marchal and Wathen, 2005). In contrast, secondary data collection will be done by using various
sources such as websites and annual reports of different companies, journals, books, literatures,
etc. All these data will help in getting suitable information for organization.
1. 2 Survey methodology and Sampling frame for research
Survey methodology:
Author will conduct online survey of customers of trainers because it will help in
reducing time and cost for whole market research. Including this, author will formulate a
questionnaire for this survey which will include various open and close ended questions relevant
4 | P a g e
Paraphrase This Document
Need a fresh take? Get an instant paraphrase of this document with our AI Paraphraser
to needs and requirements of customers. Therefore, online survey of customers will help in
collecting and recording appropriate information (Newbold and et. al., 2009).
Sampling Frame:
Author needs to select appropriate sample of customers for collecting primary
information. Regarding this, researcher will use random number sampling method because will
be significant for the current market research because it will reduce sampling error by providing
equal chance to each and every customer to select in a sample. Author will select 20 customers
of trainers which will represent the whole research universe. Therefore, sample size for the
current investigation will be 20 (Kathy and Deborah, 2007).
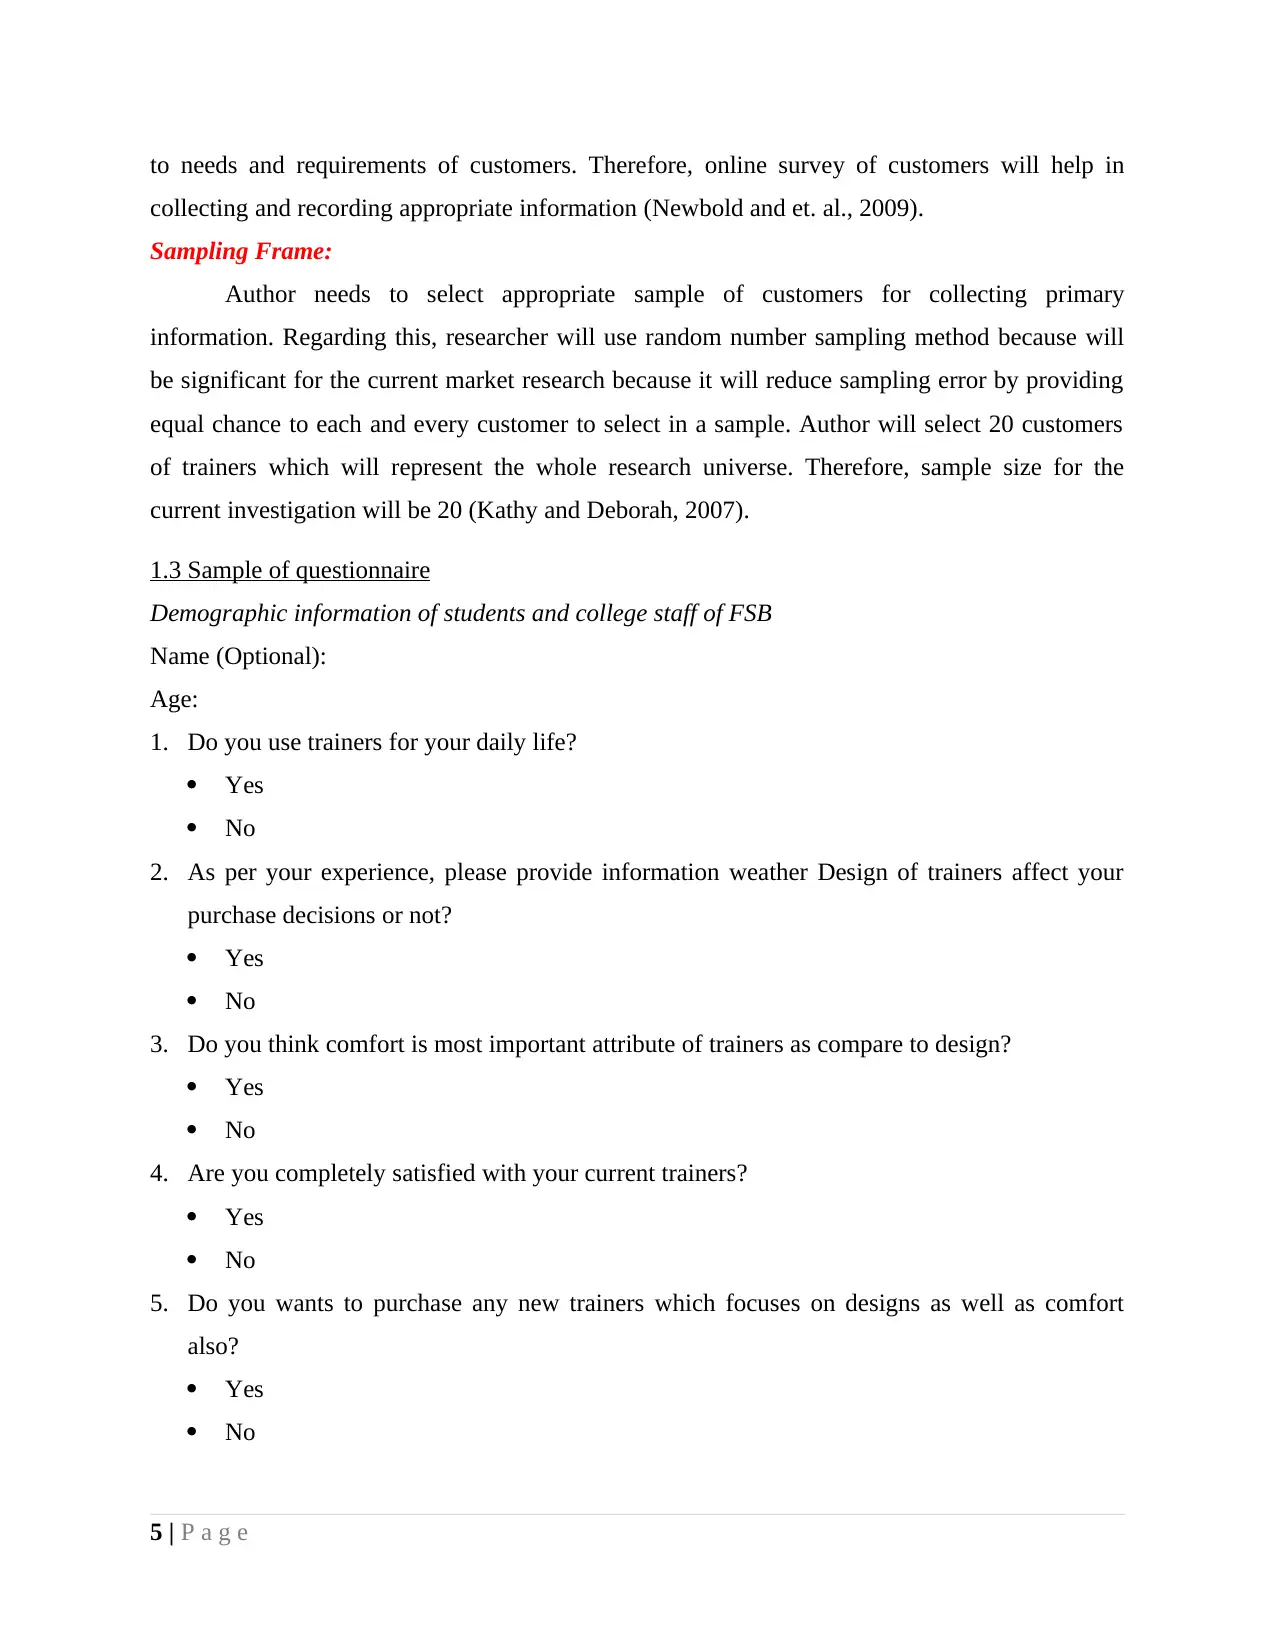
1.3 Sample of questionnaire
Demographic information of students and college staff of FSB
Name (Optional):
Age:
1. Do you use trainers for your daily life?
Yes
No
2. As per your experience, please provide information weather Design of trainers affect your
purchase decisions or not?
Yes
No
3. Do you think comfort is most important attribute of trainers as compare to design?
Yes
No
4. Are you completely satisfied with your current trainers?
Yes
No
5. Do you wants to purchase any new trainers which focuses on designs as well as comfort
also?
Yes
No
5 | P a g e
collecting and recording appropriate information (Newbold and et. al., 2009).
Sampling Frame:
Author needs to select appropriate sample of customers for collecting primary
information. Regarding this, researcher will use random number sampling method because will
be significant for the current market research because it will reduce sampling error by providing
equal chance to each and every customer to select in a sample. Author will select 20 customers
of trainers which will represent the whole research universe. Therefore, sample size for the
current investigation will be 20 (Kathy and Deborah, 2007).
1.3 Sample of questionnaire
Demographic information of students and college staff of FSB
Name (Optional):
Age:
1. Do you use trainers for your daily life?
Yes
No
2. As per your experience, please provide information weather Design of trainers affect your
purchase decisions or not?
Yes
No
3. Do you think comfort is most important attribute of trainers as compare to design?
Yes
No
4. Are you completely satisfied with your current trainers?
Yes
No
5. Do you wants to purchase any new trainers which focuses on designs as well as comfort
also?
Yes
No
5 | P a g e
6. Please, provide appropriate suggestions for improving designs and features of new trainer
product.
TASK 2
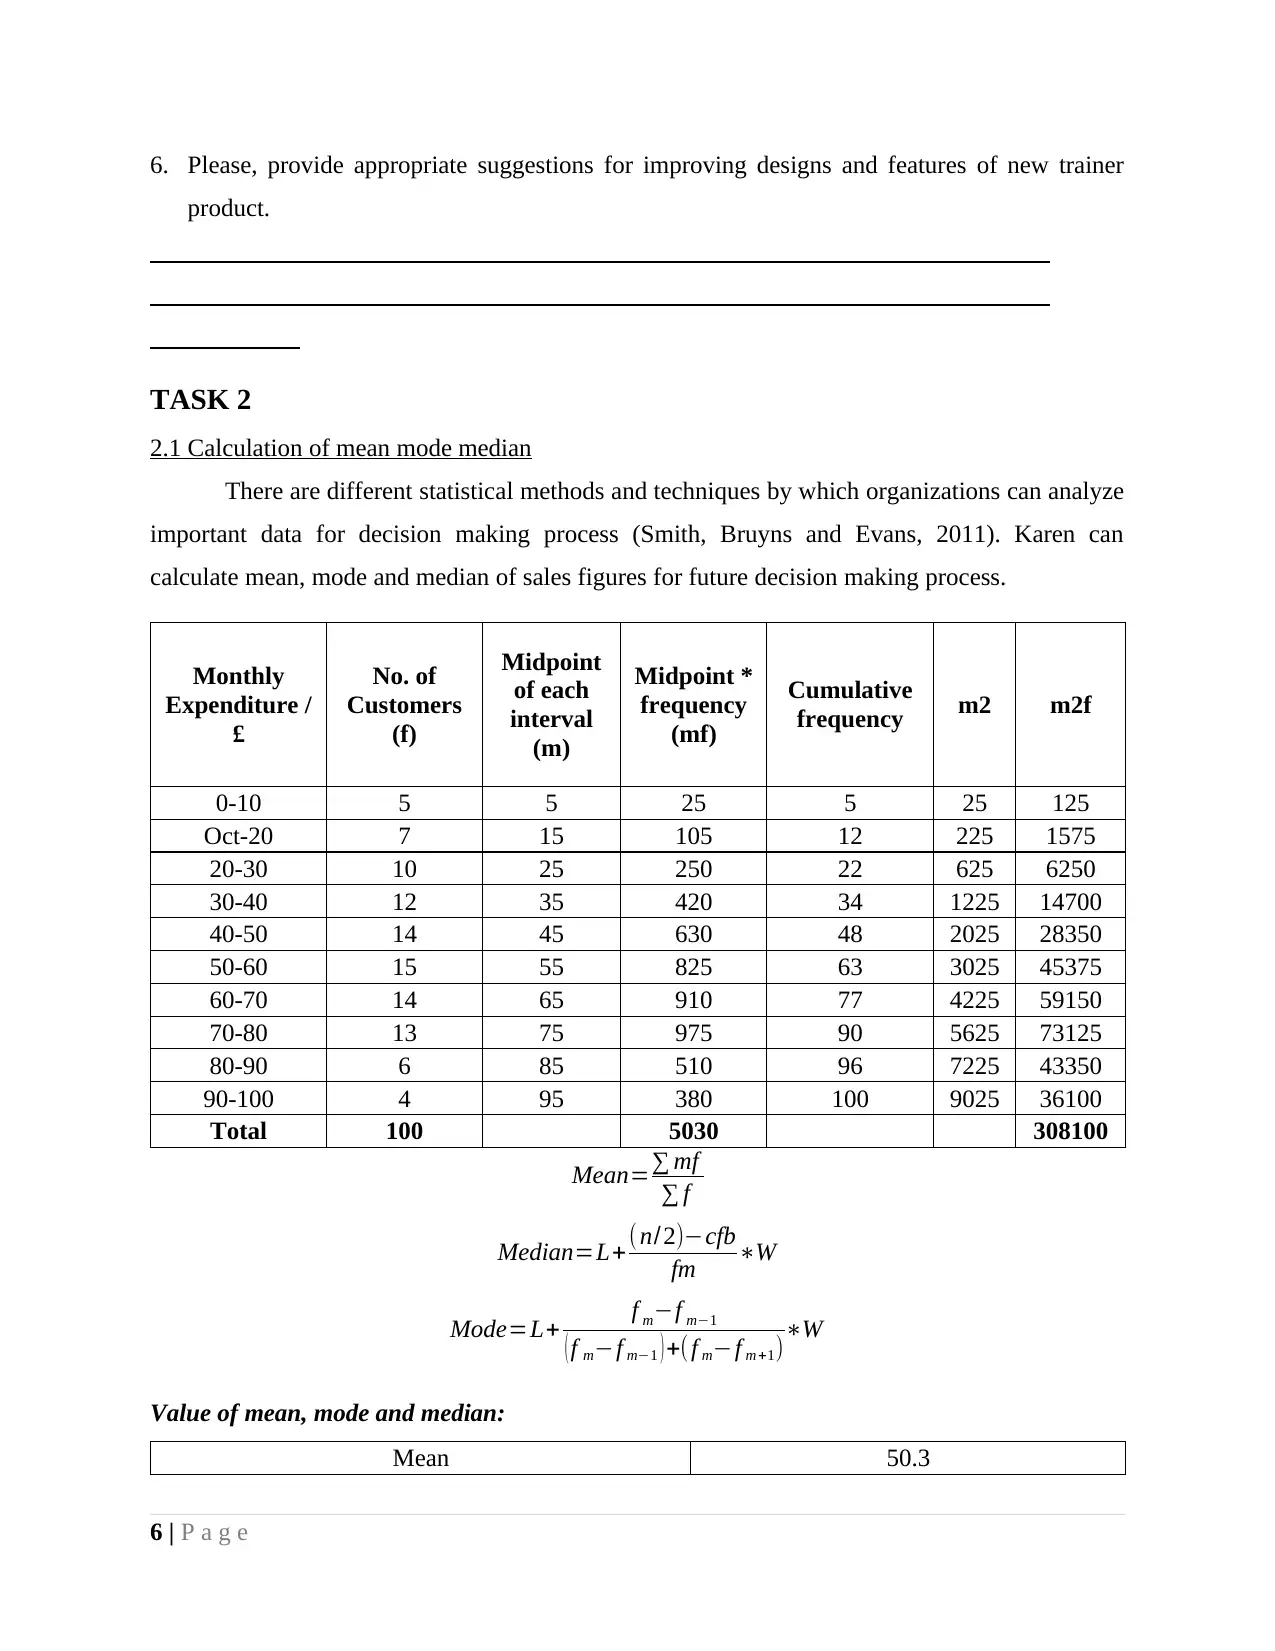
2.1 Calculation of mean mode median
There are different statistical methods and techniques by which organizations can analyze
important data for decision making process (Smith, Bruyns and Evans, 2011). Karen can
calculate mean, mode and median of sales figures for future decision making process.
Monthly
Expenditure /
£
No. of
Customers
(f)
Midpoint
of each
interval
(m)
Midpoint *
frequency
(mf)
Cumulative
frequency m2 m2f
0-10 5 5 25 5 25 125
Oct-20 7 15 105 12 225 1575
20-30 10 25 250 22 625 6250
30-40 12 35 420 34 1225 14700
40-50 14 45 630 48 2025 28350
50-60 15 55 825 63 3025 45375
60-70 14 65 910 77 4225 59150
70-80 13 75 975 90 5625 73125
80-90 6 85 510 96 7225 43350
90-100 4 95 380 100 9025 36100
Total 100 5030 308100
Mean=∑ mf
∑ f
Median=L+(n/2)−cfb
fm ∗W
Mode=L+ f m−f m−1
( f m−f m−1 ) +( f m−f m +1)∗W
Value of mean, mode and median:
Mean 50.3
6 | P a g e
product.
TASK 2
2.1 Calculation of mean mode median
There are different statistical methods and techniques by which organizations can analyze
important data for decision making process (Smith, Bruyns and Evans, 2011). Karen can
calculate mean, mode and median of sales figures for future decision making process.
Monthly
Expenditure /
£
No. of
Customers
(f)
Midpoint
of each
interval
(m)
Midpoint *
frequency
(mf)
Cumulative
frequency m2 m2f
0-10 5 5 25 5 25 125
Oct-20 7 15 105 12 225 1575
20-30 10 25 250 22 625 6250
30-40 12 35 420 34 1225 14700
40-50 14 45 630 48 2025 28350
50-60 15 55 825 63 3025 45375
60-70 14 65 910 77 4225 59150
70-80 13 75 975 90 5625 73125
80-90 6 85 510 96 7225 43350
90-100 4 95 380 100 9025 36100
Total 100 5030 308100
Mean=∑ mf
∑ f
Median=L+(n/2)−cfb
fm ∗W
Mode=L+ f m−f m−1
( f m−f m−1 ) +( f m−f m +1)∗W
Value of mean, mode and median:
Mean 50.3
6 | P a g e
⊘ This is a preview!⊘
Do you want full access?
Subscribe today to unlock all pages.
Trusted by 1+ million students worldwide
Median 68
Mode 55
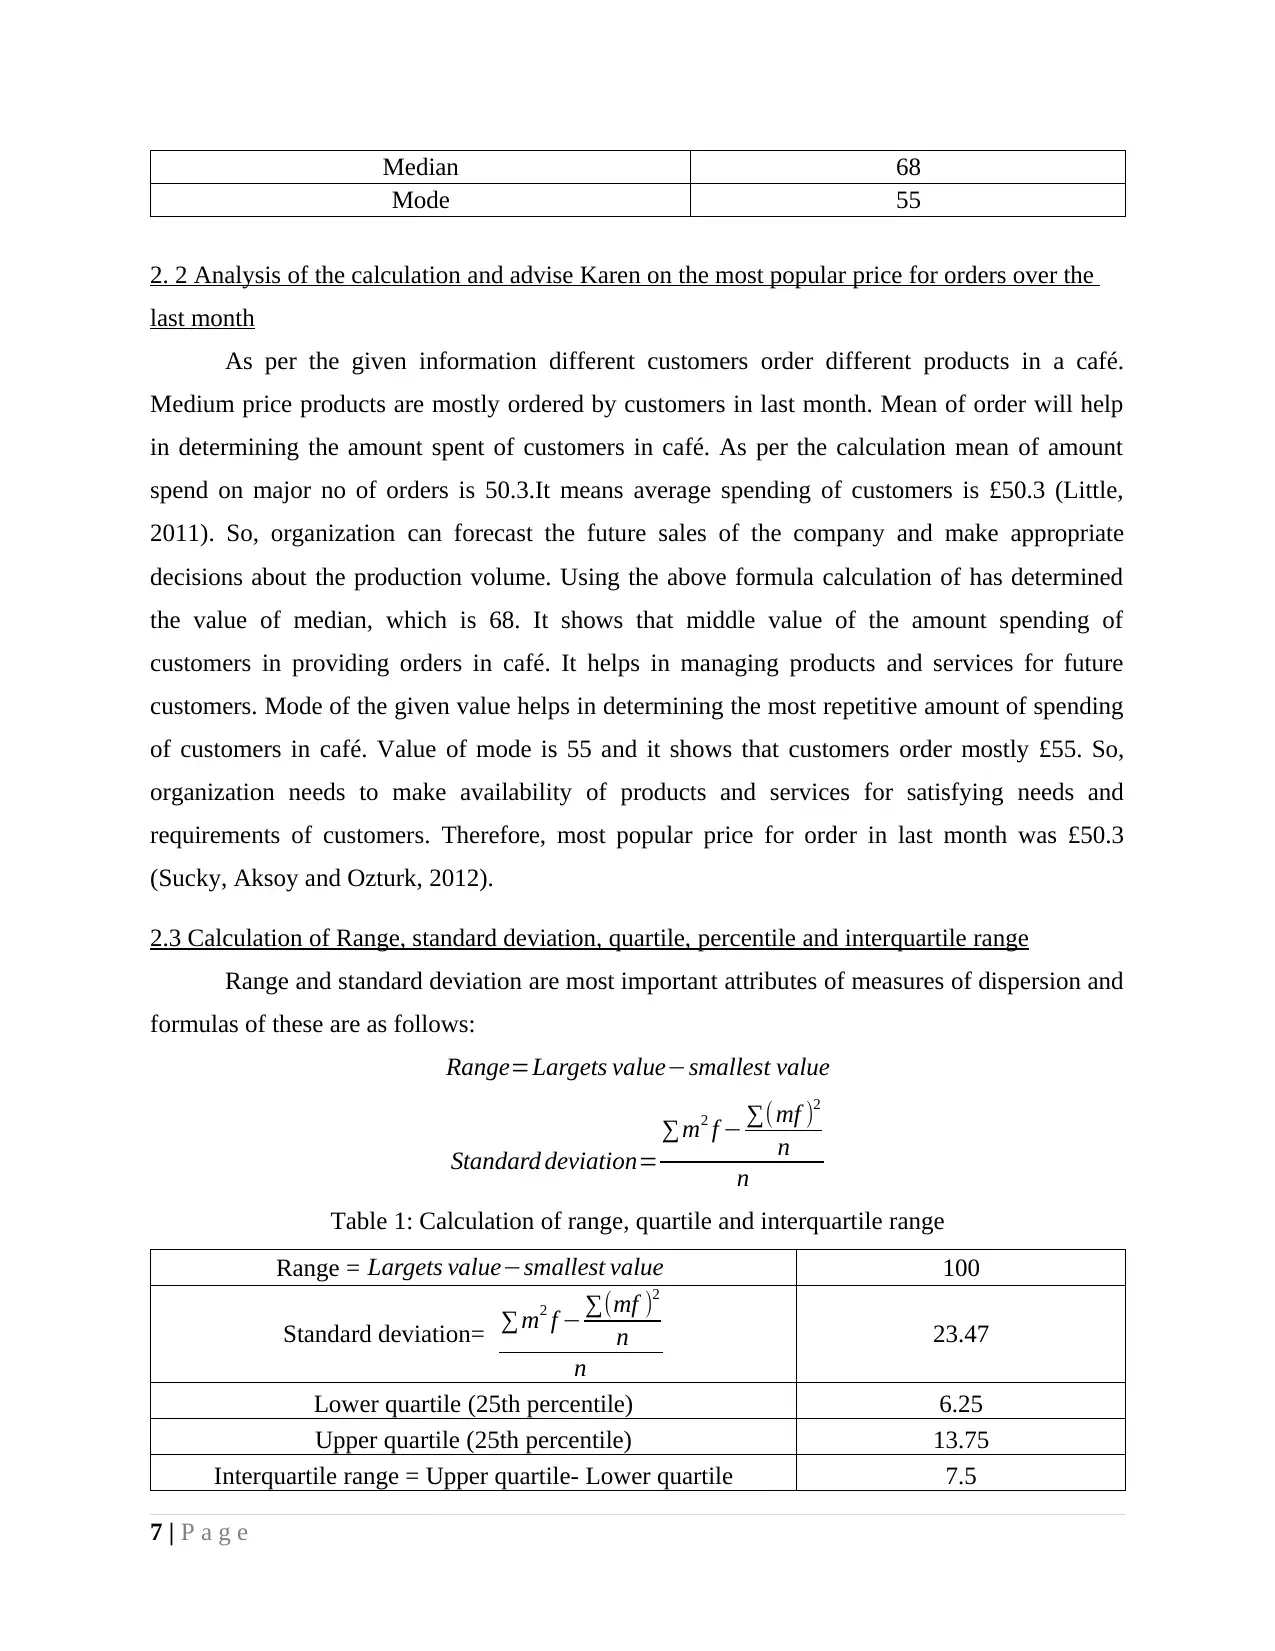
2. 2 Analysis of the calculation and advise Karen on the most popular price for orders over the
last month
As per the given information different customers order different products in a café.
Medium price products are mostly ordered by customers in last month. Mean of order will help
in determining the amount spent of customers in café. As per the calculation mean of amount
spend on major no of orders is 50.3.It means average spending of customers is £50.3 (Little,
2011). So, organization can forecast the future sales of the company and make appropriate
decisions about the production volume. Using the above formula calculation of has determined
the value of median, which is 68. It shows that middle value of the amount spending of
customers in providing orders in café. It helps in managing products and services for future
customers. Mode of the given value helps in determining the most repetitive amount of spending
of customers in café. Value of mode is 55 and it shows that customers order mostly £55. So,
organization needs to make availability of products and services for satisfying needs and
requirements of customers. Therefore, most popular price for order in last month was £50.3
(Sucky, Aksoy and Ozturk, 2012).
2.3 Calculation of Range, standard deviation, quartile, percentile and interquartile range
Range and standard deviation are most important attributes of measures of dispersion and
formulas of these are as follows:
Range=Largets value−smallest value
Standard deviation=
∑m2 f − ∑(mf )2
n
n
Table 1: Calculation of range, quartile and interquartile range
Range = Largets value−smallest value 100
Standard deviation= ∑ m2 f − ∑(mf )2
n
n
23.47
Lower quartile (25th percentile) 6.25
Upper quartile (25th percentile) 13.75
Interquartile range = Upper quartile- Lower quartile 7.5
7 | P a g e
Mode 55
2. 2 Analysis of the calculation and advise Karen on the most popular price for orders over the
last month
As per the given information different customers order different products in a café.
Medium price products are mostly ordered by customers in last month. Mean of order will help
in determining the amount spent of customers in café. As per the calculation mean of amount
spend on major no of orders is 50.3.It means average spending of customers is £50.3 (Little,
2011). So, organization can forecast the future sales of the company and make appropriate
decisions about the production volume. Using the above formula calculation of has determined
the value of median, which is 68. It shows that middle value of the amount spending of
customers in providing orders in café. It helps in managing products and services for future
customers. Mode of the given value helps in determining the most repetitive amount of spending
of customers in café. Value of mode is 55 and it shows that customers order mostly £55. So,
organization needs to make availability of products and services for satisfying needs and
requirements of customers. Therefore, most popular price for order in last month was £50.3
(Sucky, Aksoy and Ozturk, 2012).
2.3 Calculation of Range, standard deviation, quartile, percentile and interquartile range
Range and standard deviation are most important attributes of measures of dispersion and
formulas of these are as follows:
Range=Largets value−smallest value
Standard deviation=
∑m2 f − ∑(mf )2
n
n
Table 1: Calculation of range, quartile and interquartile range
Range = Largets value−smallest value 100
Standard deviation= ∑ m2 f − ∑(mf )2
n
n
23.47
Lower quartile (25th percentile) 6.25
Upper quartile (25th percentile) 13.75
Interquartile range = Upper quartile- Lower quartile 7.5
7 | P a g e
Paraphrase This Document
Need a fresh take? Get an instant paraphrase of this document with our AI Paraphraser
As per the calculation of the range and standard deviation range of the given data is 100
and standard deviation is 23.47. Range helps in determining the largest amount of appending of
customers on their orders in café. It helps in managing business operations in effective manner.
As per the calculation £100 is the largest amount of range which shows that customers can spend
this amount in café for their requirements. On the other hand, standard deviation helps in
determining the associated risk of the business organization. According to the above calculation
value of SD is 23.47. It has reflected that mean of the given data can be vary by 23.47 pound
(Greasley, 2007). It means, average spending of customers on orders of café can be increased or
decreased by 23.47 pound. So, organization needs to assure about the appropriate management of
orders and services. It helps in estimate the risk of wastage or extra stock of the organization.
Along with this, it also helps in reducing the unnecessary cost of Café. According to the
calculation table lower quartile is 6.25 and value of upper quartile is 13.75 and interquartile is
7.5. Lower quartile has reflected that in total no of orders 25% are below 6.25 orders. On the
other hand, upper quartile has shown that 75% are below 13.75. It means 25% orders are higher
than 13,375 orders. Therefore, company should focus on interquartile range at the time of
forecasting sales figures for the coming month (Wallnöfer and Hacklin, 2012).
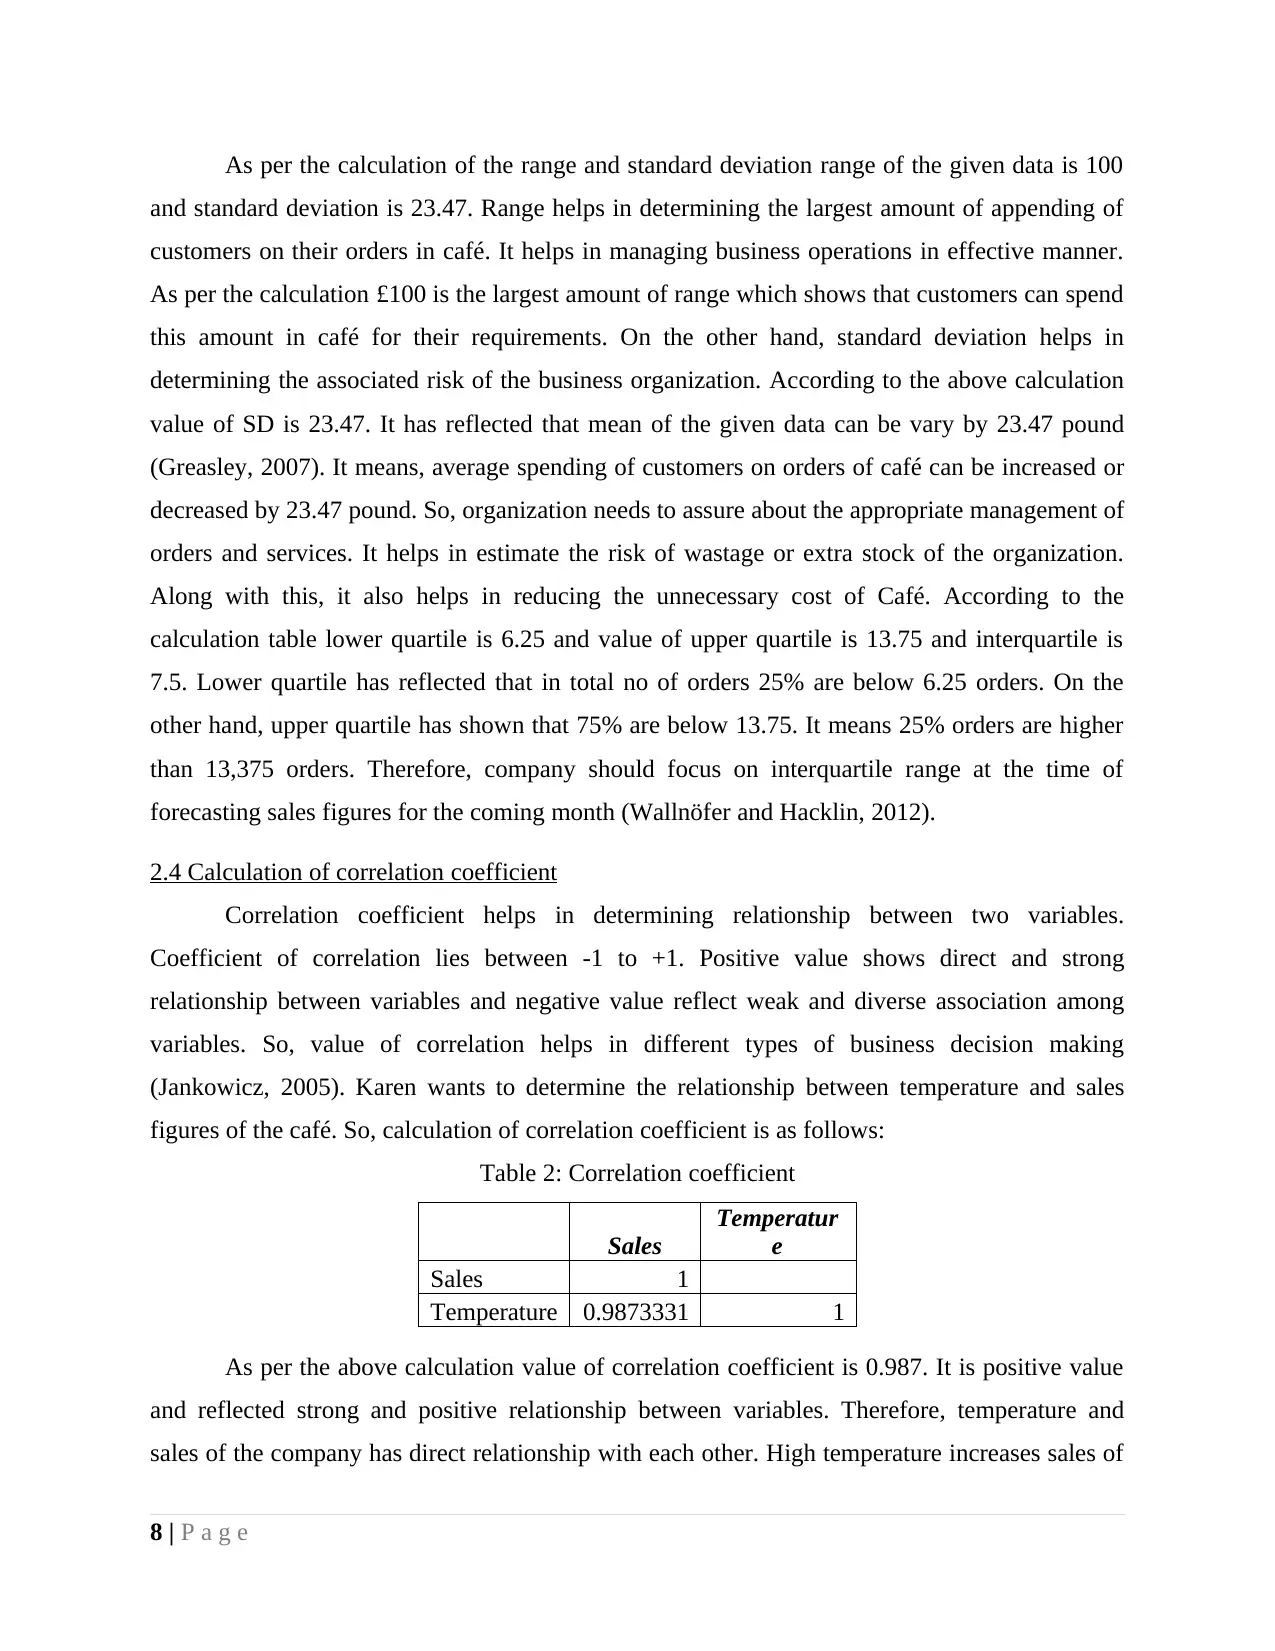
2.4 Calculation of correlation coefficient
Correlation coefficient helps in determining relationship between two variables.
Coefficient of correlation lies between -1 to +1. Positive value shows direct and strong
relationship between variables and negative value reflect weak and diverse association among
variables. So, value of correlation helps in different types of business decision making
(Jankowicz, 2005). Karen wants to determine the relationship between temperature and sales
figures of the café. So, calculation of correlation coefficient is as follows:
Table 2: Correlation coefficient
Sales
Temperatur
e
Sales 1
Temperature 0.9873331 1
As per the above calculation value of correlation coefficient is 0.987. It is positive value
and reflected strong and positive relationship between variables. Therefore, temperature and
sales of the company has direct relationship with each other. High temperature increases sales of
8 | P a g e
and standard deviation is 23.47. Range helps in determining the largest amount of appending of
customers on their orders in café. It helps in managing business operations in effective manner.
As per the calculation £100 is the largest amount of range which shows that customers can spend
this amount in café for their requirements. On the other hand, standard deviation helps in
determining the associated risk of the business organization. According to the above calculation
value of SD is 23.47. It has reflected that mean of the given data can be vary by 23.47 pound
(Greasley, 2007). It means, average spending of customers on orders of café can be increased or
decreased by 23.47 pound. So, organization needs to assure about the appropriate management of
orders and services. It helps in estimate the risk of wastage or extra stock of the organization.
Along with this, it also helps in reducing the unnecessary cost of Café. According to the
calculation table lower quartile is 6.25 and value of upper quartile is 13.75 and interquartile is
7.5. Lower quartile has reflected that in total no of orders 25% are below 6.25 orders. On the
other hand, upper quartile has shown that 75% are below 13.75. It means 25% orders are higher
than 13,375 orders. Therefore, company should focus on interquartile range at the time of
forecasting sales figures for the coming month (Wallnöfer and Hacklin, 2012).
2.4 Calculation of correlation coefficient
Correlation coefficient helps in determining relationship between two variables.
Coefficient of correlation lies between -1 to +1. Positive value shows direct and strong
relationship between variables and negative value reflect weak and diverse association among
variables. So, value of correlation helps in different types of business decision making
(Jankowicz, 2005). Karen wants to determine the relationship between temperature and sales
figures of the café. So, calculation of correlation coefficient is as follows:
Table 2: Correlation coefficient
Sales
Temperatur
e
Sales 1
Temperature 0.9873331 1
As per the above calculation value of correlation coefficient is 0.987. It is positive value
and reflected strong and positive relationship between variables. Therefore, temperature and
sales of the company has direct relationship with each other. High temperature increases sales of
8 | P a g e
the organization and low temperature declines sales figures of café. So, Karen can take various
decisions as per the day temperature. High temperature leads high demand of customers (Akpolat
and Pitinanondha, 2009).
TASK 3
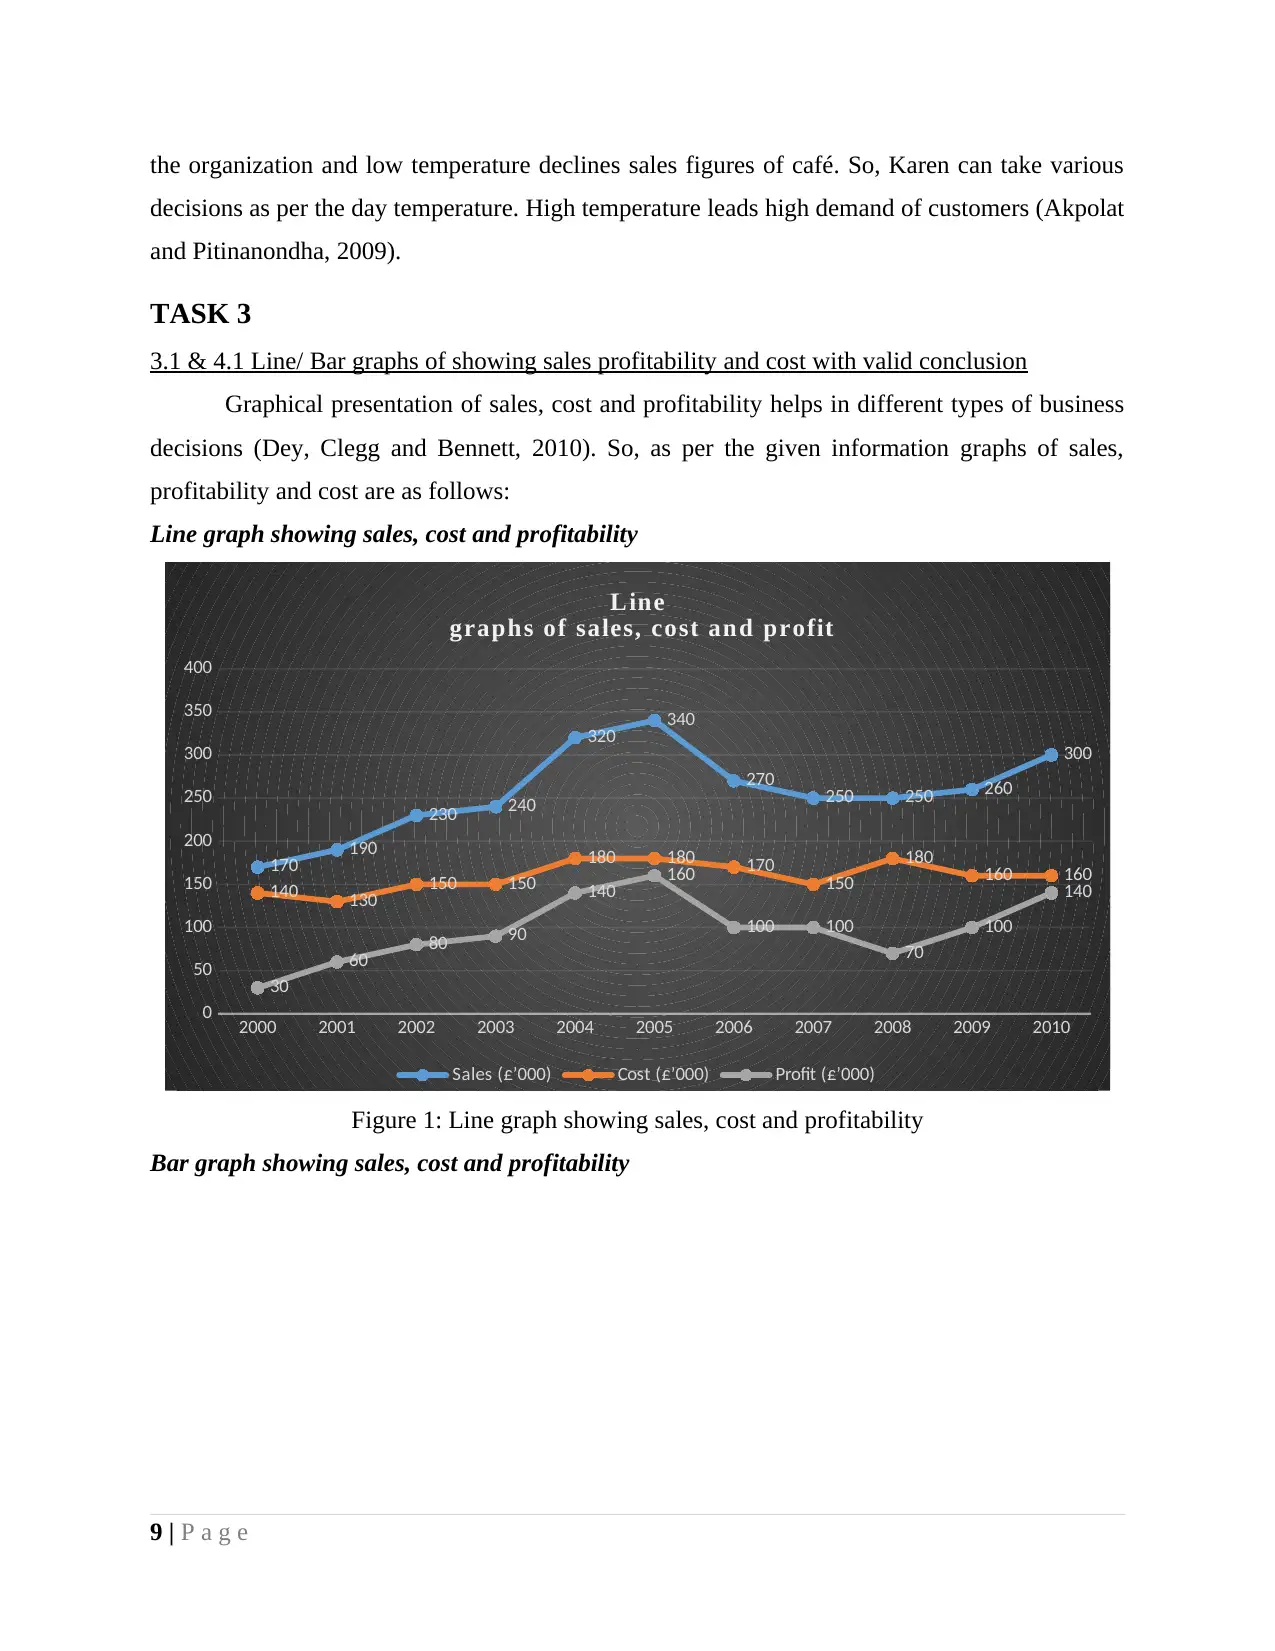
3.1 & 4.1 Line/ Bar graphs of showing sales profitability and cost with valid conclusion
Graphical presentation of sales, cost and profitability helps in different types of business
decisions (Dey, Clegg and Bennett, 2010). So, as per the given information graphs of sales,
profitability and cost are as follows:
Line graph showing sales, cost and profitability
2000 2001 2002 2003 2004 2005 2006 2007 2008 2009 2010
0
50
100
150
200
250
300
350
400
170 190
230 240
320 340
270 250 250 260
300
140 130 150 150
180 180 170 150
180 160 160
30
60 80 90
140 160
100 100
70
100
140
Line
graphs of sales, cost and profit
Sales (£’000) Cost (£’000) Profit (£’000)
Figure 1: Line graph showing sales, cost and profitability
Bar graph showing sales, cost and profitability
9 | P a g e
decisions as per the day temperature. High temperature leads high demand of customers (Akpolat
and Pitinanondha, 2009).
TASK 3
3.1 & 4.1 Line/ Bar graphs of showing sales profitability and cost with valid conclusion
Graphical presentation of sales, cost and profitability helps in different types of business
decisions (Dey, Clegg and Bennett, 2010). So, as per the given information graphs of sales,
profitability and cost are as follows:
Line graph showing sales, cost and profitability
2000 2001 2002 2003 2004 2005 2006 2007 2008 2009 2010
0
50
100
150
200
250
300
350
400
170 190
230 240
320 340
270 250 250 260
300
140 130 150 150
180 180 170 150
180 160 160
30
60 80 90
140 160
100 100
70
100
140
Line
graphs of sales, cost and profit
Sales (£’000) Cost (£’000) Profit (£’000)
Figure 1: Line graph showing sales, cost and profitability
Bar graph showing sales, cost and profitability
9 | P a g e
⊘ This is a preview!⊘
Do you want full access?
Subscribe today to unlock all pages.
Trusted by 1+ million students worldwide
2000
2001
2002
2003
2004
2005
2006
2007
2008
2009
2010
0 50 100 150 200 250 300 350 400
170
190
230
240
320
340
270
250
250
260
300
140
130
150
150
180
180
170
150
180
160
160
30
60
80
90
140
160
100
100
70
100
140
Bar graphs of sales, cost and profit
Profit (£’000) Cost (£’000) Sales (£’000)
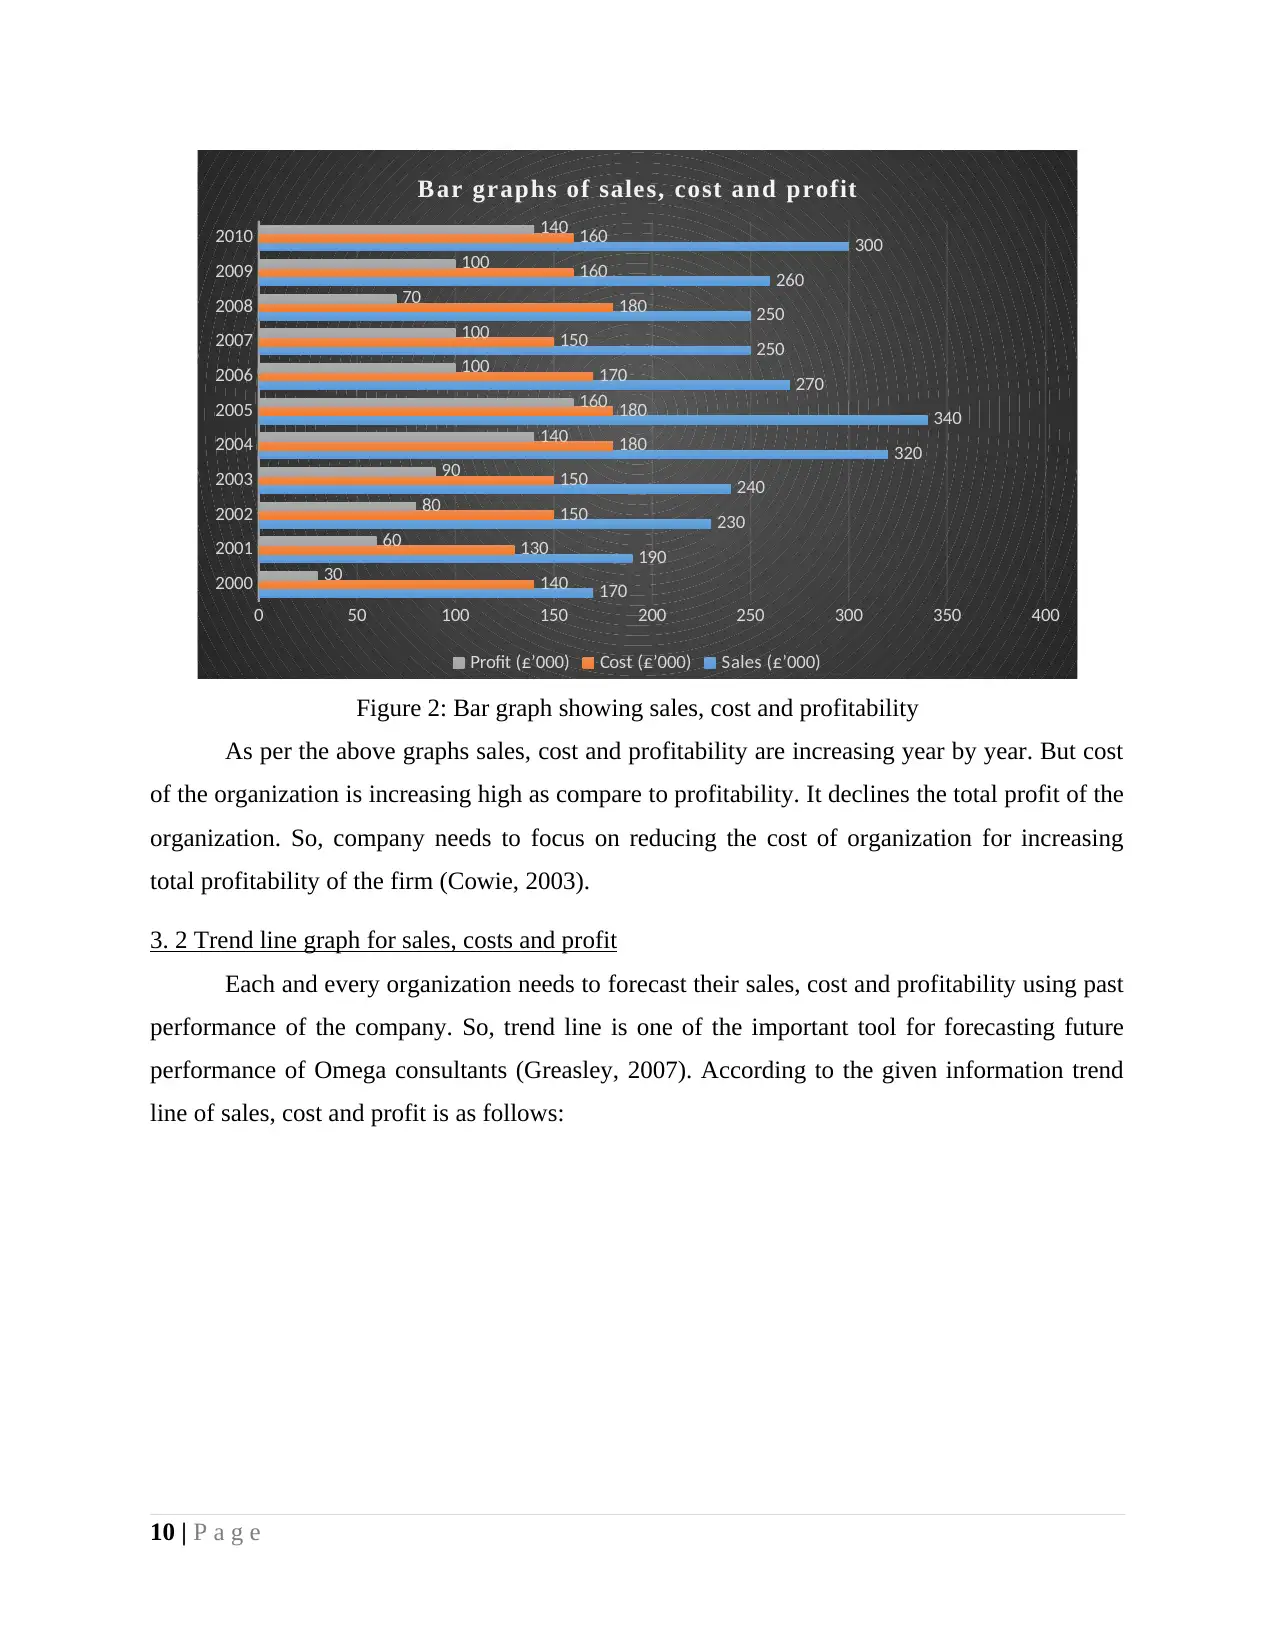
Figure 2: Bar graph showing sales, cost and profitability
As per the above graphs sales, cost and profitability are increasing year by year. But cost
of the organization is increasing high as compare to profitability. It declines the total profit of the
organization. So, company needs to focus on reducing the cost of organization for increasing
total profitability of the firm (Cowie, 2003).
3. 2 Trend line graph for sales, costs and profit
Each and every organization needs to forecast their sales, cost and profitability using past
performance of the company. So, trend line is one of the important tool for forecasting future
performance of Omega consultants (Greasley, 2007). According to the given information trend
line of sales, cost and profit is as follows:
10 | P a g e
2001
2002
2003
2004
2005
2006
2007
2008
2009
2010
0 50 100 150 200 250 300 350 400
170
190
230
240
320
340
270
250
250
260
300
140
130
150
150
180
180
170
150
180
160
160
30
60
80
90
140
160
100
100
70
100
140
Bar graphs of sales, cost and profit
Profit (£’000) Cost (£’000) Sales (£’000)
Figure 2: Bar graph showing sales, cost and profitability
As per the above graphs sales, cost and profitability are increasing year by year. But cost
of the organization is increasing high as compare to profitability. It declines the total profit of the
organization. So, company needs to focus on reducing the cost of organization for increasing
total profitability of the firm (Cowie, 2003).
3. 2 Trend line graph for sales, costs and profit
Each and every organization needs to forecast their sales, cost and profitability using past
performance of the company. So, trend line is one of the important tool for forecasting future
performance of Omega consultants (Greasley, 2007). According to the given information trend
line of sales, cost and profit is as follows:
10 | P a g e
Paraphrase This Document
Need a fresh take? Get an instant paraphrase of this document with our AI Paraphraser
2000 2001 2002 2003 2004 2005 2006 2007 2008 2009 2010 2011 2012 2013 2014 2015
0
50
100
150
200
250
300
350
400
f(x) = 8.72727272727273 x + 204
R² = 0.321563154221912
f(x) = 2.72727272727273 x + 142.727272727273
R² = 0.283018867924528f(x) = 6 x + 61.2727272727273
R² = 0.27089552238806
Trend Line of sales and profit
Sales (£’000) Linear (Sales (£’000)) Cost (£’000)
Linear (Cost (£’000)) Profit (£’000) Linear (Profit (£’000))
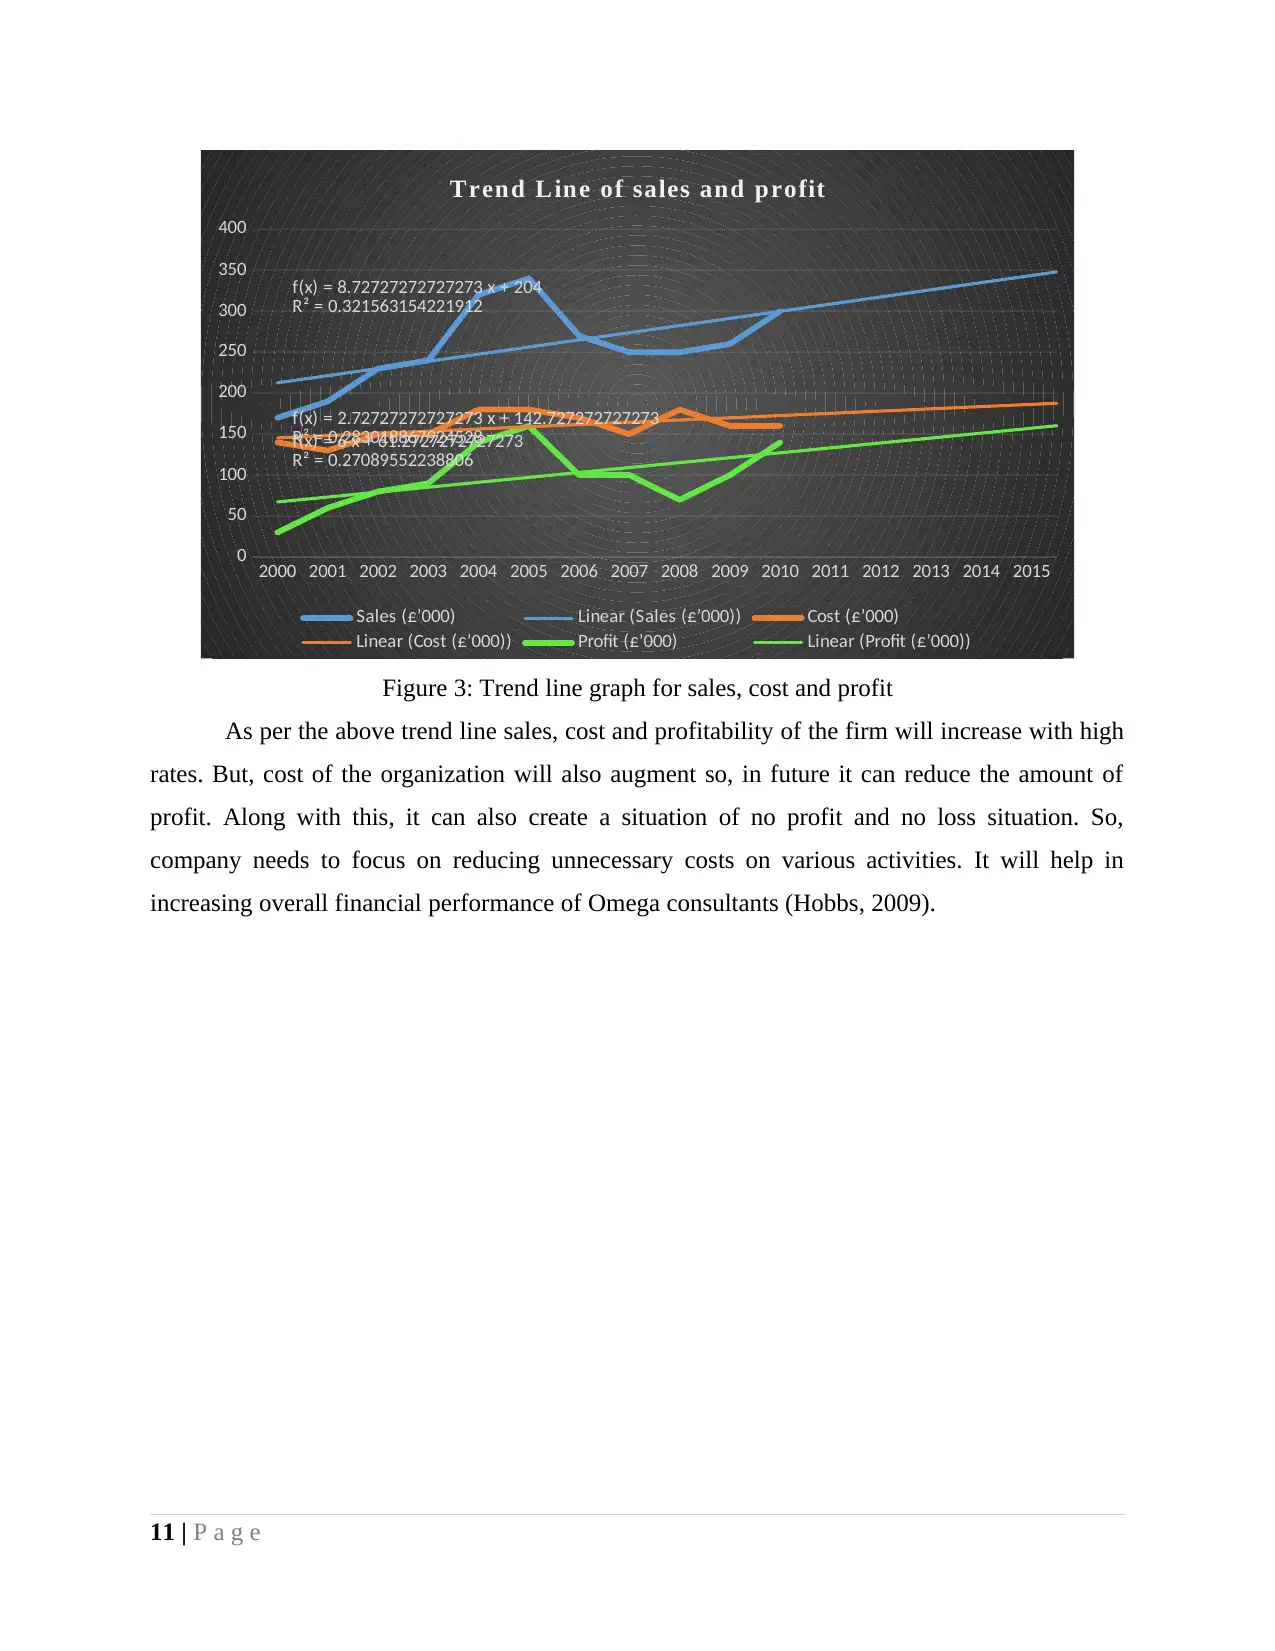
Figure 3: Trend line graph for sales, cost and profit
As per the above trend line sales, cost and profitability of the firm will increase with high
rates. But, cost of the organization will also augment so, in future it can reduce the amount of
profit. Along with this, it can also create a situation of no profit and no loss situation. So,
company needs to focus on reducing unnecessary costs on various activities. It will help in
increasing overall financial performance of Omega consultants (Hobbs, 2009).
11 | P a g e
0
50
100
150
200
250
300
350
400
f(x) = 8.72727272727273 x + 204
R² = 0.321563154221912
f(x) = 2.72727272727273 x + 142.727272727273
R² = 0.283018867924528f(x) = 6 x + 61.2727272727273
R² = 0.27089552238806
Trend Line of sales and profit
Sales (£’000) Linear (Sales (£’000)) Cost (£’000)
Linear (Cost (£’000)) Profit (£’000) Linear (Profit (£’000))
Figure 3: Trend line graph for sales, cost and profit
As per the above trend line sales, cost and profitability of the firm will increase with high
rates. But, cost of the organization will also augment so, in future it can reduce the amount of
profit. Along with this, it can also create a situation of no profit and no loss situation. So,
company needs to focus on reducing unnecessary costs on various activities. It will help in
increasing overall financial performance of Omega consultants (Hobbs, 2009).
11 | P a g e
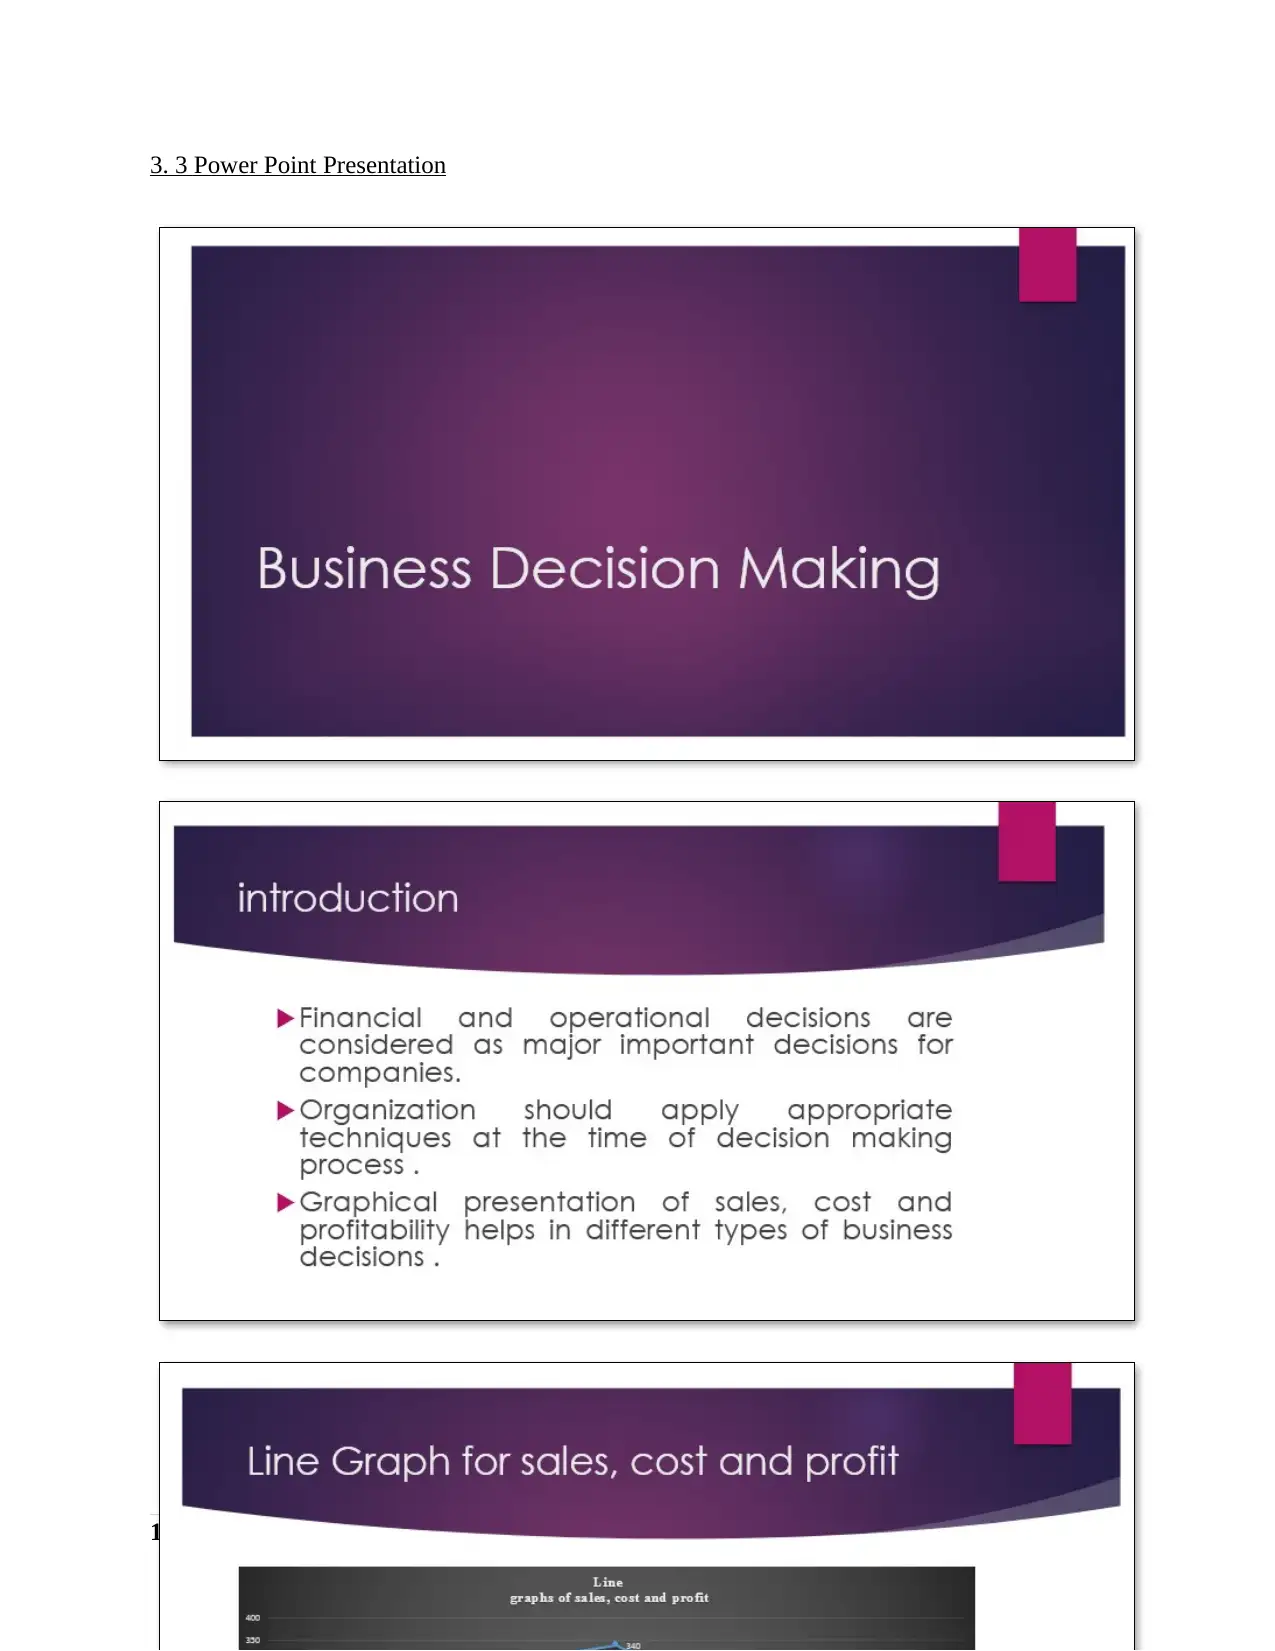
3. 3 Power Point Presentation
12 | P a g e
12 | P a g e
⊘ This is a preview!⊘
Do you want full access?
Subscribe today to unlock all pages.
Trusted by 1+ million students worldwide
1 out of 23
Related Documents


Your All-in-One AI-Powered Toolkit for Academic Success.
+13062052269
info@desklib.com
Available 24*7 on WhatsApp / Email
![[object Object]](/_next/static/media/star-bottom.7253800d.svg)
Unlock your academic potential
Copyright © 2020–2026 A2Z Services. All Rights Reserved. Developed and managed by ZUCOL.