Decision Support Tools Assignment - Analysis, Simulation & Regression

Verified

Added on Ā 2022/11/26

|8
|1132
|500
Homework Assignment
AI Summary
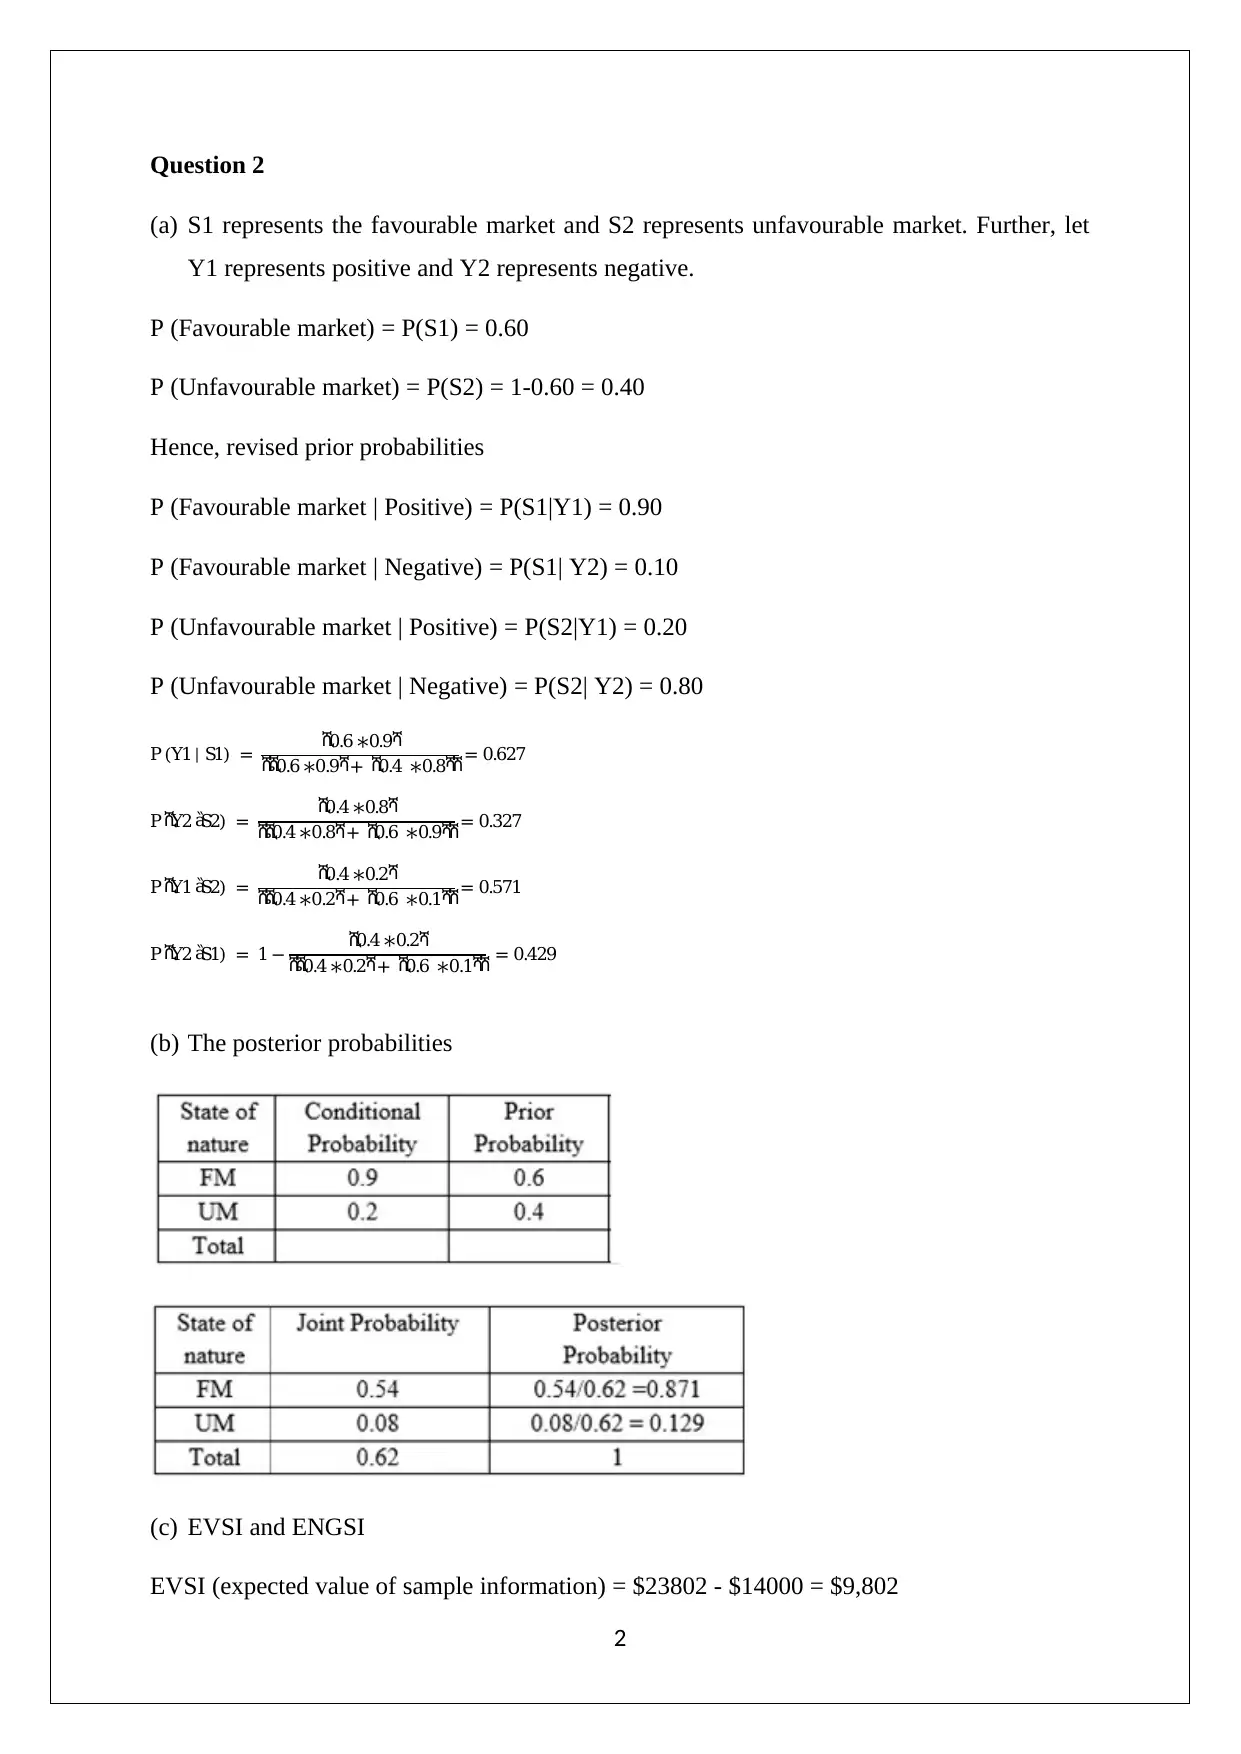
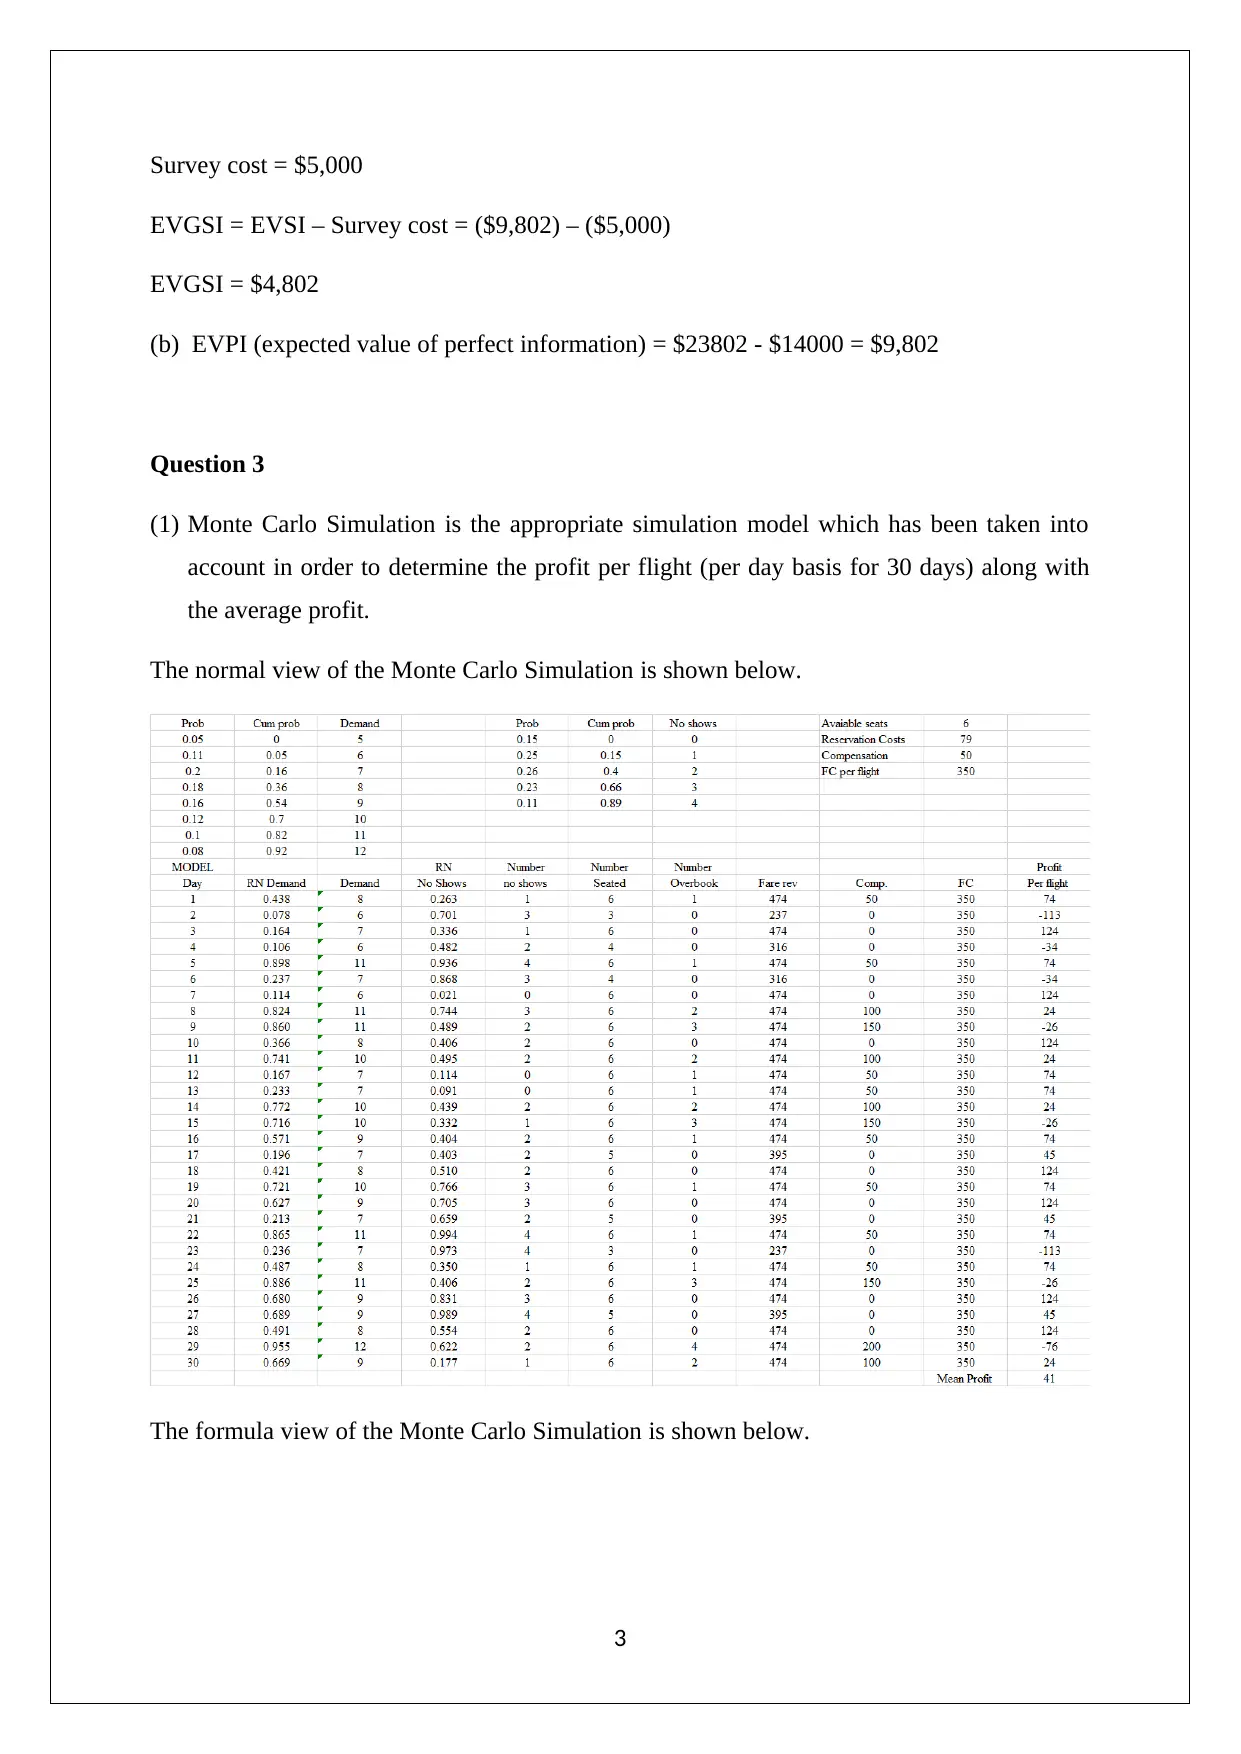
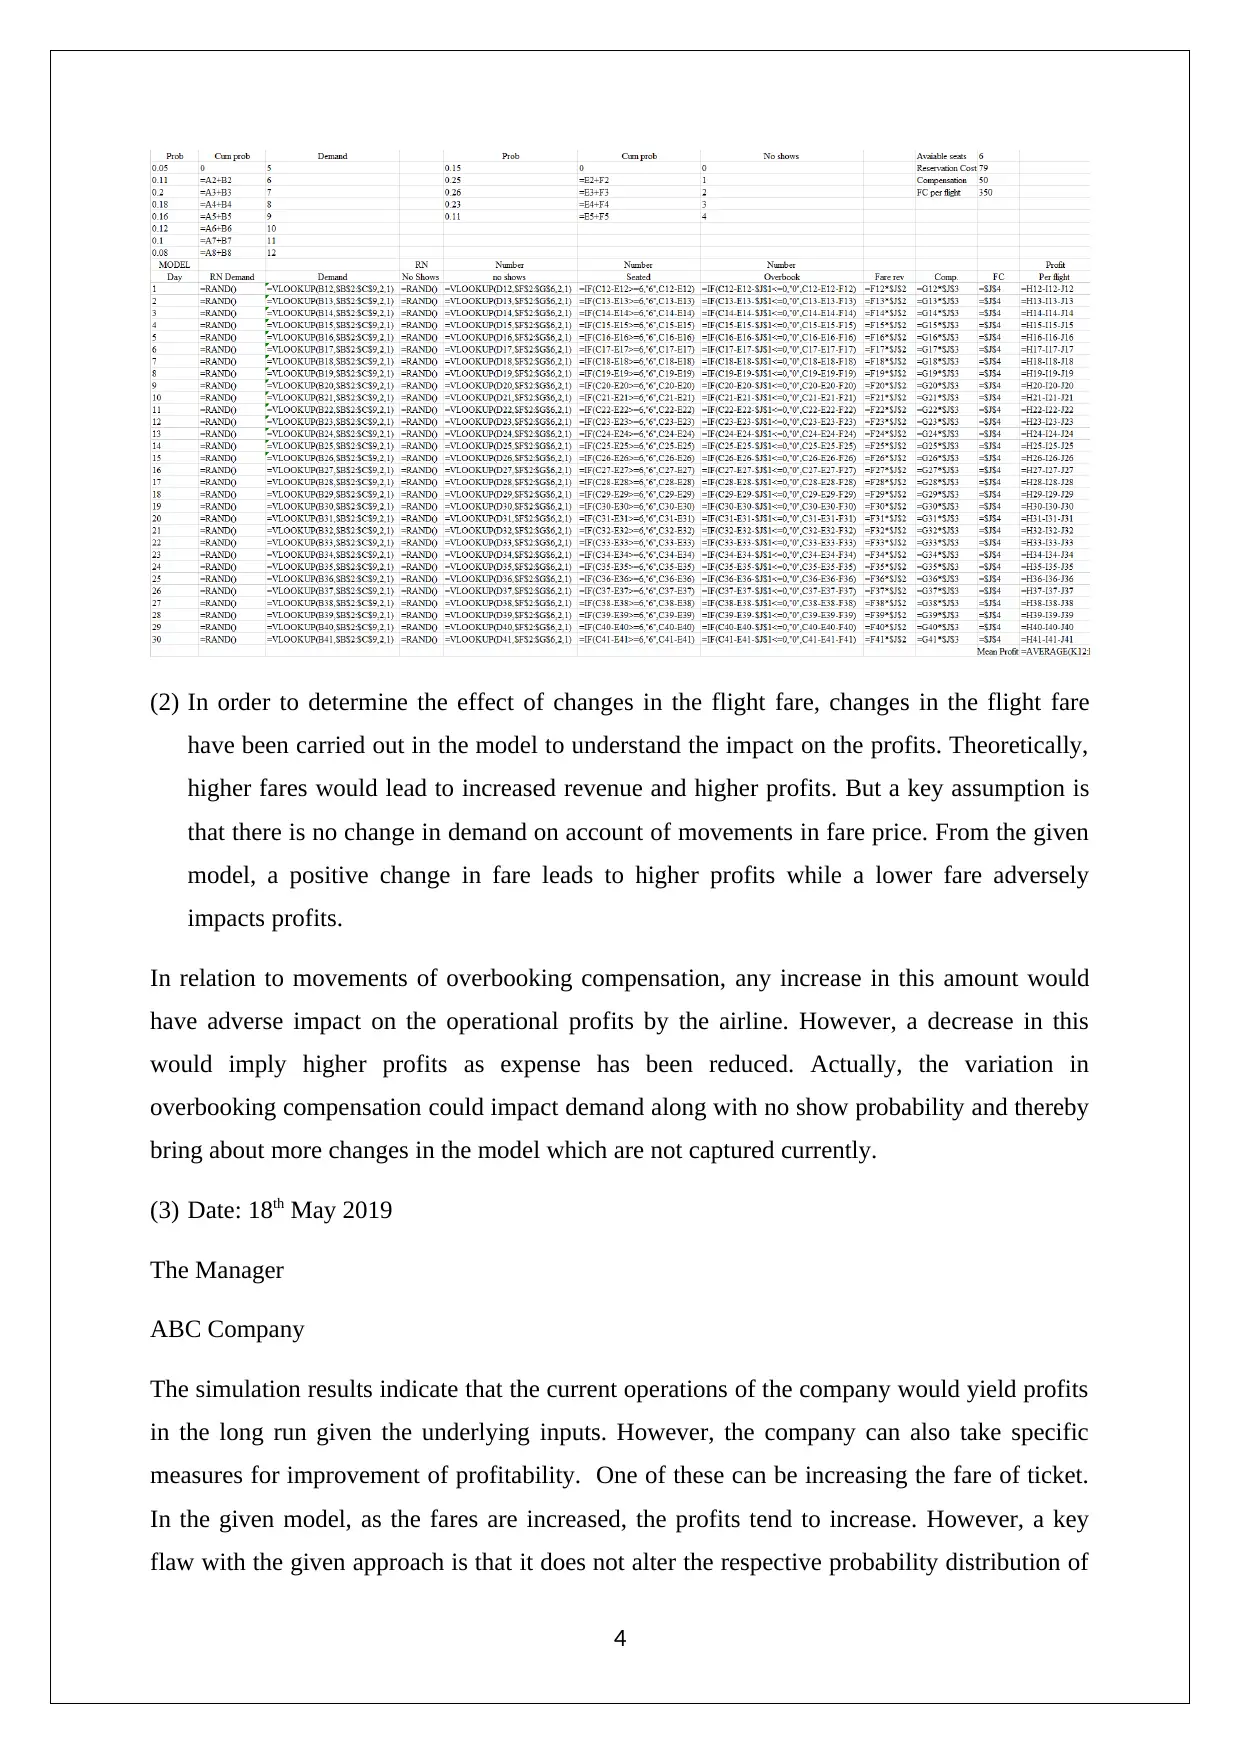
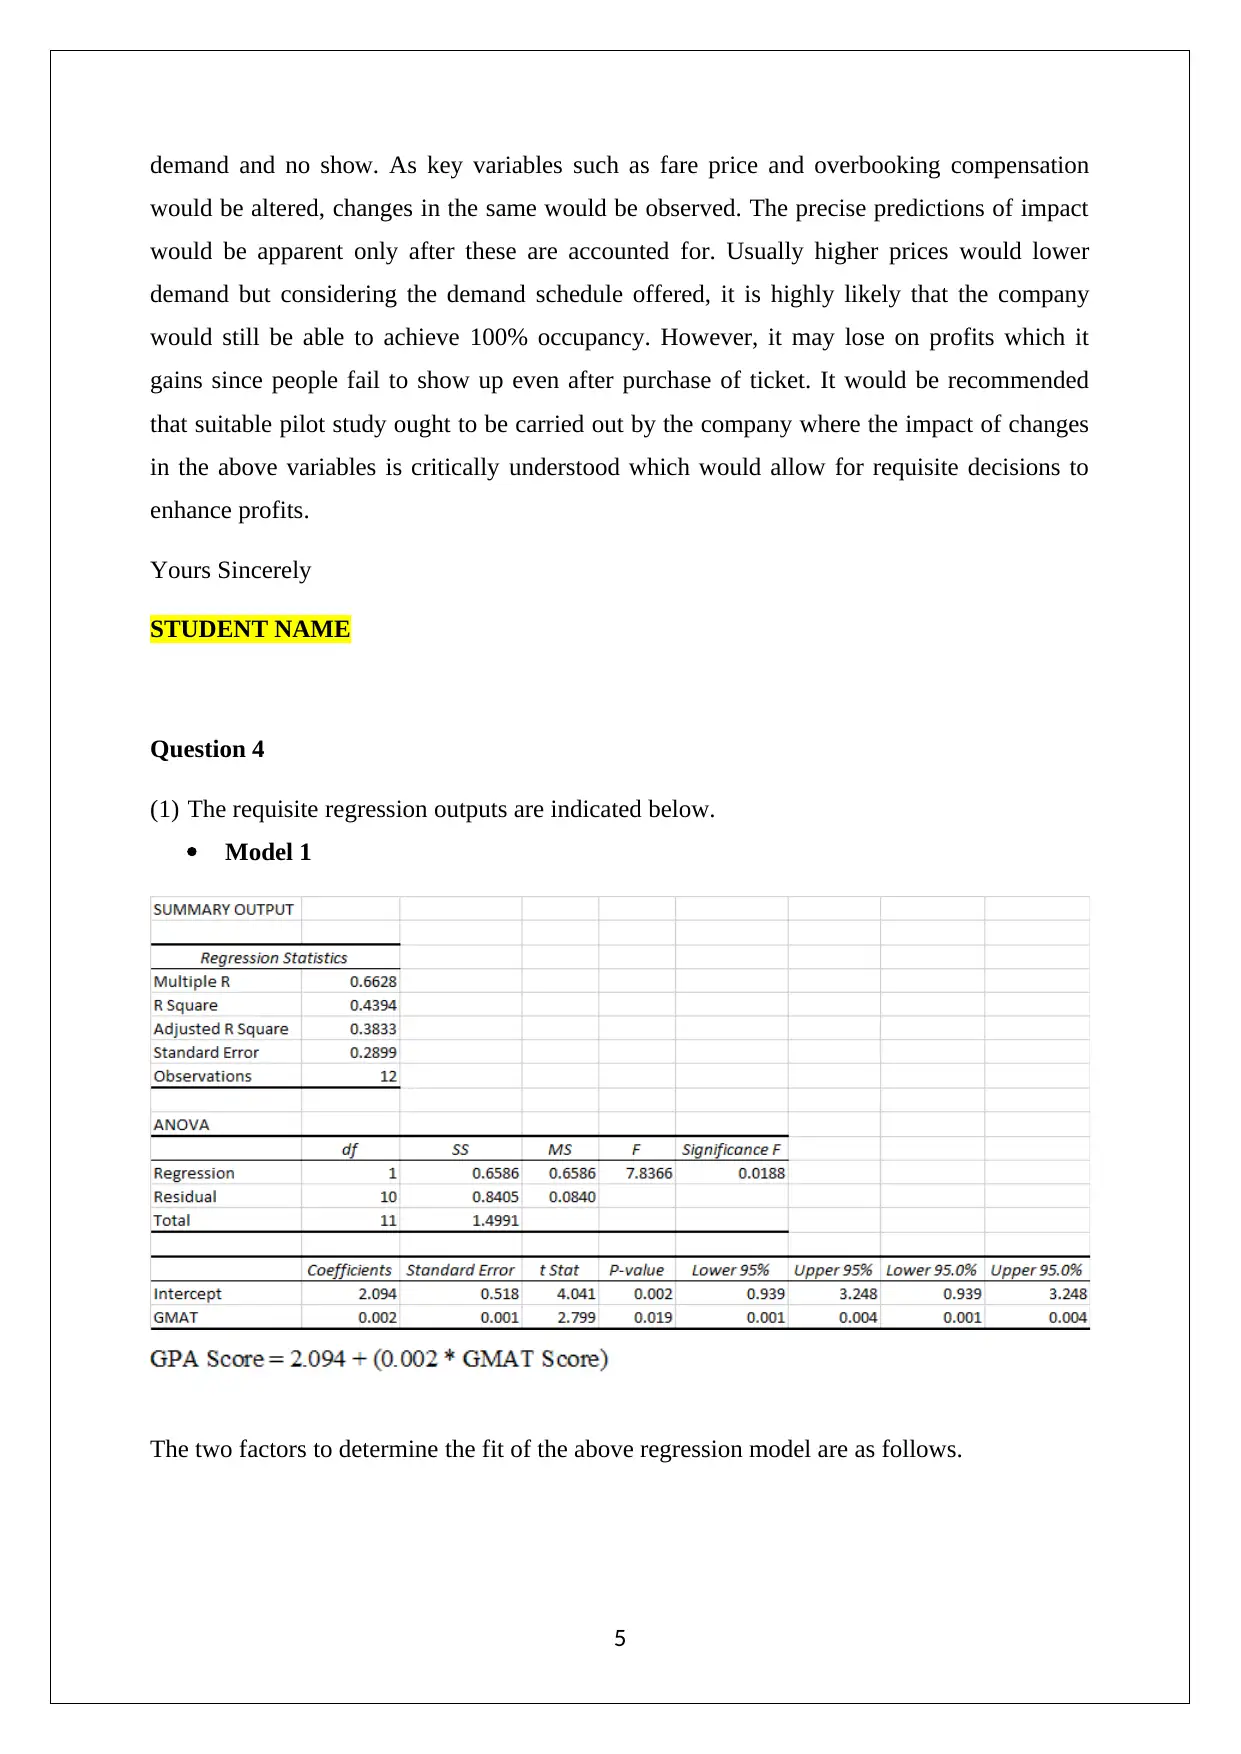
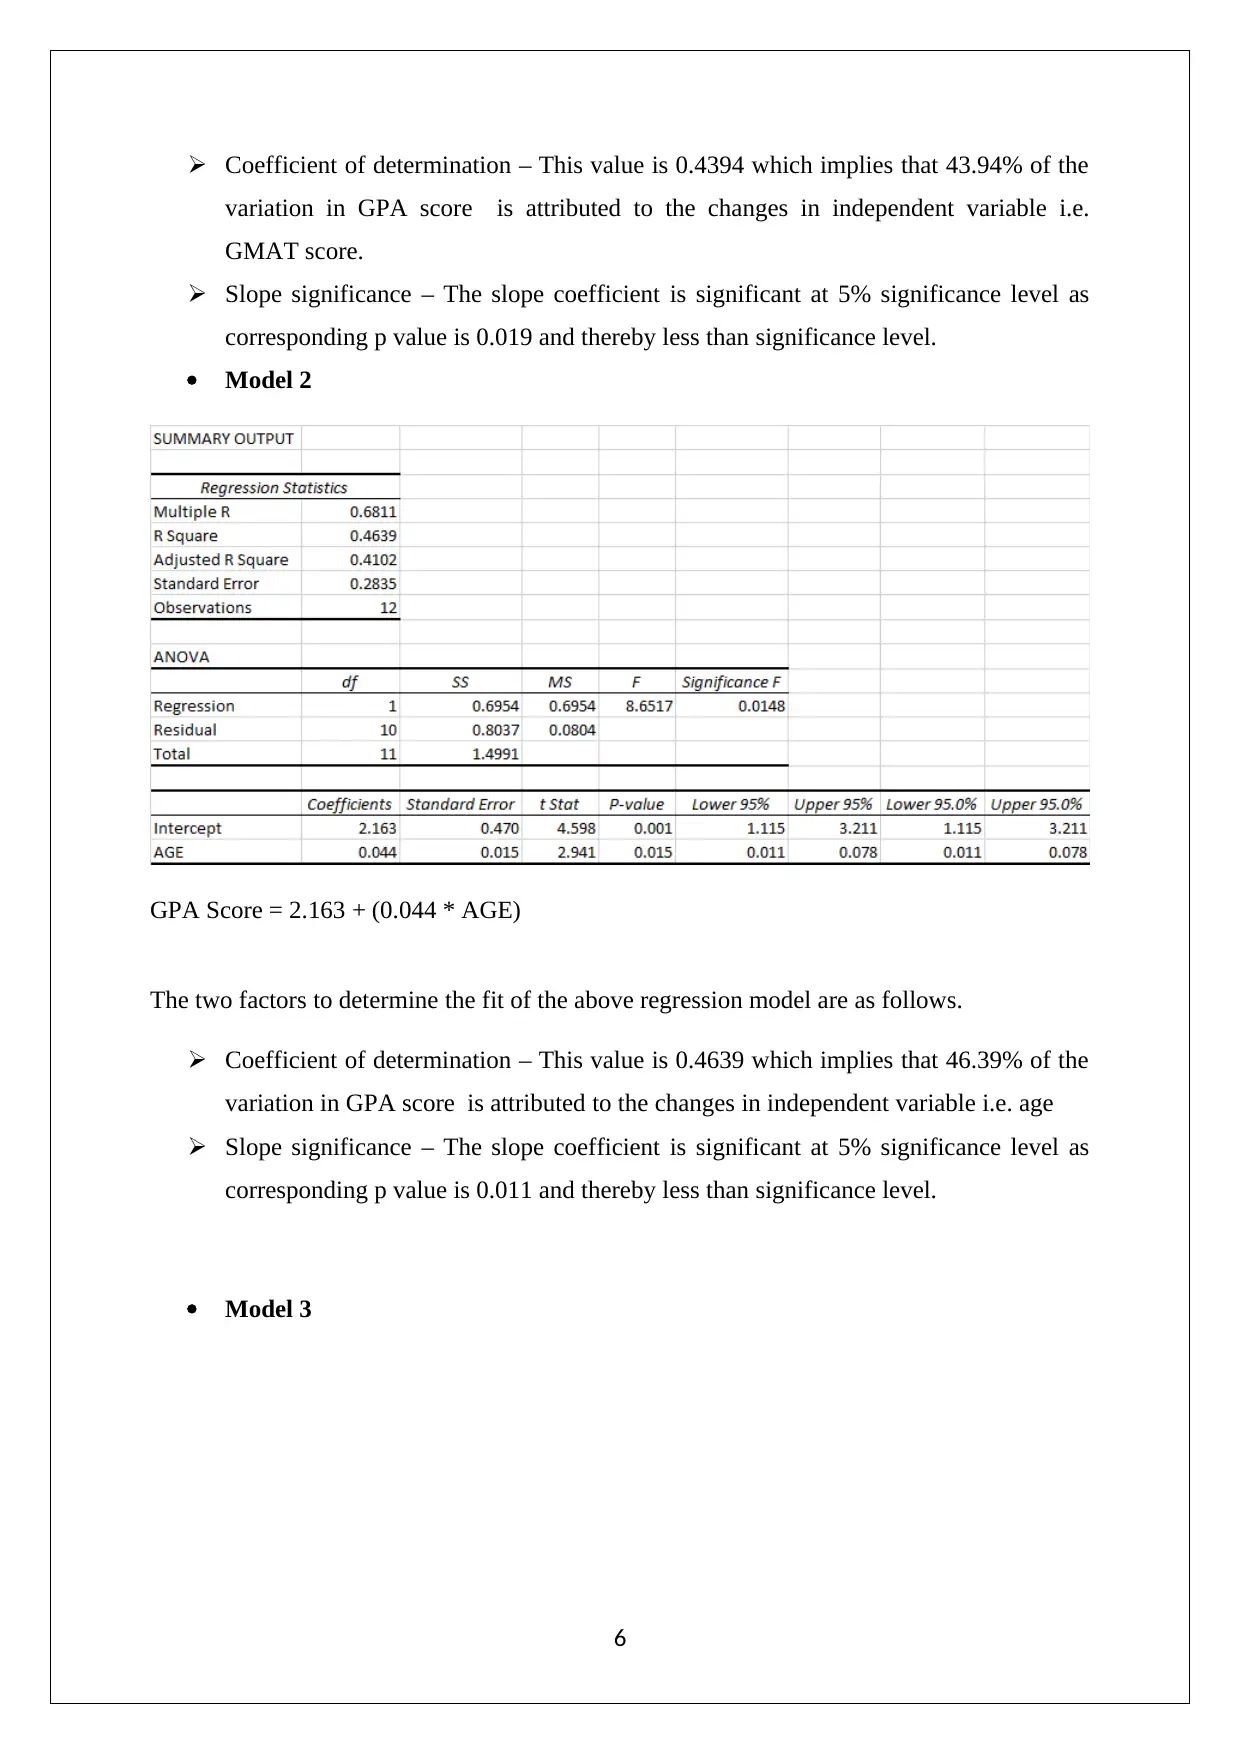
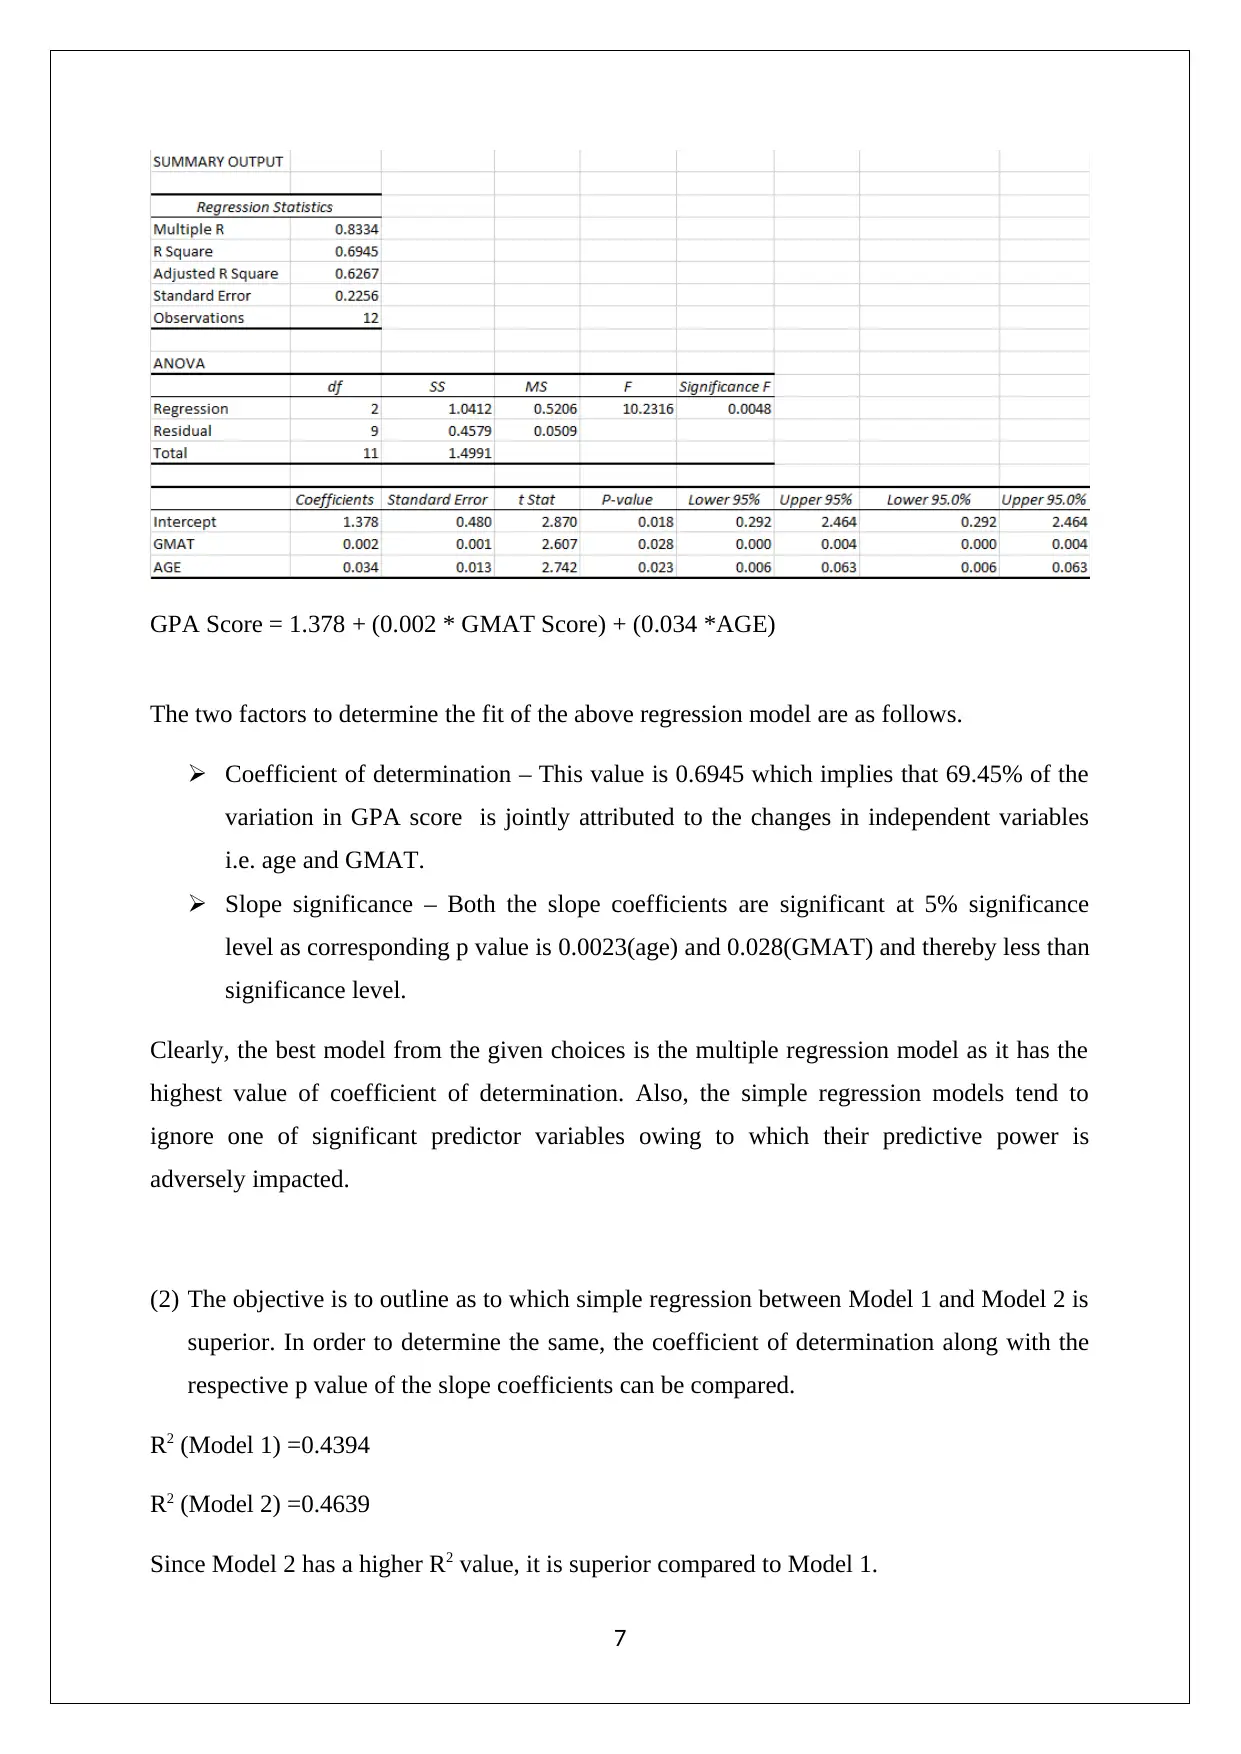
This assignment solution addresses key concepts in decision support tools, encompassing decision analysis, simulation, and regression. The solution begins with an analysis of a decision-making scenario using probabilities and posterior probabilities, including the calculation of EVSI and EVGSI. It then explores Monte Carlo simulation to determine profit per flight, including the impact of fare changes and overbooking compensation. Finally, the assignment concludes with a regression analysis, comparing different models to determine the best fit for predicting GPA scores based on GMAT and age, and providing a prediction based on given inputs. The solution demonstrates a comprehensive understanding of the concepts and their application in business decision-making.
tabler-icon-diamond-filled.svg

Contribute Materials

Your contribution can guide someoneā€™s learning journey. Share your documents today.
Document Page
DECISION SUPPORT TOOLS
STUDENT ID:
[Pick the date]
tabler-icon-diamond-filled.svg

Secure Best Marks with AI Grader

Need help grading? Try our AI Grader for instant feedback on your assignments.
Document Page
Question 2
(a) S1 represents the favourable market and S2 represents unfavourable market. Further, let
Y1 represents positive and Y2 represents negative.
P (Favourable market) = P(S1) = 0.60
P (Unfavourable market) = P(S2) = 1-0.60 = 0.40
Hence, revised prior probabilities
P (Favourable market | Positive) = P(S1|Y1) = 0.90
P (Favourable market | Negative) = P(S1| Y2) = 0.10
P (Unfavourable market | Positive) = P(S2|Y1) = 0.20
P (Unfavourable market | Negative) = P(S2| Y2) = 0.80
P (Y1 | S1) = įˆŗ0.6 āˆ—0.9įˆ»
įˆ¼įˆŗ0.6 āˆ—0.9įˆ»+ įˆŗ0.4 āˆ—0.8įˆ»įˆ½= 0.627
P įˆŗY2 ȁS2) = įˆŗ0.4 āˆ—0.8įˆ»
įˆ¼įˆŗ0.4 āˆ—0.8įˆ»+ įˆŗ0.6 āˆ—0.9įˆ»įˆ½= 0.327
P įˆŗY1 ȁS2) = įˆŗ0.4 āˆ—0.2įˆ»
įˆ¼įˆŗ0.4 āˆ—0.2įˆ»+ įˆŗ0.6 āˆ—0.1įˆ»įˆ½= 0.571
P įˆŗY2 ȁS1) = 1 āˆ’ įˆŗ0.4 āˆ—0.2įˆ»
įˆ¼įˆŗ0.4 āˆ—0.2įˆ»+ įˆŗ0.6 āˆ—0.1įˆ»įˆ½ = 0.429
(b) The posterior probabilities
(c) EVSI and ENGSI
EVSI (expected value of sample information) = $23802 - $14000 = $9,802
2
Document Page
Survey cost = $5,000
EVGSI = EVSI ā€“ Survey cost = ($9,802) ā€“ ($5,000)
EVGSI = $4,802
(b) EVPI (expected value of perfect information) = $23802 - $14000 = $9,802
Question 3
(1) Monte Carlo Simulation is the appropriate simulation model which has been taken into
account in order to determine the profit per flight (per day basis for 30 days) along with
the average profit.
The normal view of the Monte Carlo Simulation is shown below.
The formula view of the Monte Carlo Simulation is shown below.
3
Document Page
(2) In order to determine the effect of changes in the flight fare, changes in the flight fare
have been carried out in the model to understand the impact on the profits. Theoretically,
higher fares would lead to increased revenue and higher profits. But a key assumption is
that there is no change in demand on account of movements in fare price. From the given
model, a positive change in fare leads to higher profits while a lower fare adversely
impacts profits.
In relation to movements of overbooking compensation, any increase in this amount would
have adverse impact on the operational profits by the airline. However, a decrease in this
would imply higher profits as expense has been reduced. Actually, the variation in
overbooking compensation could impact demand along with no show probability and thereby
bring about more changes in the model which are not captured currently.
(3) Date: 18th May 2019
The Manager
ABC Company
The simulation results indicate that the current operations of the company would yield profits
in the long run given the underlying inputs. However, the company can also take specific
measures for improvement of profitability. One of these can be increasing the fare of ticket.
In the given model, as the fares are increased, the profits tend to increase. However, a key
flaw with the given approach is that it does not alter the respective probability distribution of
4
tabler-icon-diamond-filled.svg

Secure Best Marks with AI Grader

Need help grading? Try our AI Grader for instant feedback on your assignments.
Document Page
demand and no show. As key variables such as fare price and overbooking compensation
would be altered, changes in the same would be observed. The precise predictions of impact
would be apparent only after these are accounted for. Usually higher prices would lower
demand but considering the demand schedule offered, it is highly likely that the company
would still be able to achieve 100% occupancy. However, it may lose on profits which it
gains since people fail to show up even after purchase of ticket. It would be recommended
that suitable pilot study ought to be carried out by the company where the impact of changes
in the above variables is critically understood which would allow for requisite decisions to
enhance profits.
Yours Sincerely
STUDENT NAME
Question 4
(1) The requisite regression outputs are indicated below.
ļ‚· Model 1
The two factors to determine the fit of the above regression model are as follows.
5
Document Page
ļƒ˜ Coefficient of determination ā€“ This value is 0.4394 which implies that 43.94% of the
variation in GPA score is attributed to the changes in independent variable i.e.
GMAT score.
ļƒ˜ Slope significance ā€“ The slope coefficient is significant at 5% significance level as
corresponding p value is 0.019 and thereby less than significance level.
ļ‚· Model 2
GPA Score = 2.163 + (0.044 * AGE)
The two factors to determine the fit of the above regression model are as follows.
ļƒ˜ Coefficient of determination ā€“ This value is 0.4639 which implies that 46.39% of the
variation in GPA score is attributed to the changes in independent variable i.e. age
ļƒ˜ Slope significance ā€“ The slope coefficient is significant at 5% significance level as
corresponding p value is 0.011 and thereby less than significance level.
ļ‚· Model 3
6
Document Page
GPA Score = 1.378 + (0.002 * GMAT Score) + (0.034 *AGE)
The two factors to determine the fit of the above regression model are as follows.
ļƒ˜ Coefficient of determination ā€“ This value is 0.6945 which implies that 69.45% of the
variation in GPA score is jointly attributed to the changes in independent variables
i.e. age and GMAT.
ļƒ˜ Slope significance ā€“ Both the slope coefficients are significant at 5% significance
level as corresponding p value is 0.0023(age) and 0.028(GMAT) and thereby less than
significance level.
Clearly, the best model from the given choices is the multiple regression model as it has the
highest value of coefficient of determination. Also, the simple regression models tend to
ignore one of significant predictor variables owing to which their predictive power is
adversely impacted.
(2) The objective is to outline as to which simple regression between Model 1 and Model 2 is
superior. In order to determine the same, the coefficient of determination along with the
respective p value of the slope coefficients can be compared.
R2 (Model 1) =0.4394
R2 (Model 2) =0.4639
Since Model 2 has a higher R2 value, it is superior compared to Model 1.
7
tabler-icon-diamond-filled.svg

Paraphrase This Document

Need a fresh take? Get an instant paraphrase of this document with our AI Paraphraser
Document Page
P value of slope coefficient (Model 1) = 0.019
P value of slope coefficient (Model 2) = 0.015
Since p value is lower for Model 2, it would imply that Model 2 is superior.
One potential issue in choosing the superior model here is that Model 2 excludes GMAT as a
predictor variable which is also significant although the level of significance is marginally
lower than age as a predictor variable.
(3) Prediction of GPA Score
AGE is given as 29 years and GMAT Score is given as 600.
Applicable model is regression model 3.
GPA Score = 1.378 + (0.002 * GMAT Score) + (0.034 *AGE)
GPA Score = 1.378 + (0.002 * 600) + (0.034 *29) = 3.512
Hence, the GPA score for the provided inputs would be 3.512.
8
chevron_up_icon
1 out of 8
circle_padding
hide_on_mobile
zoom_out_icon
logo.png

Your All-in-One AI-Powered Toolkit for Academic Success.

Available 24*7 on WhatsApp / Email

[object Object]