Comprehensive Business Decision Making Report: UKCBC College Analysis
VerifiedAdded on 2020/07/22
|32
|6210
|420
Report
AI Summary
This report provides a comprehensive analysis of business decision-making processes, specifically focusing on student experiences and perceptions at UKCBC College. The study encompasses various stages, beginning with data collection through primary and secondary sources, including the design and distribution of questionnaires to a sample of 60 students across five campuses. The research employs diverse methodologies, including primary data collection via questionnaires and secondary data from college records. The report delves into the statistical analysis of the collected data, calculating measures of central tendency such as mean, median, and mode, and using these to draw conclusions about student satisfaction. Data is presented through charts, graphs, and trend lines to visualize findings. Furthermore, the report includes a formal analysis of the research findings, along with a discussion of financial tools and critical path analysis to aid decision-making processes within the college. The conclusion summarizes the key insights and implications of the research, offering recommendations for improvement and strategic planning.
BUSINESS DECISION
MAKING
MAKING
Paraphrase This Document
Need a fresh take? Get an instant paraphrase of this document with our AI Paraphraser

Table of Contents
INTRODUCTION...........................................................................................................................1
TASK 1............................................................................................................................................1
1.1 Data collection through different sources.........................................................................1
1.2 Research methodologies and sampling framework used in the research ........................2
1.3 Design a questionnaire from collected information.........................................................3
TASK 2............................................................................................................................................5
2.1 Summarising the data collected from research ................................................................5
2.2 Analysis of the outcome...................................................................................................7
2.3 Measure of dispersion.......................................................................................................8
2.4 About quartile, percentile and correlation and coefficient...............................................9
TASK 3..........................................................................................................................................10
3.1 Presentation of data through various charts and graphs.................................................10
3.2 Representation through Trend line.................................................................................11
3.3 PPT.................................................................................................................................13
3.4 Formal report from research conducted in UKCBC college..........................................24
TASK 4..........................................................................................................................................25
4.1 Processing tools used at various level in organisation...................................................25
4.2 Presentation of critical path through provided activity..................................................26
4.3 Using financial tool for decision making.......................................................................27
CONCLUSION .............................................................................................................................28
REFERENCES..............................................................................................................................29
⊘ This is a preview!⊘
Do you want full access?
Subscribe today to unlock all pages.
Trusted by 1+ million students worldwide
INTRODUCTION
Business decision making is an important aspect of any business that help them to take
corrective decision regarding success organisations. The motto of organization can be fulfilled
through implementing effective plan to achieve research objectives. Under this project report as a
representation appointed by the committee to know about experiences of students and young
generation about UKCBC college.
So with this regard a proper research survey through collecting data from various
respondents (Ariely and Berns, 2010). Basically, business is mostly depend on effective decision
taken by company to achieve its set vision and mission. It is an important part for any business
concern to manage its business in such a way to increase the performance and stability of its
existence in coming year. The report summarise of various task which are began with conducting
survey through various sources like primary and secondary.
Research is done by filling questionnaire from students of UKCBC college. In the middle
phase of report talks about athematic mean, median and mode form the data collected. On the
basis of which different charts and graphs are being prepared. It also incudes a formal report on
the basis of data collected from the students and staff's. In the last part it consist of various
financial tools those are help in taking appropriate decision. A network diagram is being
designed from the given information and evaluated on that basis. All analysis is based on proper
evaluation of data regarding UKCBC college.
TASK 1
1.1 Data collection through different sources
A plan is a detail document that exact various steps as well as the series that need to be
considered collection of data in the provided research. An effective decision can be use to avoid
various mistakes and errors those are arises because of improper implementation of resource
methodology. so there are different sources which are available with the researcher to evaluate
data in proper manner (Casadesus-Masanell and Ricart, 2011). Primary and secondary data are
mainly two sources that are use to college information regarding youth reaction about their
experiences with UKCBC college. There are various aspects to be considered such as
environment, faculties and eduction level.
Data collection Plan
Paraphrase This Document
Need a fresh take? Get an instant paraphrase of this document with our AI Paraphraser
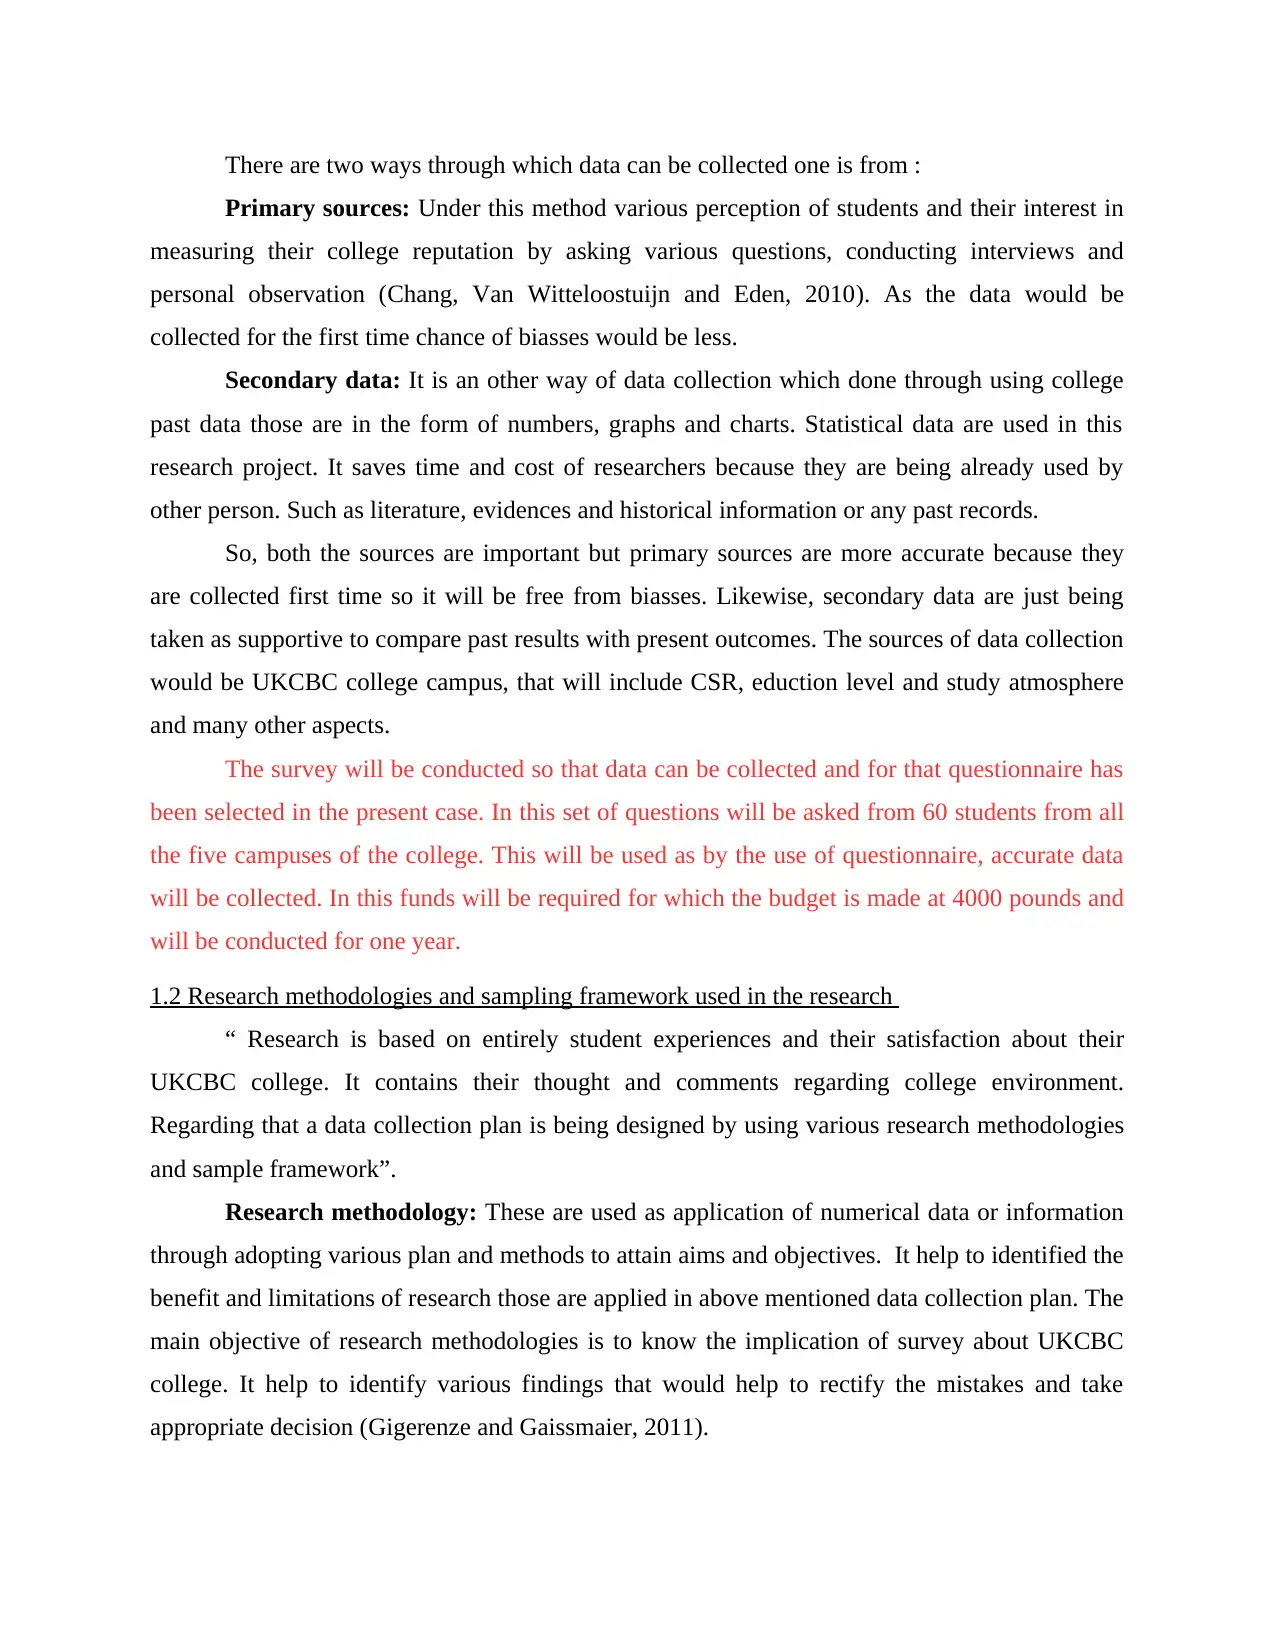
There are two ways through which data can be collected one is from :
Primary sources: Under this method various perception of students and their interest in
measuring their college reputation by asking various questions, conducting interviews and
personal observation (Chang, Van Witteloostuijn and Eden, 2010). As the data would be
collected for the first time chance of biasses would be less.
Secondary data: It is an other way of data collection which done through using college
past data those are in the form of numbers, graphs and charts. Statistical data are used in this
research project. It saves time and cost of researchers because they are being already used by
other person. Such as literature, evidences and historical information or any past records.
So, both the sources are important but primary sources are more accurate because they
are collected first time so it will be free from biasses. Likewise, secondary data are just being
taken as supportive to compare past results with present outcomes. The sources of data collection
would be UKCBC college campus, that will include CSR, eduction level and study atmosphere
and many other aspects.
The survey will be conducted so that data can be collected and for that questionnaire has
been selected in the present case. In this set of questions will be asked from 60 students from all
the five campuses of the college. This will be used as by the use of questionnaire, accurate data
will be collected. In this funds will be required for which the budget is made at 4000 pounds and
will be conducted for one year.
1.2 Research methodologies and sampling framework used in the research
“ Research is based on entirely student experiences and their satisfaction about their
UKCBC college. It contains their thought and comments regarding college environment.
Regarding that a data collection plan is being designed by using various research methodologies
and sample framework”.
Research methodology: These are used as application of numerical data or information
through adopting various plan and methods to attain aims and objectives. It help to identified the
benefit and limitations of research those are applied in above mentioned data collection plan. The
main objective of research methodologies is to know the implication of survey about UKCBC
college. It help to identify various findings that would help to rectify the mistakes and take
appropriate decision (Gigerenze and Gaissmaier, 2011).
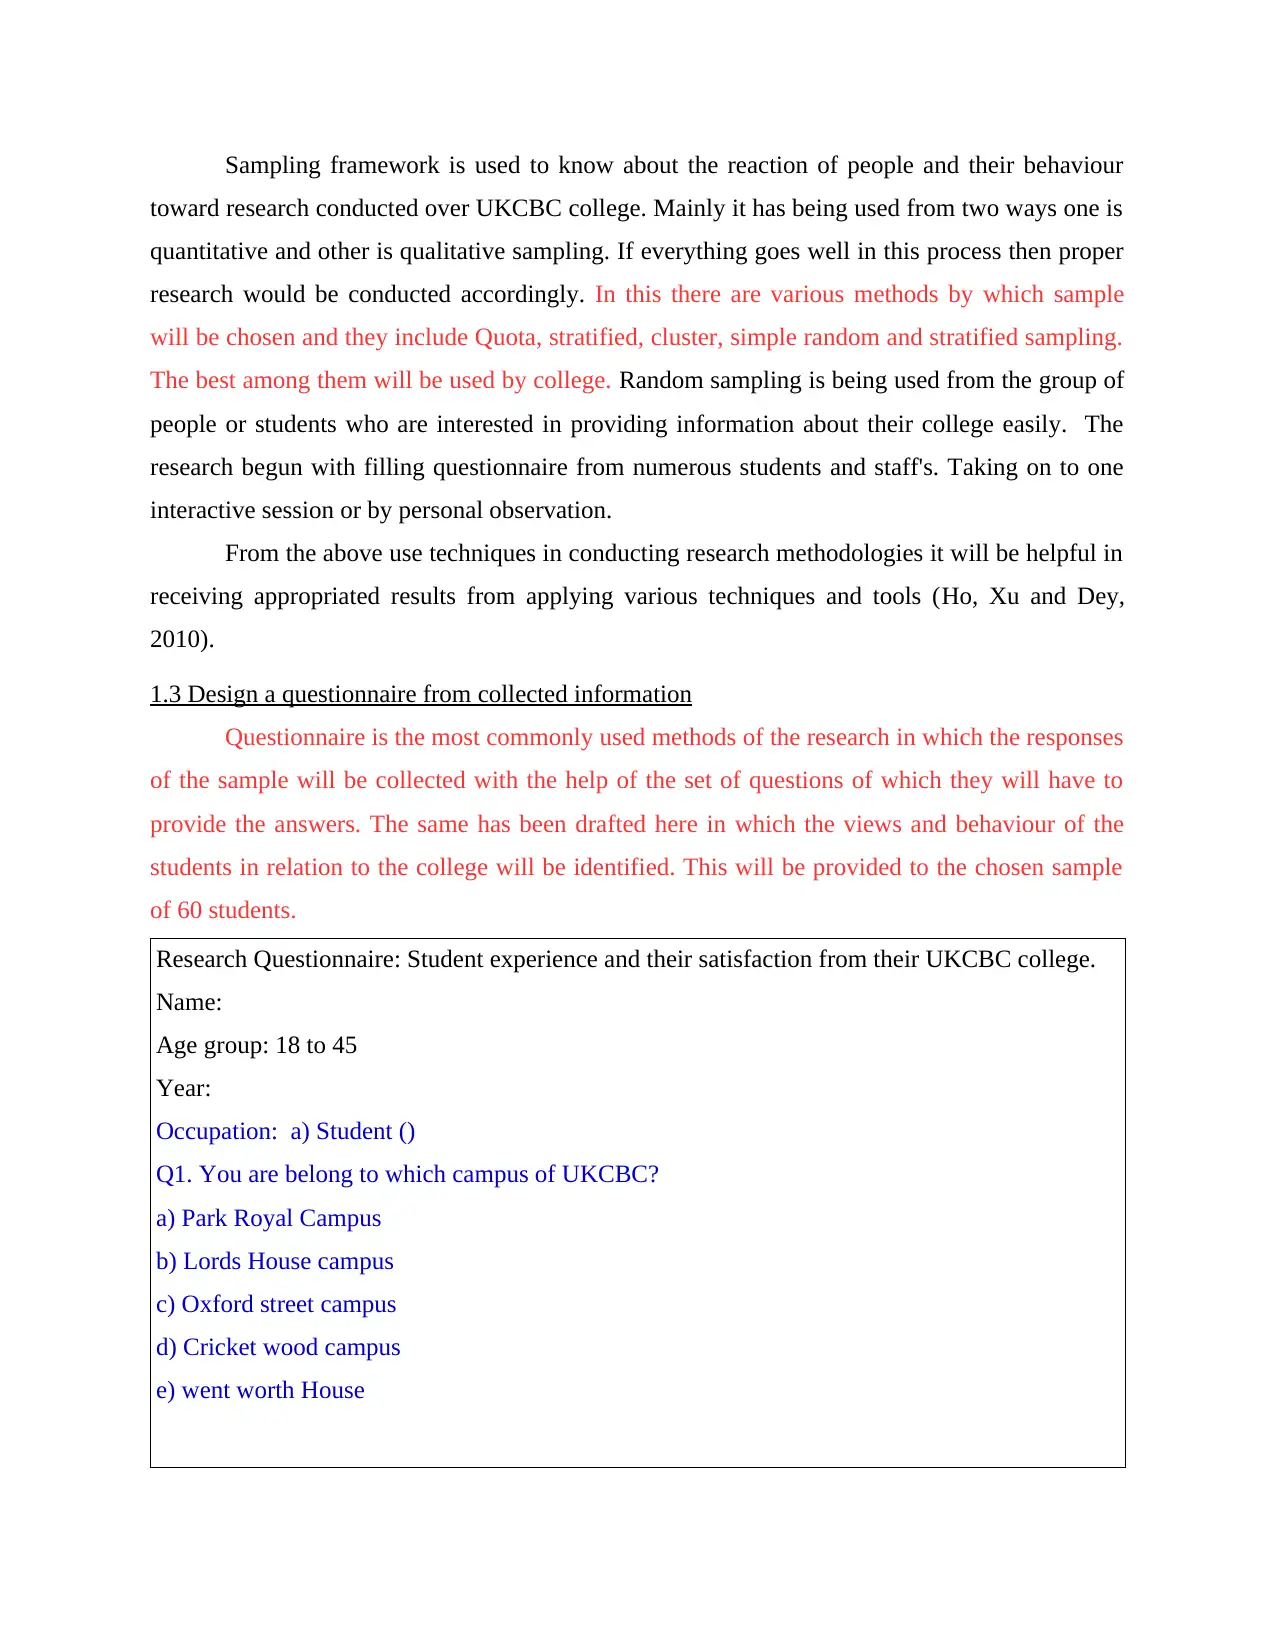
Sampling framework is used to know about the reaction of people and their behaviour
toward research conducted over UKCBC college. Mainly it has being used from two ways one is
quantitative and other is qualitative sampling. If everything goes well in this process then proper
research would be conducted accordingly. In this there are various methods by which sample
will be chosen and they include Quota, stratified, cluster, simple random and stratified sampling.
The best among them will be used by college. Random sampling is being used from the group of
people or students who are interested in providing information about their college easily. The
research begun with filling questionnaire from numerous students and staff's. Taking on to one
interactive session or by personal observation.
From the above use techniques in conducting research methodologies it will be helpful in
receiving appropriated results from applying various techniques and tools (Ho, Xu and Dey,
2010).
1.3 Design a questionnaire from collected information
Questionnaire is the most commonly used methods of the research in which the responses
of the sample will be collected with the help of the set of questions of which they will have to
provide the answers. The same has been drafted here in which the views and behaviour of the
students in relation to the college will be identified. This will be provided to the chosen sample
of 60 students.
Research Questionnaire: Student experience and their satisfaction from their UKCBC college.
Name:
Age group: 18 to 45
Year:
Occupation: a) Student ()
Q1. You are belong to which campus of UKCBC?
a) Park Royal Campus
b) Lords House campus
c) Oxford street campus
d) Cricket wood campus
e) went worth House
⊘ This is a preview!⊘
Do you want full access?
Subscribe today to unlock all pages.
Trusted by 1+ million students worldwide
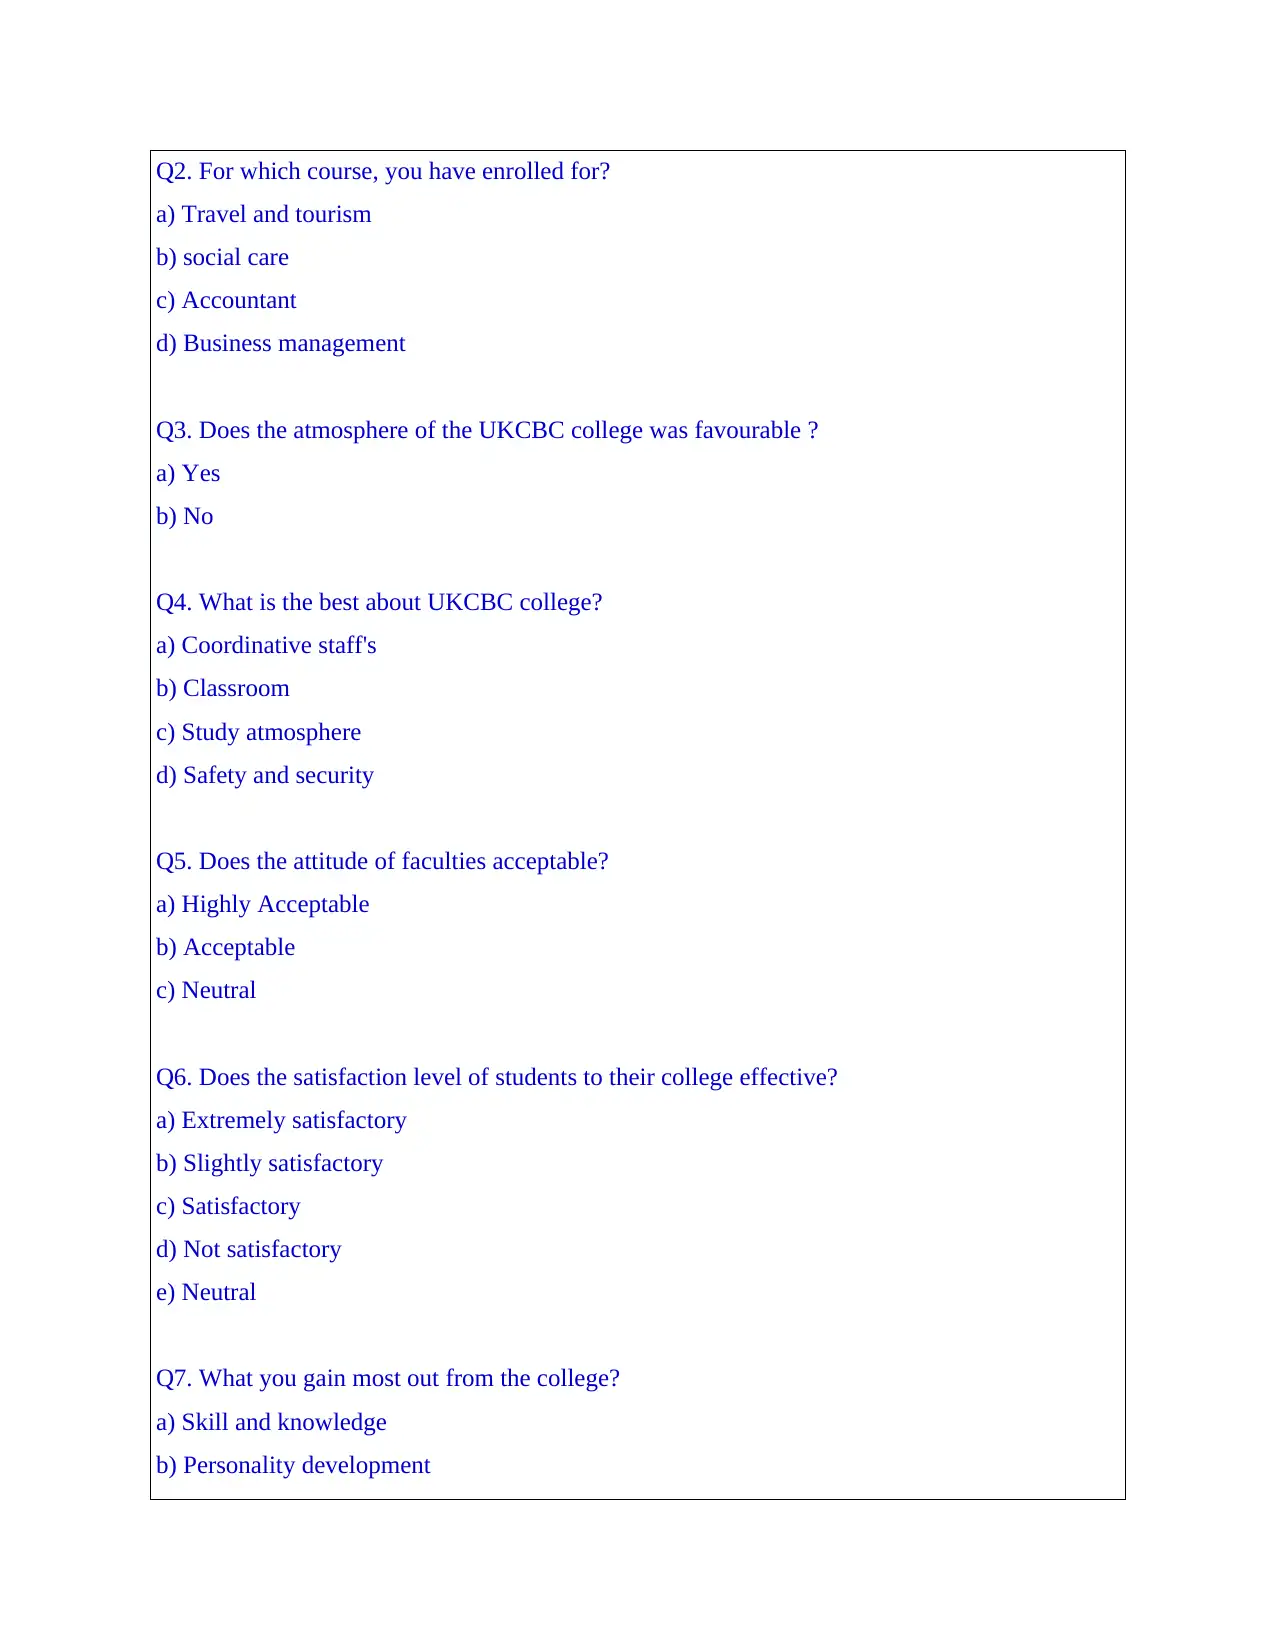
Q2. For which course, you have enrolled for?
a) Travel and tourism
b) social care
c) Accountant
d) Business management
Q3. Does the atmosphere of the UKCBC college was favourable ?
a) Yes
b) No
Q4. What is the best about UKCBC college?
a) Coordinative staff's
b) Classroom
c) Study atmosphere
d) Safety and security
Q5. Does the attitude of faculties acceptable?
a) Highly Acceptable
b) Acceptable
c) Neutral
Q6. Does the satisfaction level of students to their college effective?
a) Extremely satisfactory
b) Slightly satisfactory
c) Satisfactory
d) Not satisfactory
e) Neutral
Q7. What you gain most out from the college?
a) Skill and knowledge
b) Personality development
Paraphrase This Document
Need a fresh take? Get an instant paraphrase of this document with our AI Paraphraser
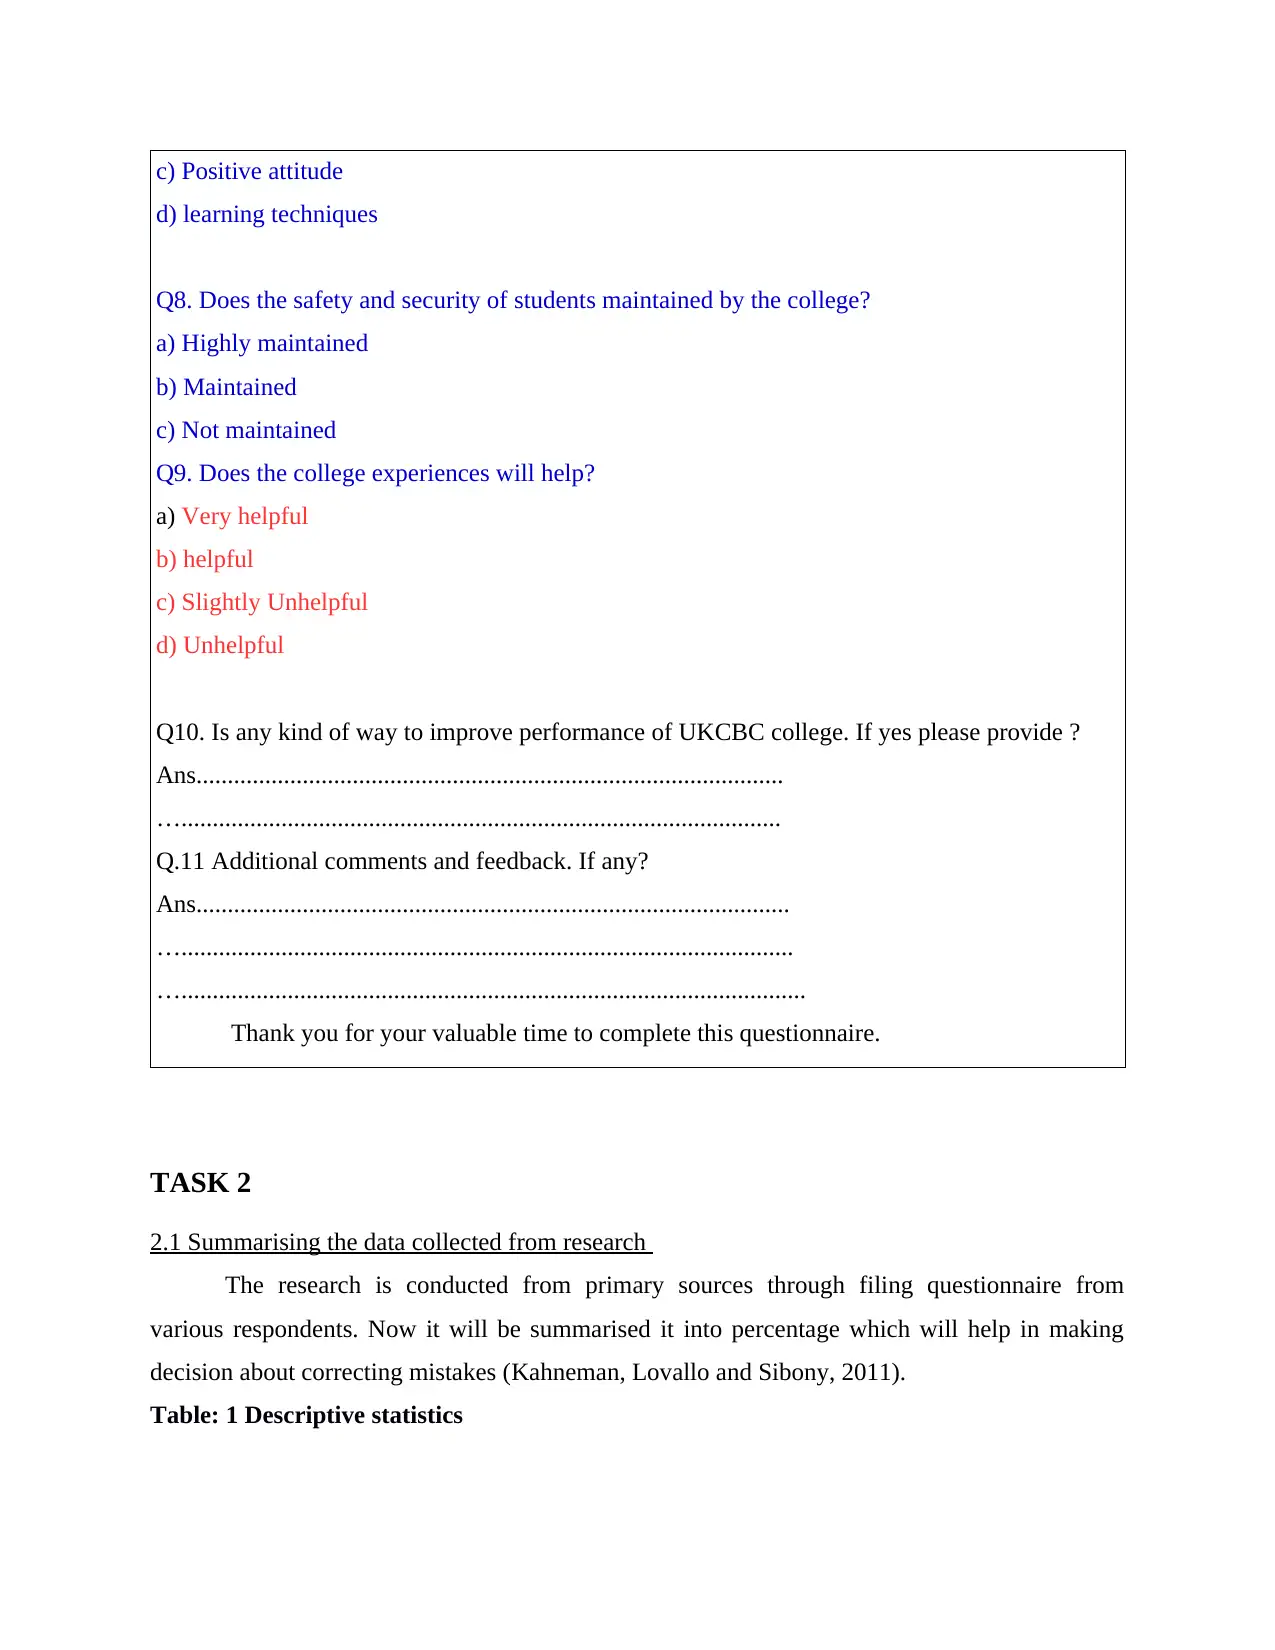
c) Positive attitude
d) learning techniques
Q8. Does the safety and security of students maintained by the college?
a) Highly maintained
b) Maintained
c) Not maintained
Q9. Does the college experiences will help?
a) Very helpful
b) helpful
c) Slightly Unhelpful
d) Unhelpful
Q10. Is any kind of way to improve performance of UKCBC college. If yes please provide ?
Ans..............................................................................................
…................................................................................................
Q.11 Additional comments and feedback. If any?
Ans...............................................................................................
…..................................................................................................
…....................................................................................................
Thank you for your valuable time to complete this questionnaire.
TASK 2
2.1 Summarising the data collected from research
The research is conducted from primary sources through filing questionnaire from
various respondents. Now it will be summarised it into percentage which will help in making
decision about correcting mistakes (Kahneman, Lovallo and Sibony, 2011).
Table: 1 Descriptive statistics
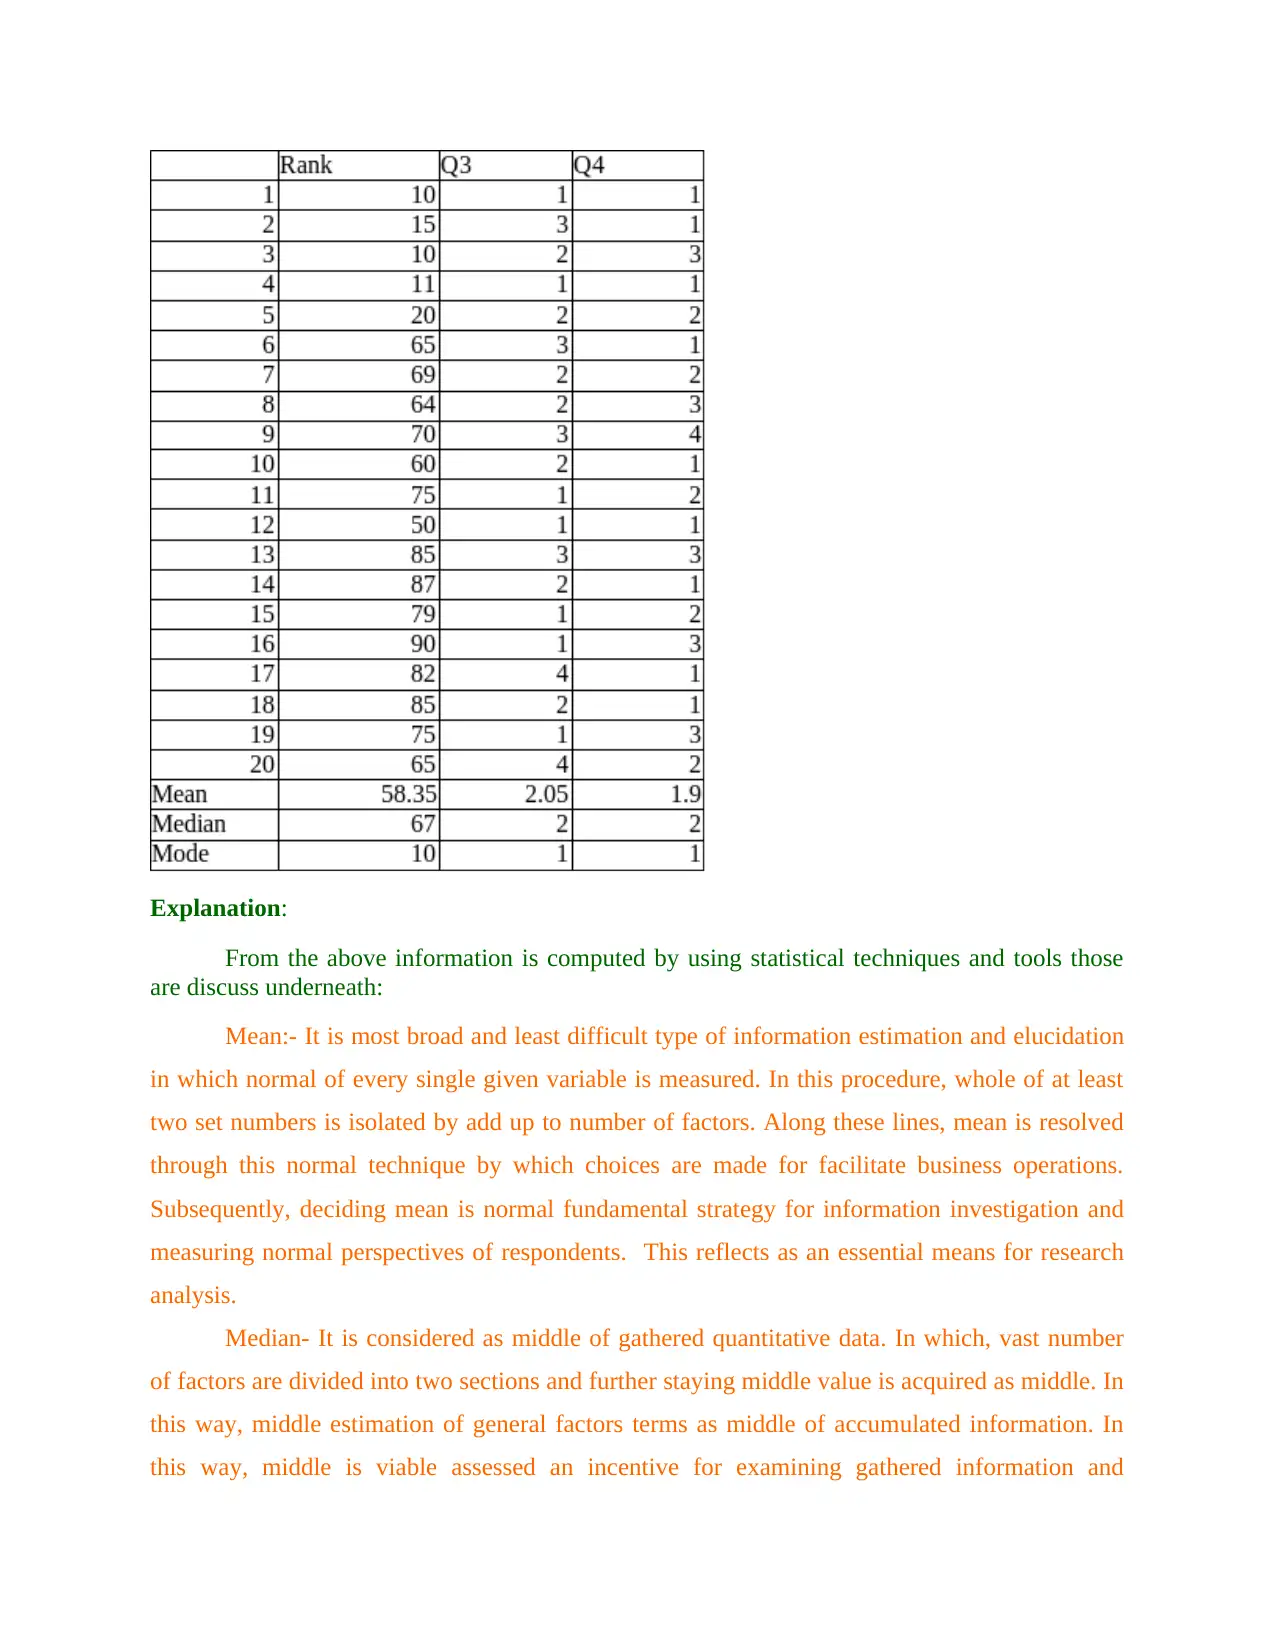
Explanation:
From the above information is computed by using statistical techniques and tools those
are discuss underneath:
Mean:- It is most broad and least difficult type of information estimation and elucidation
in which normal of every single given variable is measured. In this procedure, whole of at least
two set numbers is isolated by add up to number of factors. Along these lines, mean is resolved
through this normal technique by which choices are made for facilitate business operations.
Subsequently, deciding mean is normal fundamental strategy for information investigation and
measuring normal perspectives of respondents. This reflects as an essential means for research
analysis.
Median- It is considered as middle of gathered quantitative data. In which, vast number
of factors are divided into two sections and further staying middle value is acquired as middle. In
this way, middle estimation of general factors terms as middle of accumulated information. In
this way, middle is viable assessed an incentive for examining gathered information and
⊘ This is a preview!⊘
Do you want full access?
Subscribe today to unlock all pages.
Trusted by 1+ million students worldwide
assessing resulting. In any case, middle is viable information elucidation part for information
accumulation.
Mode:- The most repetitive frequent number in factor considers mode in which
recurrence of numbers are considered. Under this procedure framework, repetitive factors are
dictated by which evaluated information is made. Furthermore, through assessing mode,
information examination is created that prompts to make decisions for working further business
exercises. In this manner, mode is considered as information translation instrument as
quantitative data for basic leadership process.
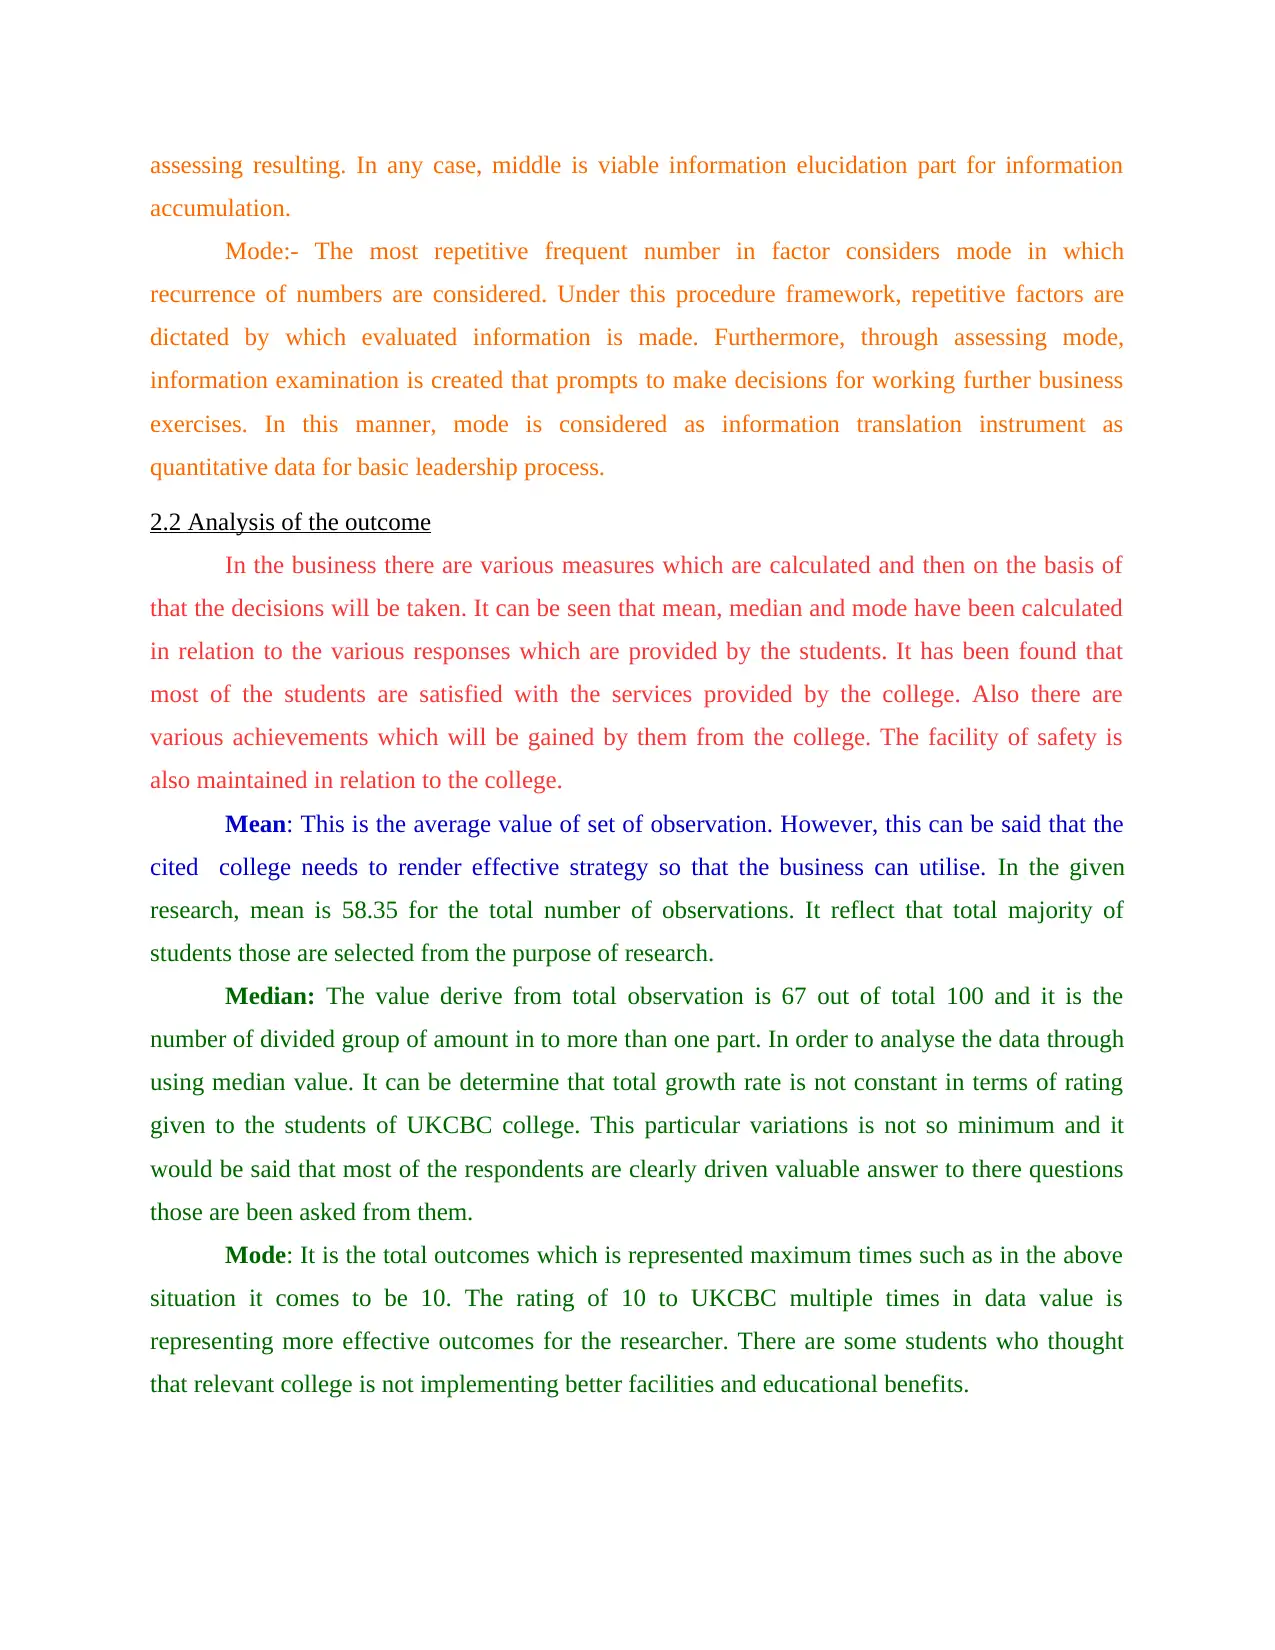
2.2 Analysis of the outcome
In the business there are various measures which are calculated and then on the basis of
that the decisions will be taken. It can be seen that mean, median and mode have been calculated
in relation to the various responses which are provided by the students. It has been found that
most of the students are satisfied with the services provided by the college. Also there are
various achievements which will be gained by them from the college. The facility of safety is
also maintained in relation to the college.
Mean: This is the average value of set of observation. However, this can be said that the
cited college needs to render effective strategy so that the business can utilise. In the given
research, mean is 58.35 for the total number of observations. It reflect that total majority of
students those are selected from the purpose of research.
Median: The value derive from total observation is 67 out of total 100 and it is the
number of divided group of amount in to more than one part. In order to analyse the data through
using median value. It can be determine that total growth rate is not constant in terms of rating
given to the students of UKCBC college. This particular variations is not so minimum and it
would be said that most of the respondents are clearly driven valuable answer to there questions
those are been asked from them.
Mode: It is the total outcomes which is represented maximum times such as in the above
situation it comes to be 10. The rating of 10 to UKCBC multiple times in data value is
representing more effective outcomes for the researcher. There are some students who thought
that relevant college is not implementing better facilities and educational benefits.
accumulation.
Mode:- The most repetitive frequent number in factor considers mode in which
recurrence of numbers are considered. Under this procedure framework, repetitive factors are
dictated by which evaluated information is made. Furthermore, through assessing mode,
information examination is created that prompts to make decisions for working further business
exercises. In this manner, mode is considered as information translation instrument as
quantitative data for basic leadership process.
2.2 Analysis of the outcome
In the business there are various measures which are calculated and then on the basis of
that the decisions will be taken. It can be seen that mean, median and mode have been calculated
in relation to the various responses which are provided by the students. It has been found that
most of the students are satisfied with the services provided by the college. Also there are
various achievements which will be gained by them from the college. The facility of safety is
also maintained in relation to the college.
Mean: This is the average value of set of observation. However, this can be said that the
cited college needs to render effective strategy so that the business can utilise. In the given
research, mean is 58.35 for the total number of observations. It reflect that total majority of
students those are selected from the purpose of research.
Median: The value derive from total observation is 67 out of total 100 and it is the
number of divided group of amount in to more than one part. In order to analyse the data through
using median value. It can be determine that total growth rate is not constant in terms of rating
given to the students of UKCBC college. This particular variations is not so minimum and it
would be said that most of the respondents are clearly driven valuable answer to there questions
those are been asked from them.
Mode: It is the total outcomes which is represented maximum times such as in the above
situation it comes to be 10. The rating of 10 to UKCBC multiple times in data value is
representing more effective outcomes for the researcher. There are some students who thought
that relevant college is not implementing better facilities and educational benefits.
Paraphrase This Document
Need a fresh take? Get an instant paraphrase of this document with our AI Paraphraser
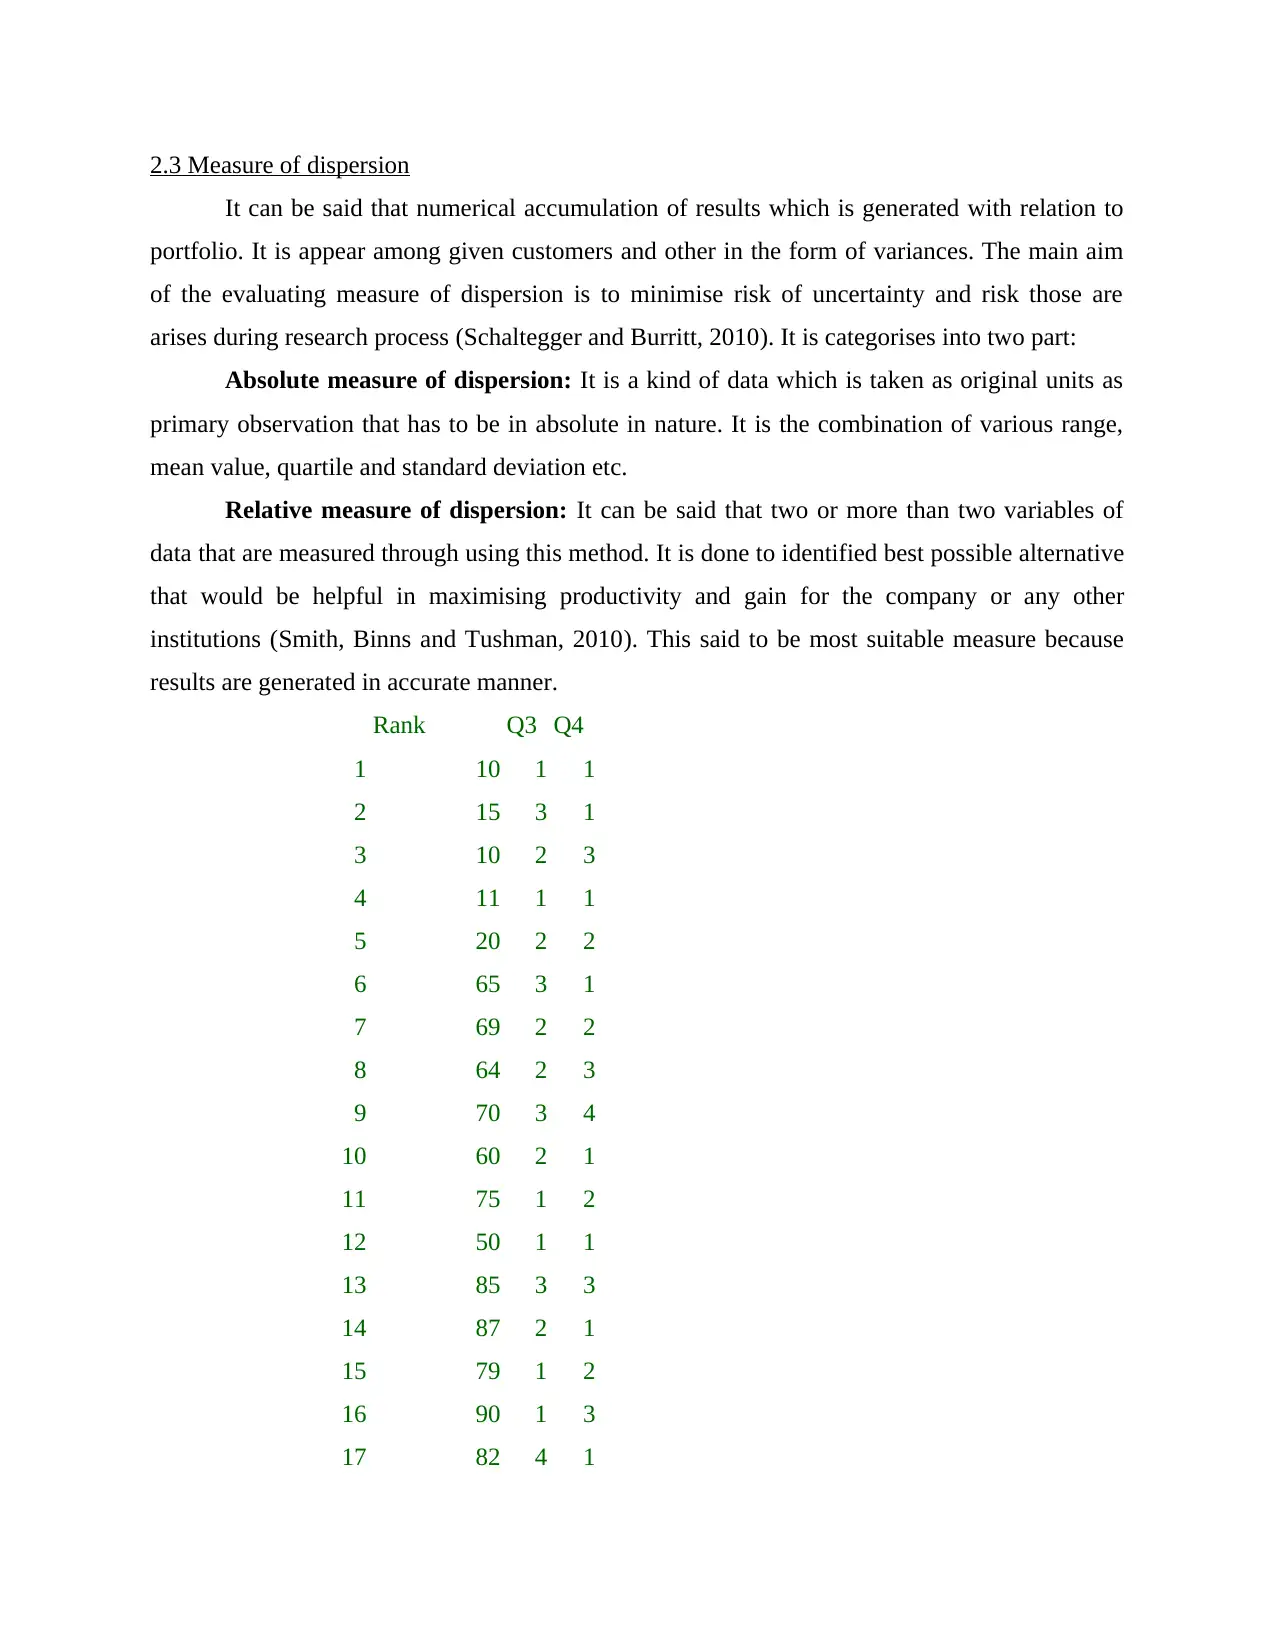
2.3 Measure of dispersion
It can be said that numerical accumulation of results which is generated with relation to
portfolio. It is appear among given customers and other in the form of variances. The main aim
of the evaluating measure of dispersion is to minimise risk of uncertainty and risk those are
arises during research process (Schaltegger and Burritt, 2010). It is categorises into two part:
Absolute measure of dispersion: It is a kind of data which is taken as original units as
primary observation that has to be in absolute in nature. It is the combination of various range,
mean value, quartile and standard deviation etc.
Relative measure of dispersion: It can be said that two or more than two variables of
data that are measured through using this method. It is done to identified best possible alternative
that would be helpful in maximising productivity and gain for the company or any other
institutions (Smith, Binns and Tushman, 2010). This said to be most suitable measure because
results are generated in accurate manner.
Rank Q3 Q4
1 10 1 1
2 15 3 1
3 10 2 3
4 11 1 1
5 20 2 2
6 65 3 1
7 69 2 2
8 64 2 3
9 70 3 4
10 60 2 1
11 75 1 2
12 50 1 1
13 85 3 3
14 87 2 1
15 79 1 2
16 90 1 3
17 82 4 1
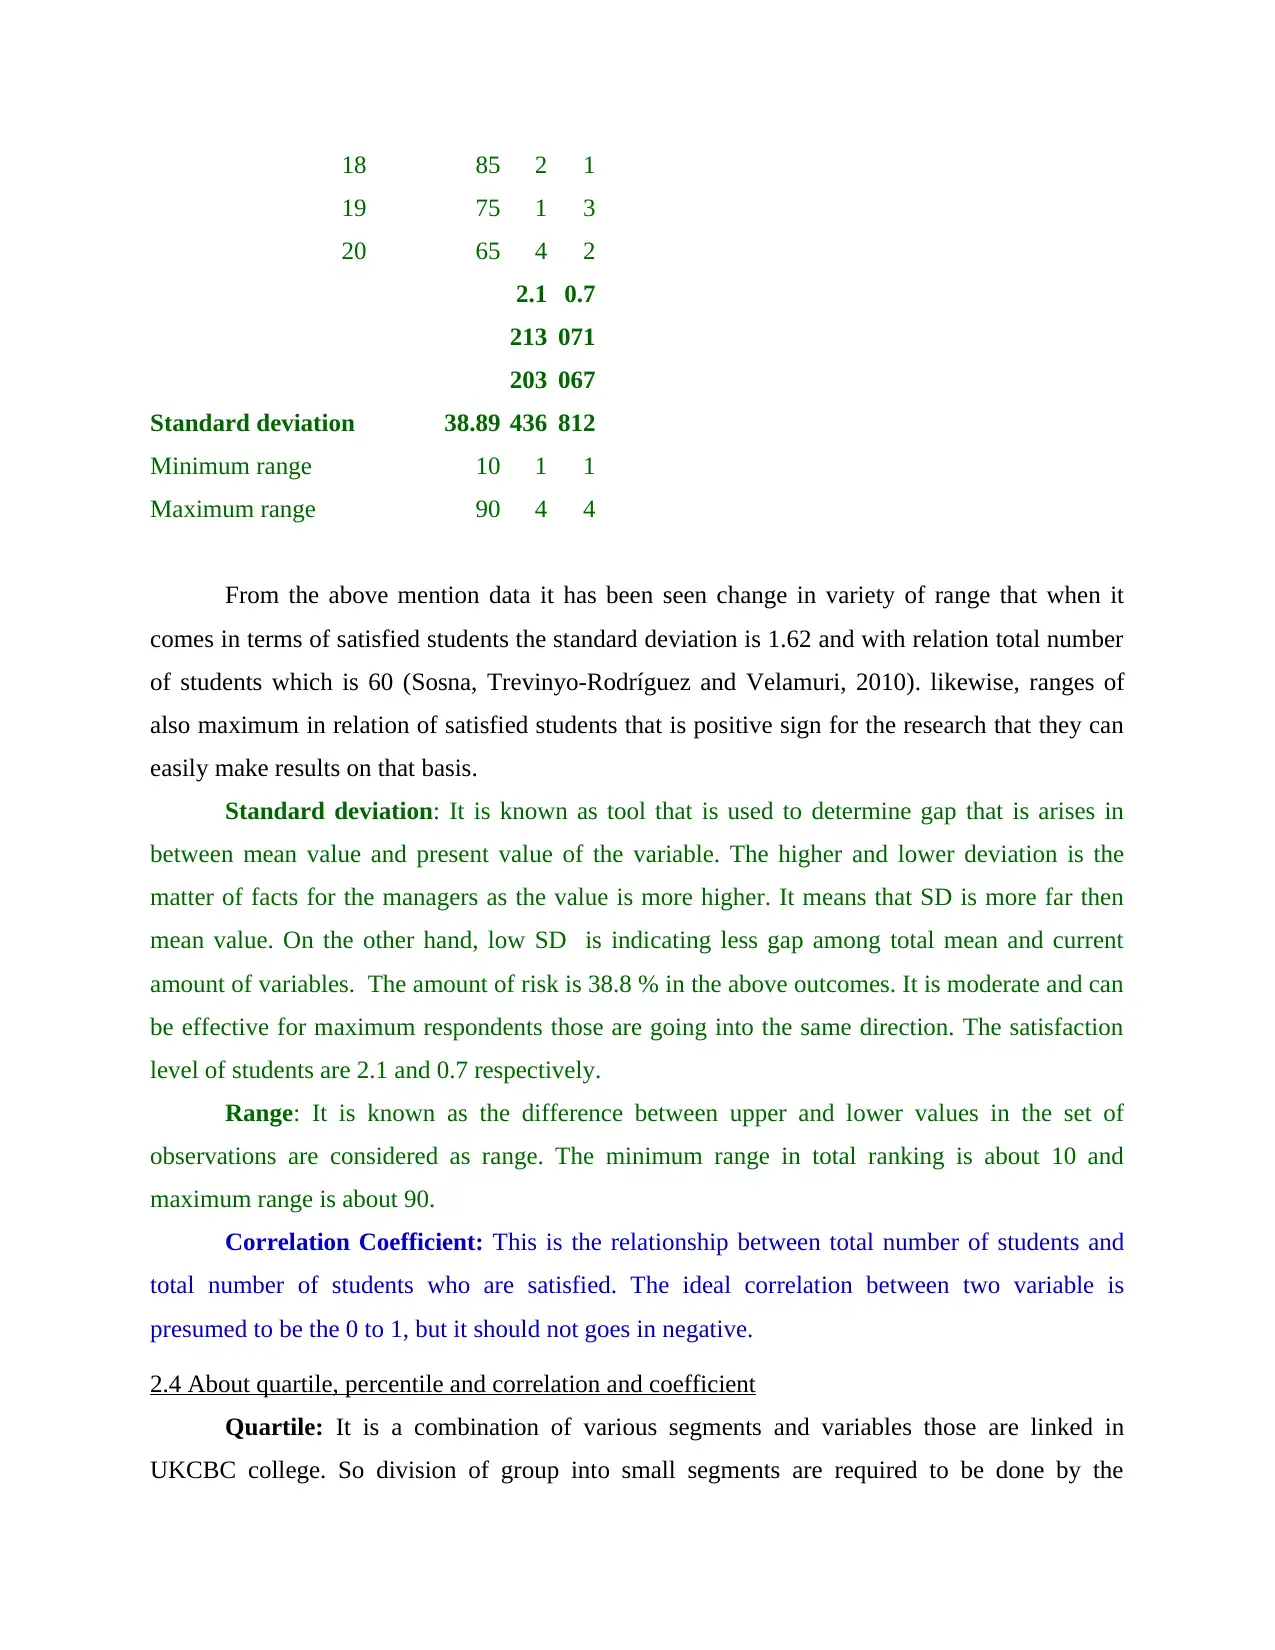
18 85 2 1
19 75 1 3
20 65 4 2
Standard deviation 38.89
2.1
213
203
436
0.7
071
067
812
Minimum range 10 1 1
Maximum range 90 4 4
From the above mention data it has been seen change in variety of range that when it
comes in terms of satisfied students the standard deviation is 1.62 and with relation total number
of students which is 60 (Sosna, Trevinyo-Rodríguez and Velamuri, 2010). likewise, ranges of
also maximum in relation of satisfied students that is positive sign for the research that they can
easily make results on that basis.
Standard deviation: It is known as tool that is used to determine gap that is arises in
between mean value and present value of the variable. The higher and lower deviation is the
matter of facts for the managers as the value is more higher. It means that SD is more far then
mean value. On the other hand, low SD is indicating less gap among total mean and current
amount of variables. The amount of risk is 38.8 % in the above outcomes. It is moderate and can
be effective for maximum respondents those are going into the same direction. The satisfaction
level of students are 2.1 and 0.7 respectively.
Range: It is known as the difference between upper and lower values in the set of
observations are considered as range. The minimum range in total ranking is about 10 and
maximum range is about 90.
Correlation Coefficient: This is the relationship between total number of students and
total number of students who are satisfied. The ideal correlation between two variable is
presumed to be the 0 to 1, but it should not goes in negative.
2.4 About quartile, percentile and correlation and coefficient
Quartile: It is a combination of various segments and variables those are linked in
UKCBC college. So division of group into small segments are required to be done by the
⊘ This is a preview!⊘
Do you want full access?
Subscribe today to unlock all pages.
Trusted by 1+ million students worldwide
1 out of 32
Related Documents


Your All-in-One AI-Powered Toolkit for Academic Success.
+13062052269
info@desklib.com
Available 24*7 on WhatsApp / Email
![[object Object]](/_next/static/media/star-bottom.7253800d.svg)
Unlock your academic potential
Copyright © 2020–2026 A2Z Services. All Rights Reserved. Developed and managed by ZUCOL.