Decision Support Tools: Analysis, Models, and Applications Assignment

Verified

Added on  2023/03/20

|12
|1601
|98
Homework Assignment
AI Summary
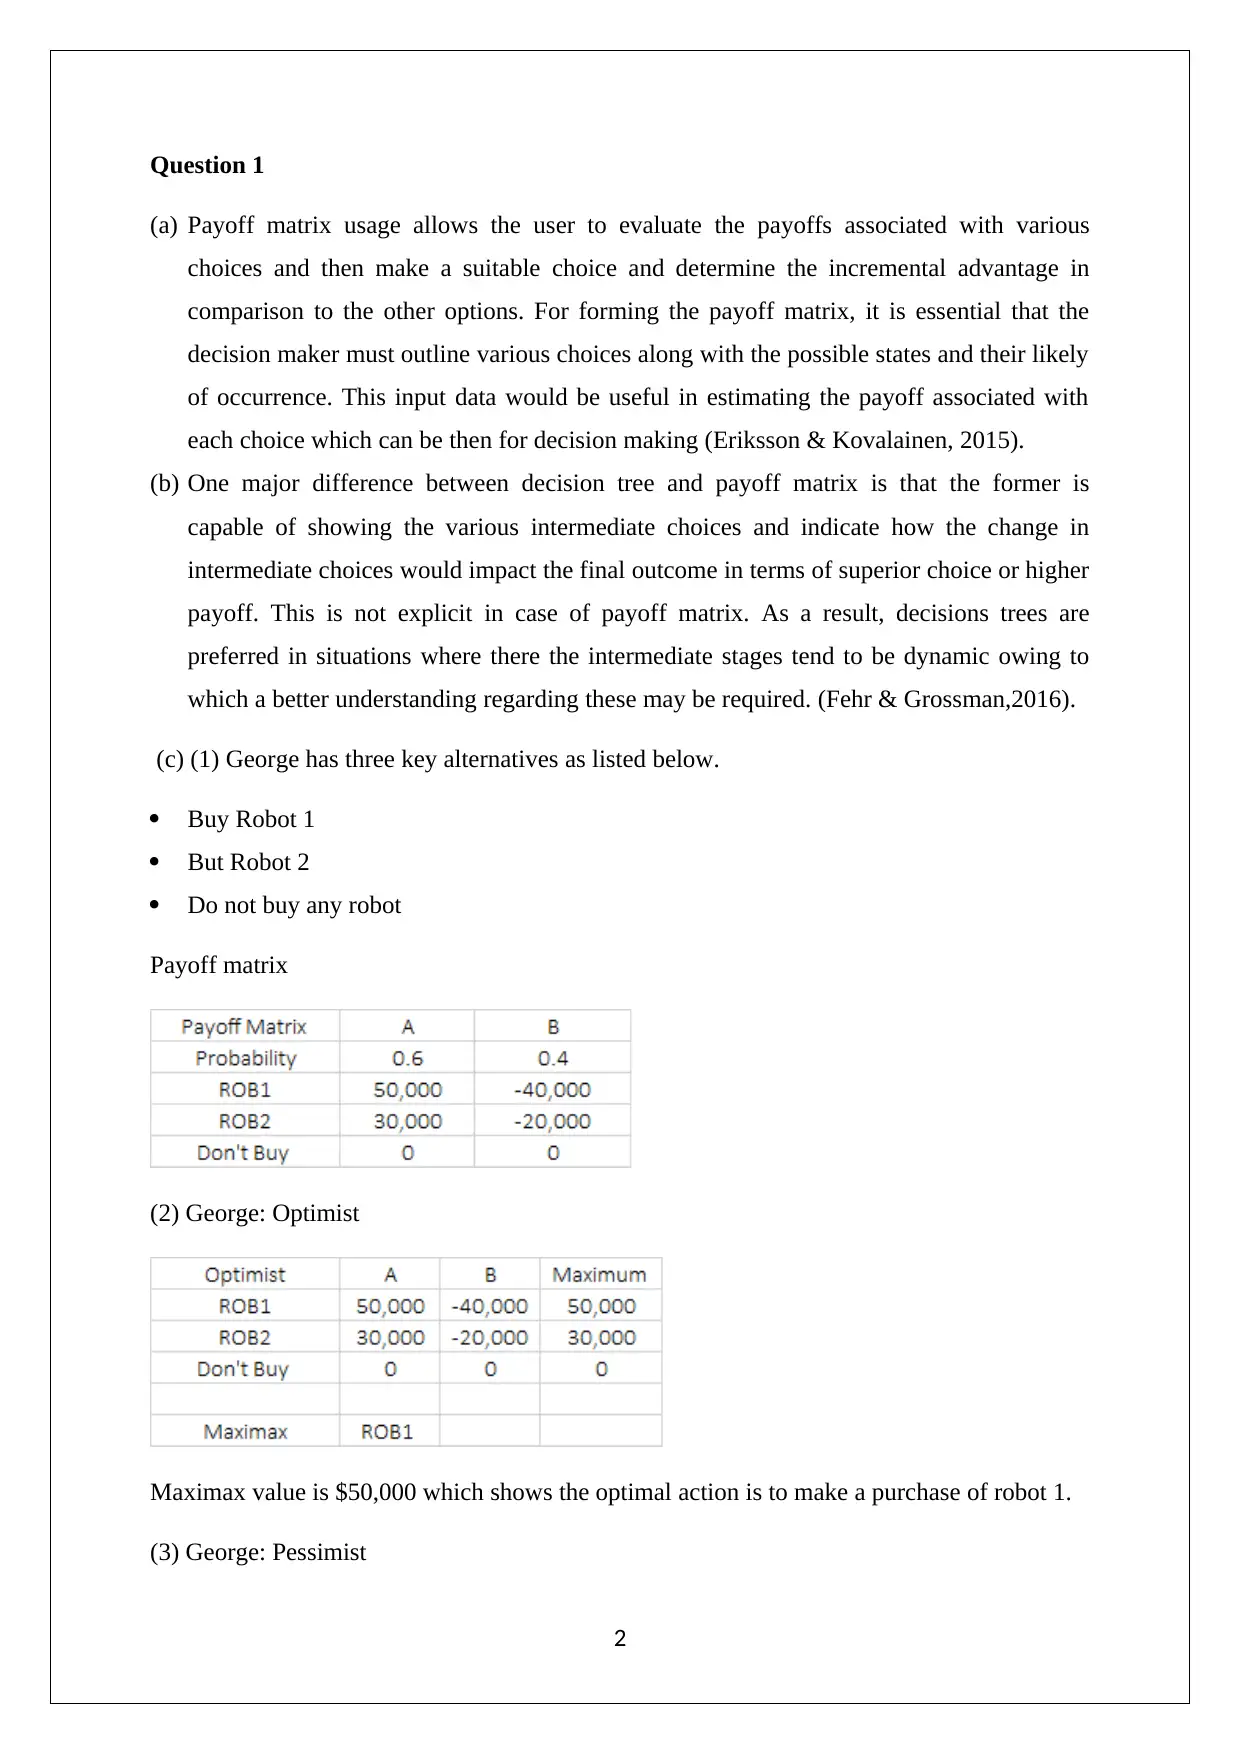
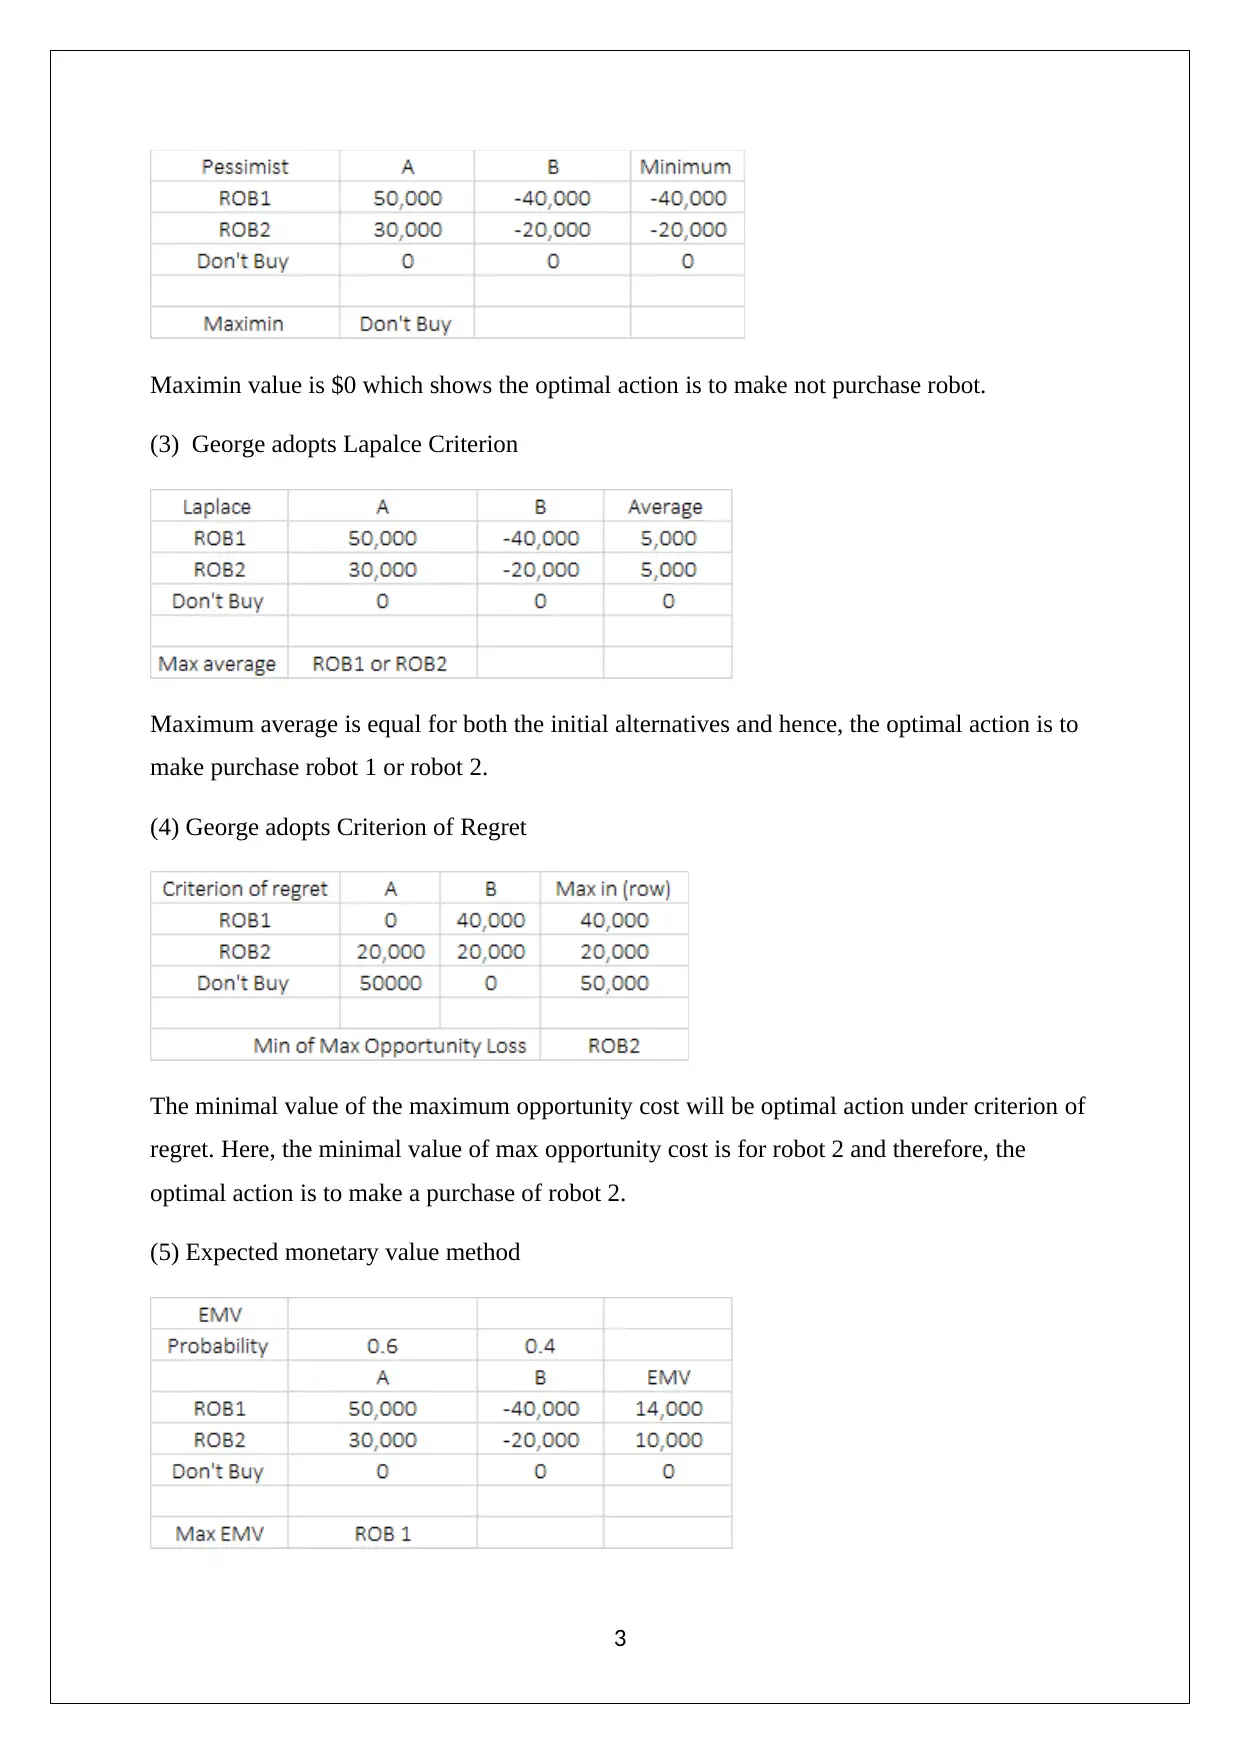
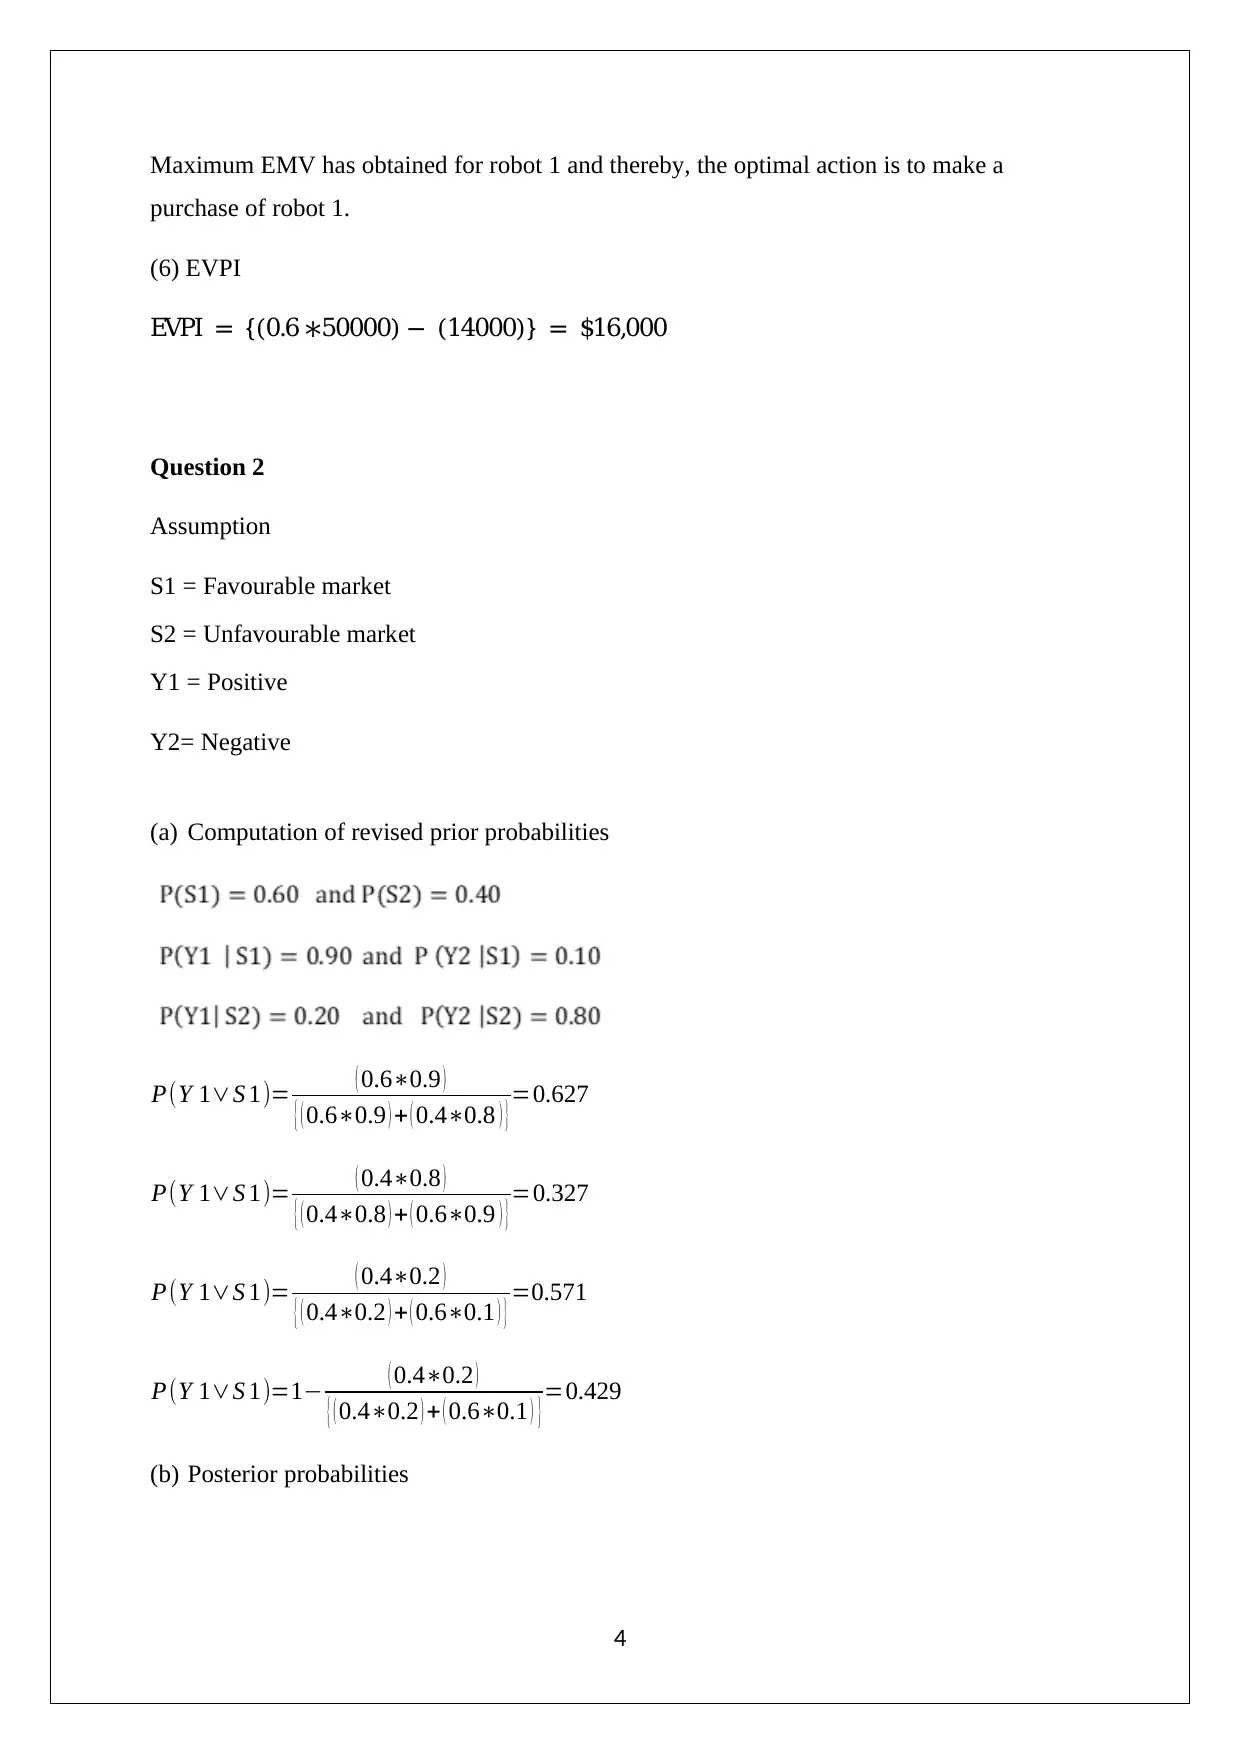
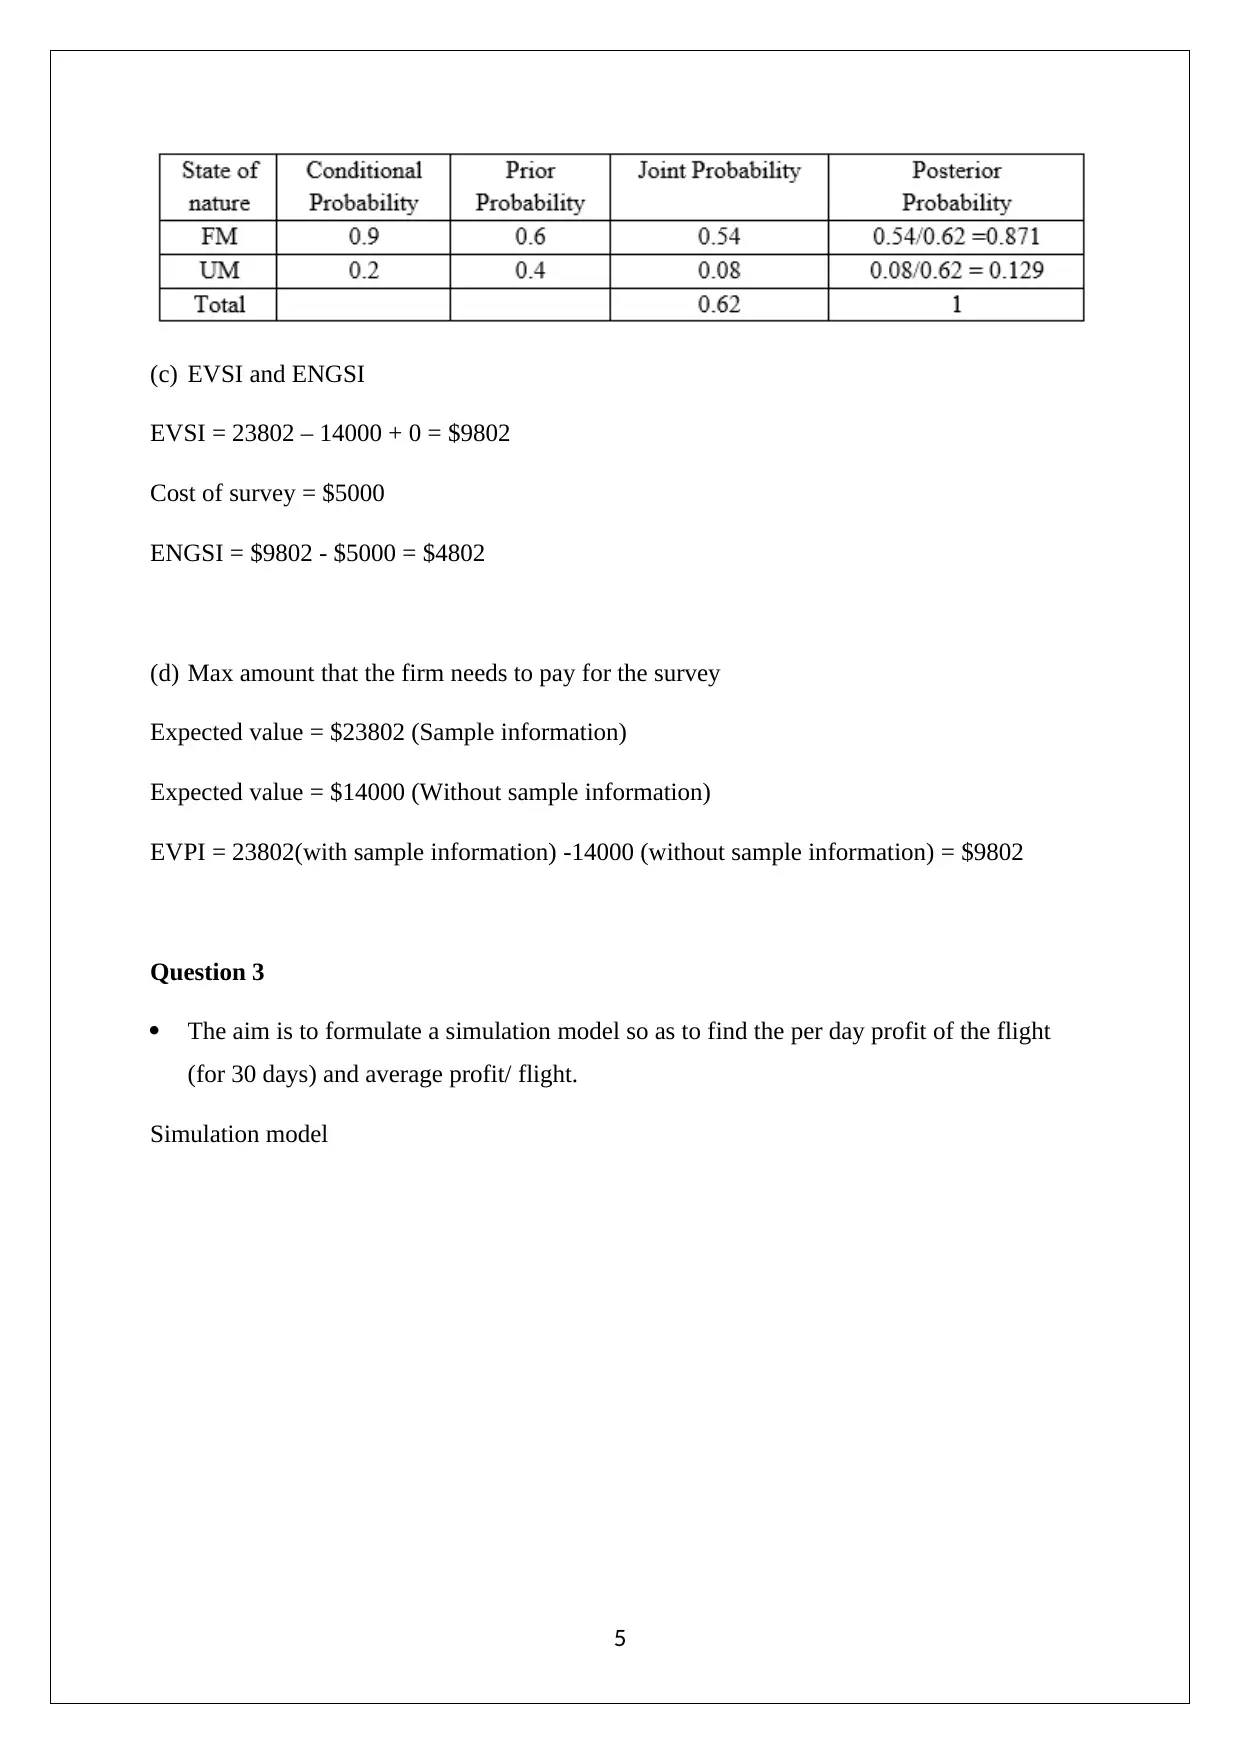
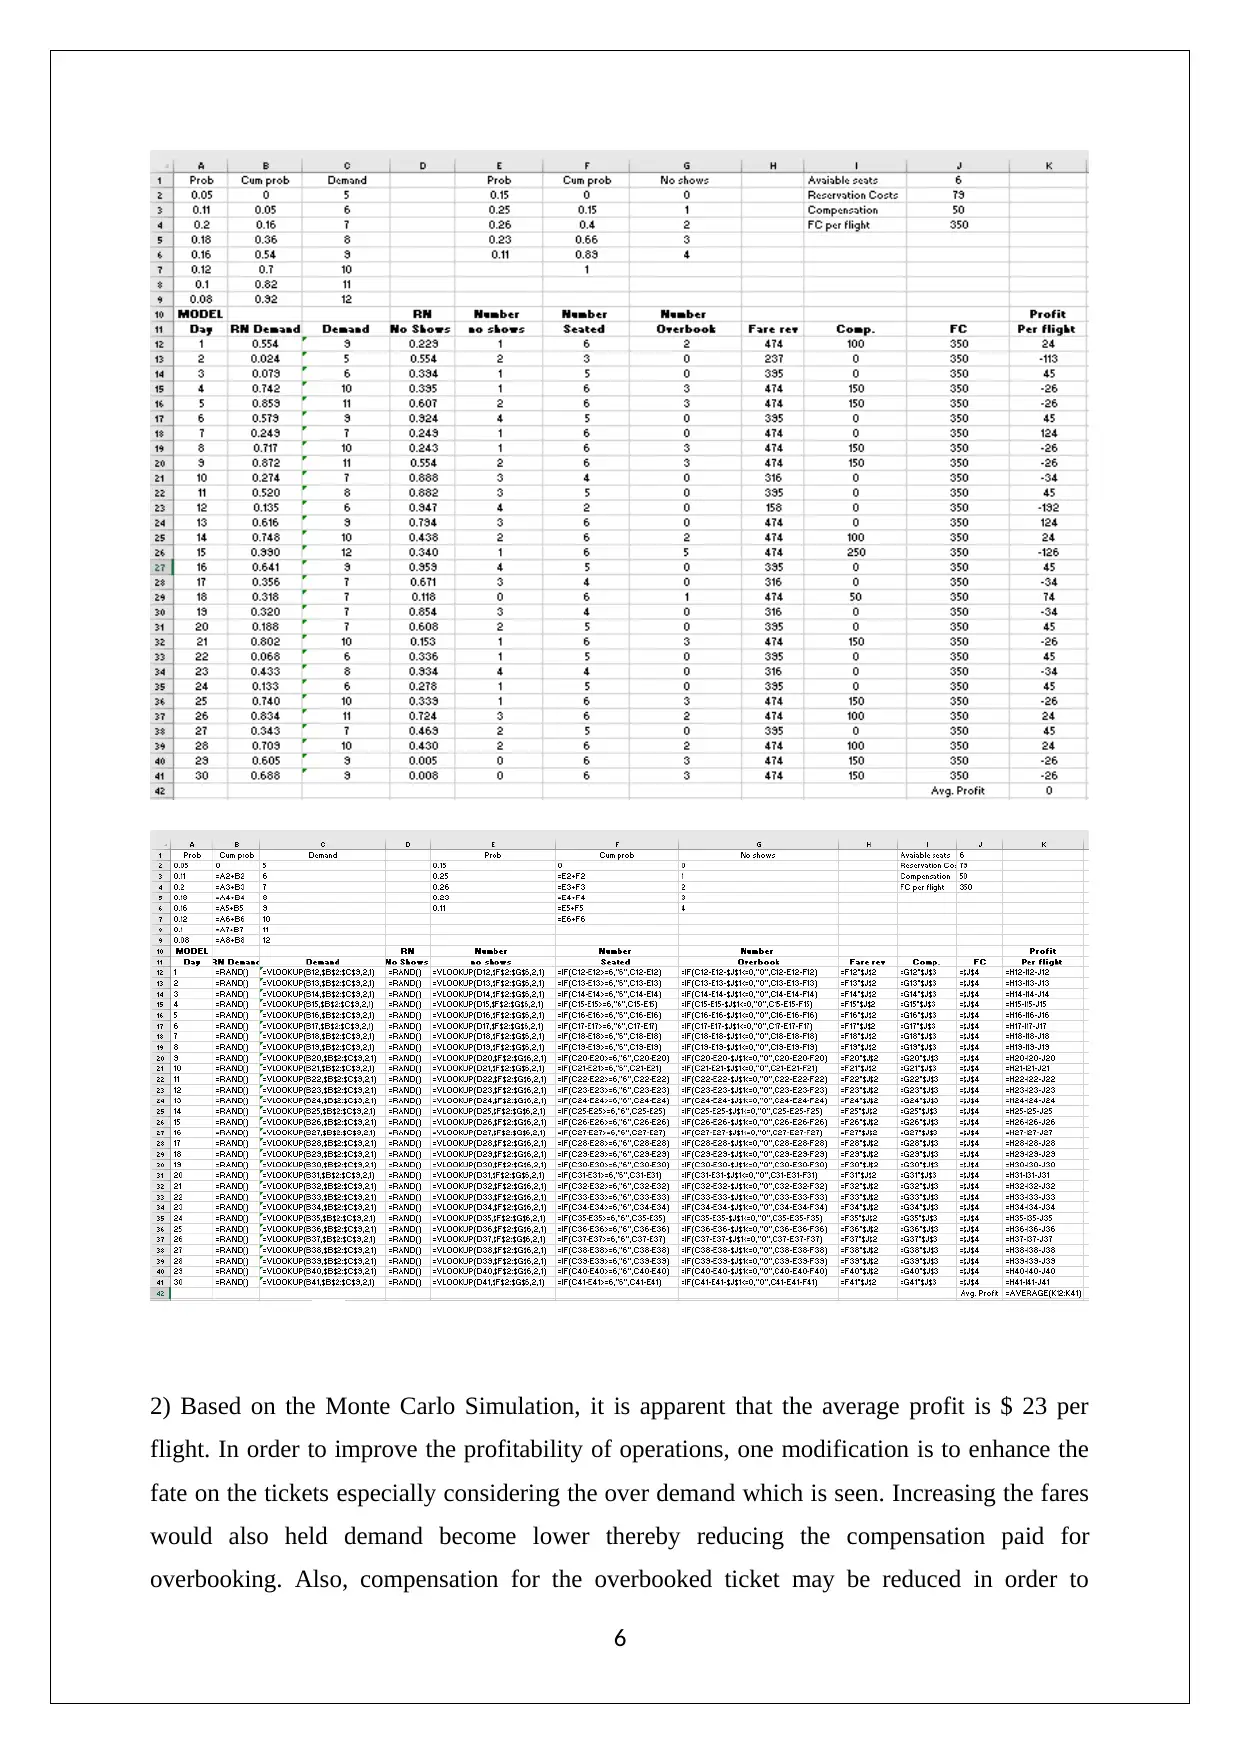
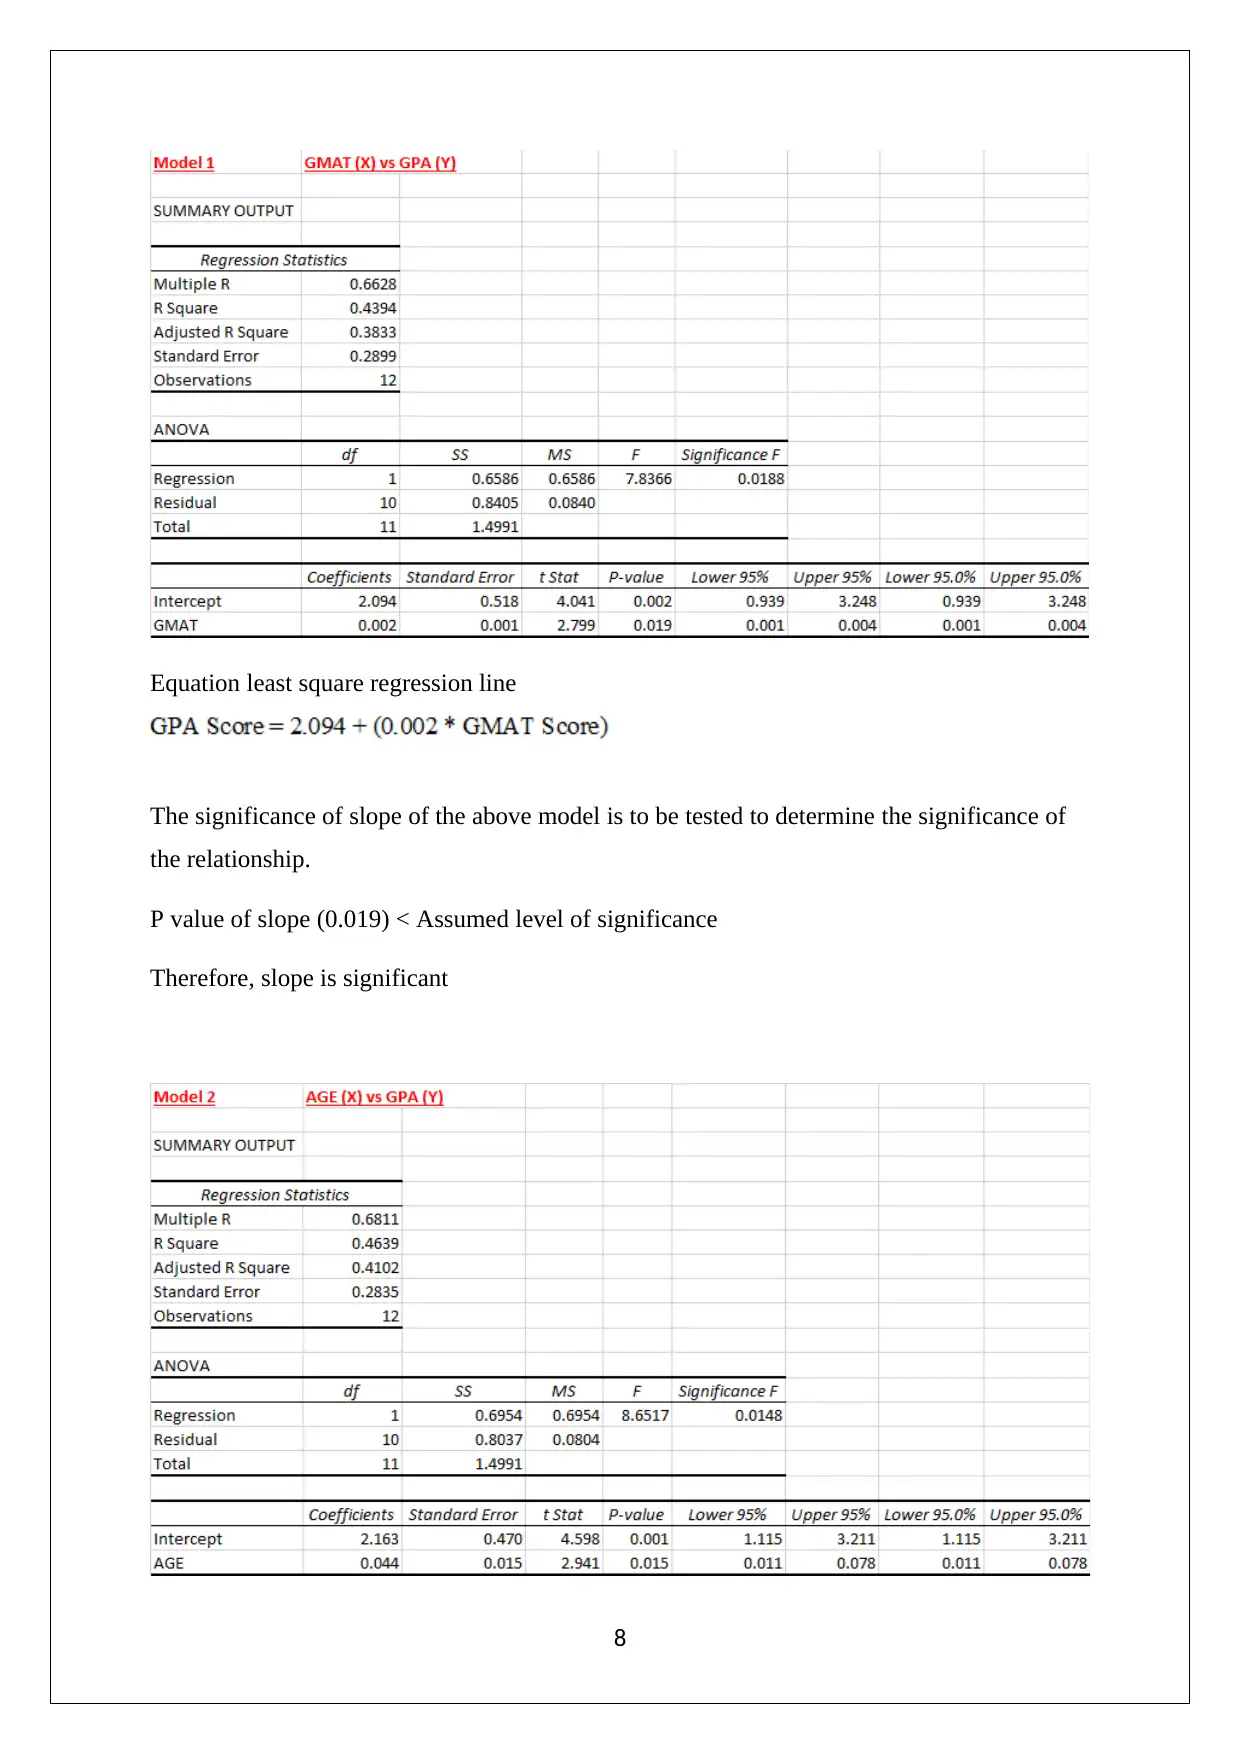
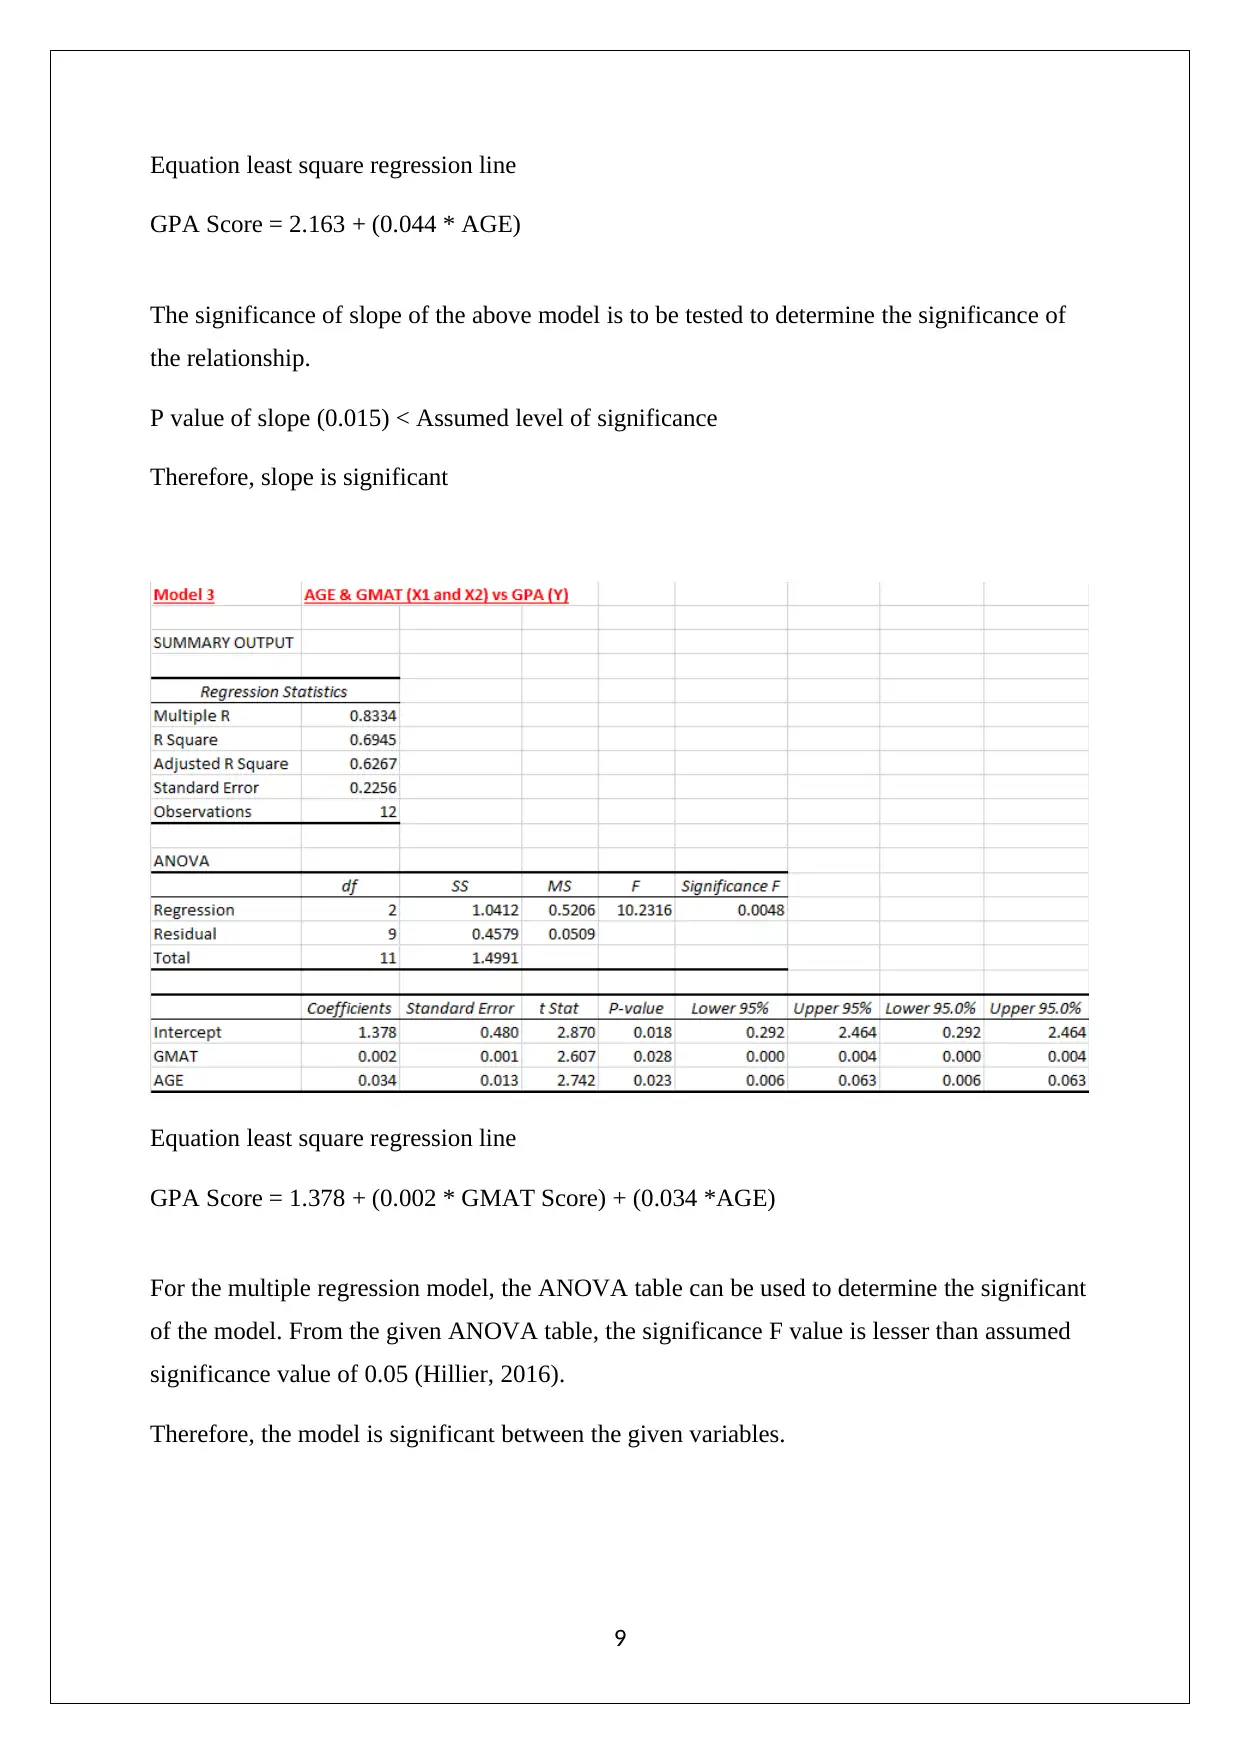
This assignment solution comprehensively addresses decision support tools, starting with payoff matrices and decision trees, and then moving on to more complex methods. It analyzes scenarios using different criteria like Maximax, Maximin, and Laplace, and further explores Bayesian analysis and expected value of sample information. The solution then presents a Monte Carlo simulation to determine profitability and suggests strategies to improve it. Additionally, regression models are used to analyze relationships between variables, and break-even analysis is performed to determine profitability and target profits. The assignment includes detailed calculations, interpretations, and recommendations for business decision-making.
tabler-icon-diamond-filled.svg

Contribute Materials

Your contribution can guide someone’s learning journey. Share your documents today.
Document Page
DECISION SUPPORT TOOLS
STUDENT ID:
[Pick the date]
tabler-icon-diamond-filled.svg

Secure Best Marks with AI Grader

Need help grading? Try our AI Grader for instant feedback on your assignments.
Document Page
Question 1
(a) Payoff matrix usage allows the user to evaluate the payoffs associated with various
choices and then make a suitable choice and determine the incremental advantage in
comparison to the other options. For forming the payoff matrix, it is essential that the
decision maker must outline various choices along with the possible states and their likely
of occurrence. This input data would be useful in estimating the payoff associated with
each choice which can be then for decision making (Eriksson & Kovalainen, 2015).
(b) One major difference between decision tree and payoff matrix is that the former is
capable of showing the various intermediate choices and indicate how the change in
intermediate choices would impact the final outcome in terms of superior choice or higher
payoff. This is not explicit in case of payoff matrix. As a result, decisions trees are
preferred in situations where there the intermediate stages tend to be dynamic owing to
which a better understanding regarding these may be required. (Fehr & Grossman,2016).
(c) (1) George has three key alternatives as listed below.
Buy Robot 1
But Robot 2
Do not buy any robot
Payoff matrix
(2) George: Optimist
Maximax value is $50,000 which shows the optimal action is to make a purchase of robot 1.
(3) George: Pessimist
2
Document Page
Maximin value is $0 which shows the optimal action is to make not purchase robot.
(3) George adopts Lapalce Criterion
Maximum average is equal for both the initial alternatives and hence, the optimal action is to
make purchase robot 1 or robot 2.
(4) George adopts Criterion of Regret
The minimal value of the maximum opportunity cost will be optimal action under criterion of
regret. Here, the minimal value of max opportunity cost is for robot 2 and therefore, the
optimal action is to make a purchase of robot 2.
(5) Expected monetary value method
3
Document Page
Maximum EMV has obtained for robot 1 and thereby, the optimal action is to make a
purchase of robot 1.
(6) EVPI
EVPI = {(0.6 50000) (14000)} = $16,000
Question 2
Assumption
S1 = Favourable market
S2 = Unfavourable market
Y1 = Positive
Y2= Negative
(a) Computation of revised prior probabilities
P(Y 1S 1)= ( 0.60.9 )
{ ( 0.60.9 ) + ( 0.40.8 ) } =0.627
P(Y 1S 1)= ( 0.40.8 )
{ ( 0.40.8 ) + ( 0.60.9 ) } =0.327
P(Y 1S 1)= ( 0.40.2 )
{ ( 0.40.2 ) + ( 0.60.1 ) } =0.571
P(Y 1S 1)=1 ( 0.40.2 )
{ ( 0.40.2 ) + ( 0.60.1 ) }=0.429
(b) Posterior probabilities
4
tabler-icon-diamond-filled.svg

Secure Best Marks with AI Grader

Need help grading? Try our AI Grader for instant feedback on your assignments.
Document Page
(c) EVSI and ENGSI
EVSI = 23802 – 14000 + 0 = $9802
Cost of survey = $5000
ENGSI = $9802 - $5000 = $4802
(d) Max amount that the firm needs to pay for the survey
Expected value = $23802 (Sample information)
Expected value = $14000 (Without sample information)
EVPI = 23802(with sample information) -14000 (without sample information) = $9802
Question 3
The aim is to formulate a simulation model so as to find the per day profit of the flight
(for 30 days) and average profit/ flight.
Simulation model
5
Document Page
2) Based on the Monte Carlo Simulation, it is apparent that the average profit is $ 23 per
flight. In order to improve the profitability of operations, one modification is to enhance the
fate on the tickets especially considering the over demand which is seen. Increasing the fares
would also held demand become lower thereby reducing the compensation paid for
overbooking. Also, compensation for the overbooked ticket may be reduced in order to
6
Document Page
enhance the overall profits. Further, the increase in fare and higher compensation for
overbooking may also improve the profits provided the quantum of compensation increase
for overbooking does not exceed the fare increase.
3) The Manager
13th May, 2019
Dear Sir
The Monte Carlo Simulation has been run in order to carry out an analysis of the current
profitability of operations and also to identify measures for improvement of the same. With
regards to the improvement in profitability, one of the measures which is quite obvious is to
increase the fares. This is because at the present, the capacity is only 6 while the ticket
demand clearly indicates that overbooking is a very common phenomenon. Thereby, the
ticket price must be raised by the company. If the ticket price raise have adverse impact on
the occupancy, then dynamic pricing may be introduced where any price can be
incrementally adjusted as the available seats tend to decrease. Further, too much hike also
would not be advisable considering that there is a significant probability of no shows which
allows the plane to operate at more than 100% capacity.
Yours Sincerely
STUDENT NAME
Question 4
Regression Model
7
tabler-icon-diamond-filled.svg

Paraphrase This Document

Need a fresh take? Get an instant paraphrase of this document with our AI Paraphraser
Document Page
Equation least square regression line
The significance of slope of the above model is to be tested to determine the significance of
the relationship.
P value of slope (0.019) < Assumed level of significance
Therefore, slope is significant
8
Document Page
Equation least square regression line
GPA Score = 2.163 + (0.044 * AGE)
The significance of slope of the above model is to be tested to determine the significance of
the relationship.
P value of slope (0.015) < Assumed level of significance
Therefore, slope is significant
Equation least square regression line
GPA Score = 1.378 + (0.002 * GMAT Score) + (0.034 *AGE)
For the multiple regression model, the ANOVA table can be used to determine the significant
of the model. From the given ANOVA table, the significance F value is lesser than assumed
significance value of 0.05 (Hillier, 2016).
Therefore, the model is significant between the given variables.
9
Document Page
(2) To choose the best model from the above choices, it is critical to check the R2 values. The
Model 3 offers the highest coefficient of determination which indicates that this model is
better than the other choices. Also, the model 3 considers both Age and GMAT which are
both significant variables and hence must be included in the regression model. This is the
case with Model 3 which makes it the best model (Flick, 2015).
(3) GMAT score = 600, Age = 29
Equation least square regression line
GPA Score = 1.378 + (0.002 * 600) + (0.034 *29) = 3.512
GPA Score = 1.378 + (0.002 * GMAT Score) + (0.034 *AGE)
GPA=3.512Score
Question 5
(1) The given data and information are shown below.
Break even unit of product A = FC/ Contribution margin per unit = $1200/ ($12-$6) = 200
Break even dollars of product A= (FC/ Contribution margin per unit) * Price per unit
= $1200
$12$6
$12 = $2400
(2) Target PAT = $600
Number of units to get the target profit after tax ¿ {600+1200
126 }=300
10
tabler-icon-diamond-filled.svg

Secure Best Marks with AI Grader

Need help grading? Try our AI Grader for instant feedback on your assignments.
Document Page
Margin of safety = 300 12 1200
12 6
12 = $1200
(3) Profit for 250 units
Profit = Gross profit – Fixed cost = (Contribution margin per unit* total units) – Fixed cost
(4) Product B has also been incorporated
Here, number of units sold of product A = 2x and profit = 24x
Number of units sold of product B = x and profit = 12x
Now,
PBT (Profit Before Tax) = 2000 = 24x – 5200
And thus, x = 300
Product A Product B
Number of units = 2x = 2*300 = 600 Number of units = x = 300
Units of product (in $) = 12 *600 = $3600 Units of product (in $) = 20*300 = $6000
11
Document Page
References
Eriksson, P. & Kovalainen, A. (2015). Quantitative methods in business research (3rded.).
London: Sage Publications.
Fehr, F. H., & Grossman, G. (2016).An introduction to sets, probability and hypothesis
testing (3rded.). Ohio: Heath.
Flick, U. (2015). Introducing research methodology: A beginner's guide to doing a research
project (4thed.). New York: Sage Publications.
Hillier, F. (2016).Introduction to Operations Research.(6thed.). New York: McGraw Hill
Publications.
12
chevron_up_icon
1 out of 12
circle_padding
hide_on_mobile
zoom_out_icon
logo.png

Your All-in-One AI-Powered Toolkit for Academic Success.

Available 24*7 on WhatsApp / Email

[object Object]