Business Report: Decision Support Tools for Boutique Catering's Growth
VerifiedAdded on 2022/10/12
|9
|1273
|328
Report
AI Summary
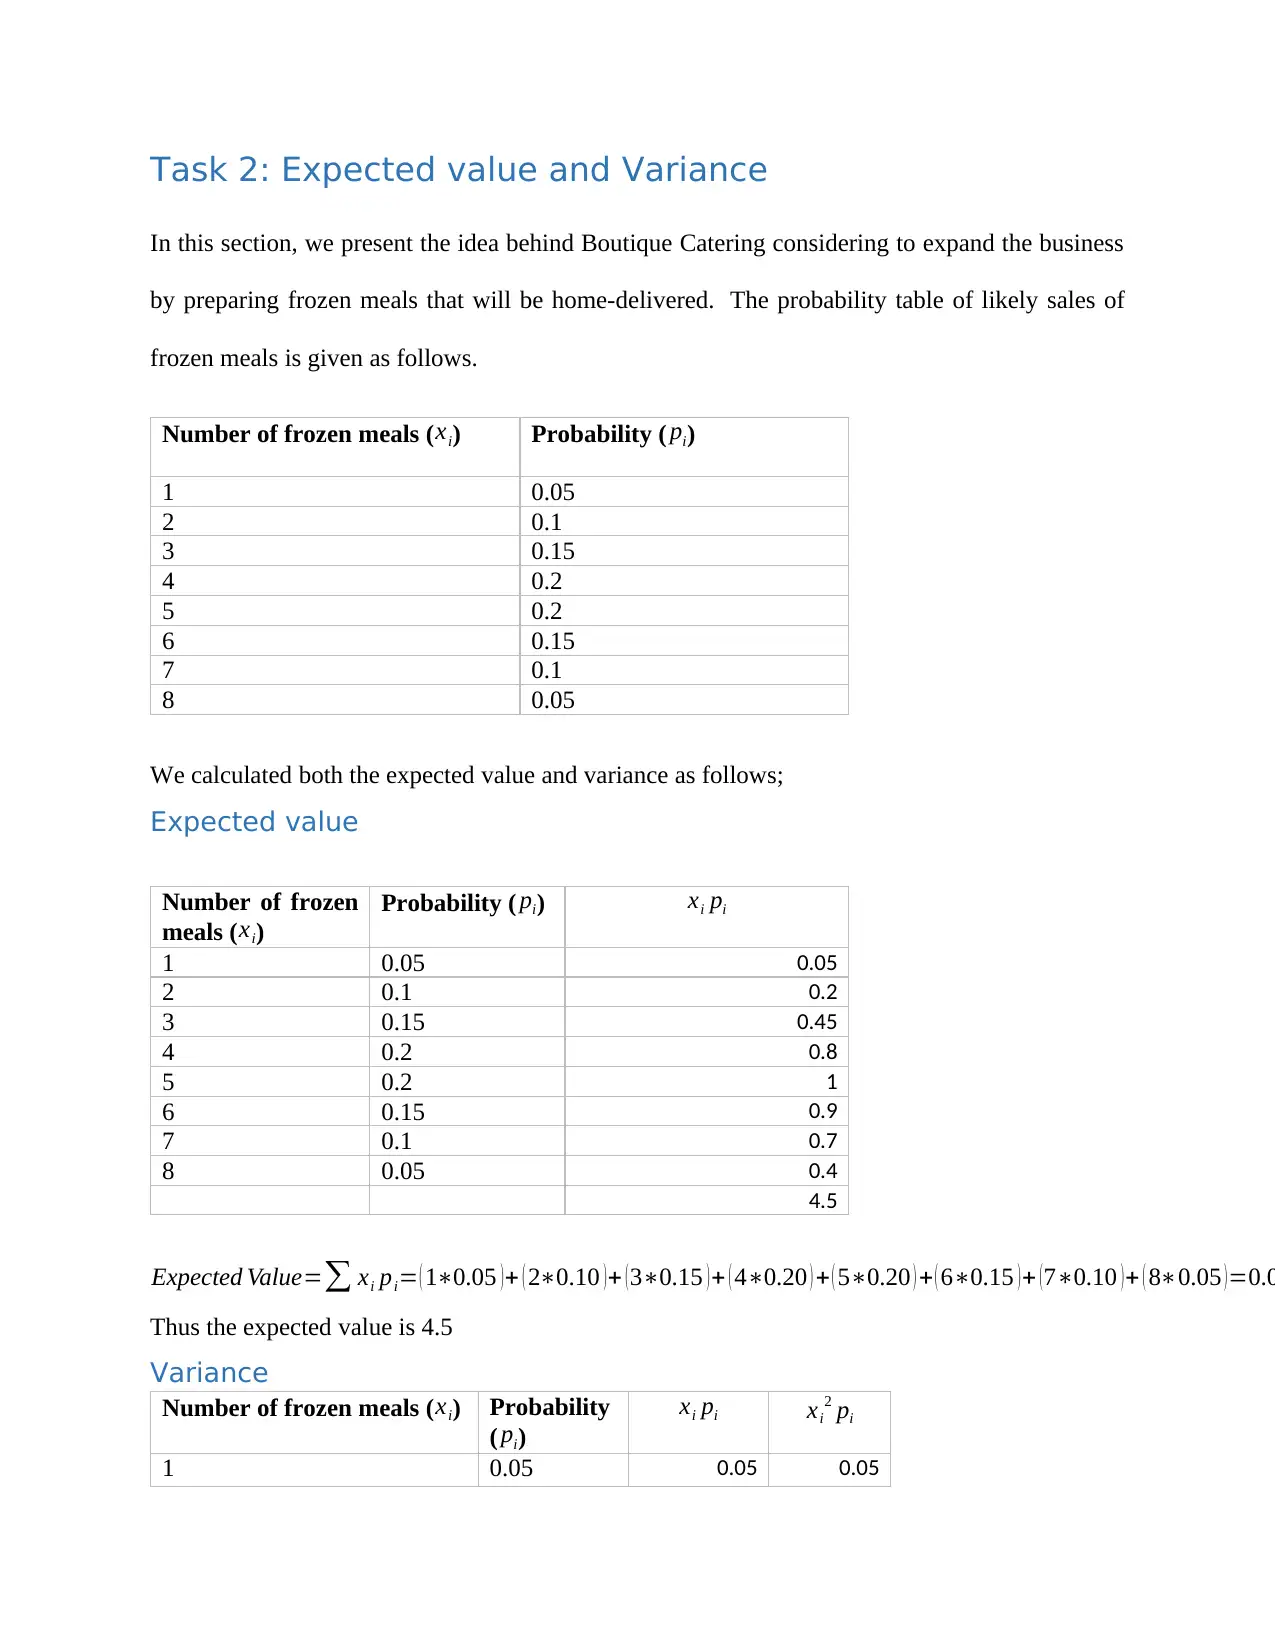
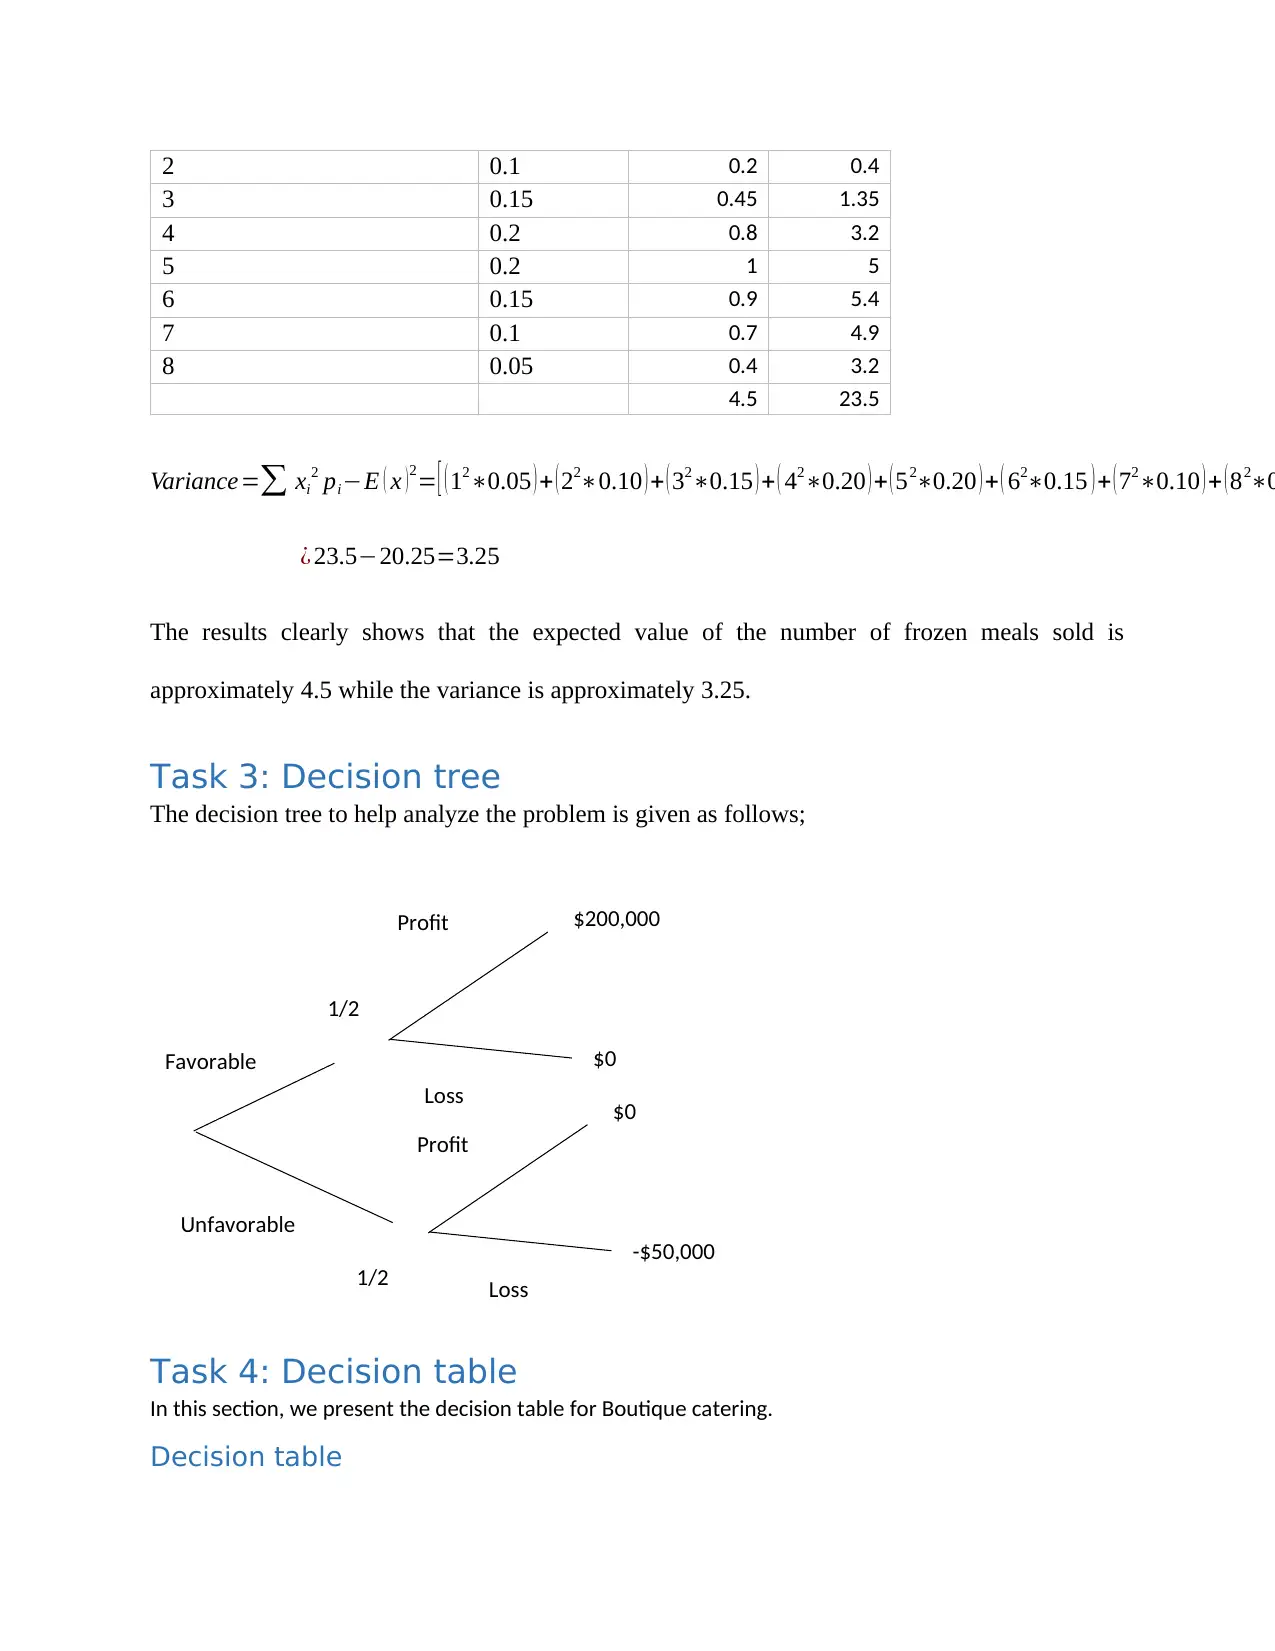
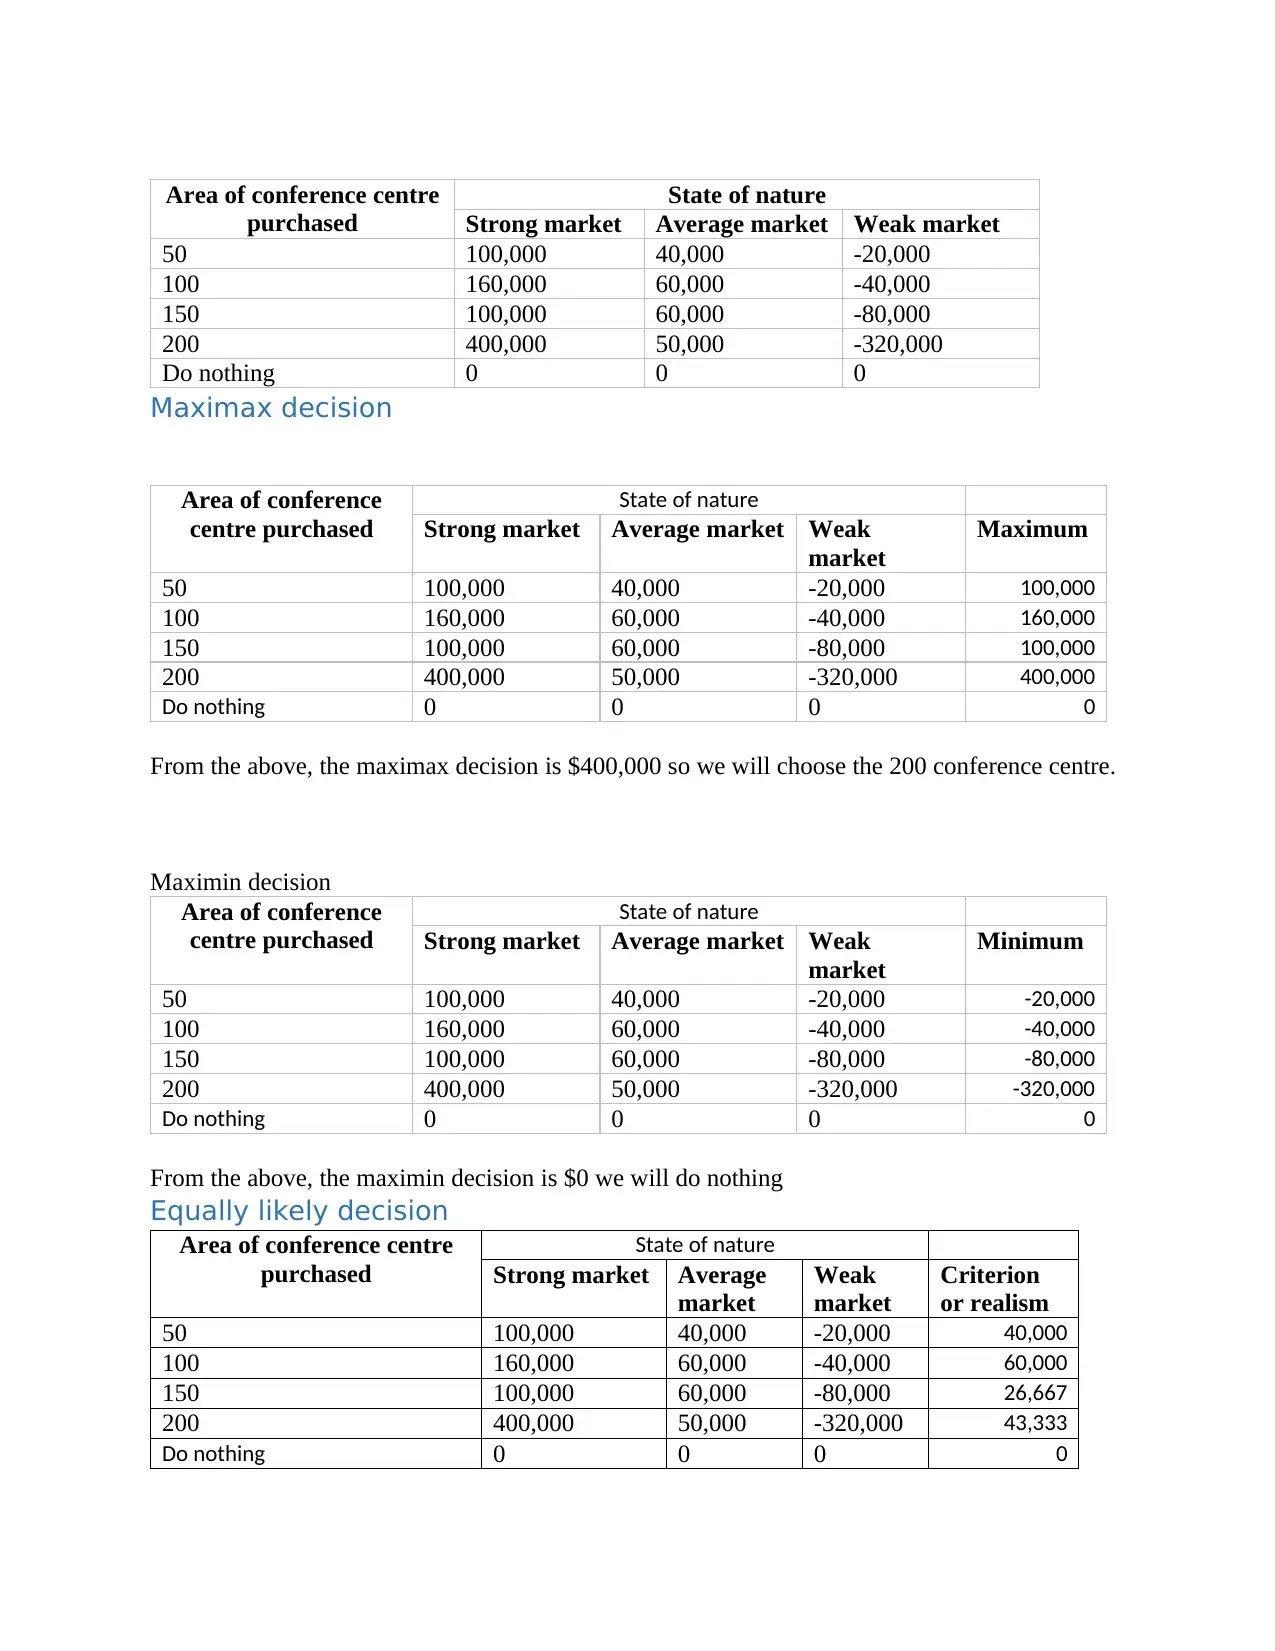
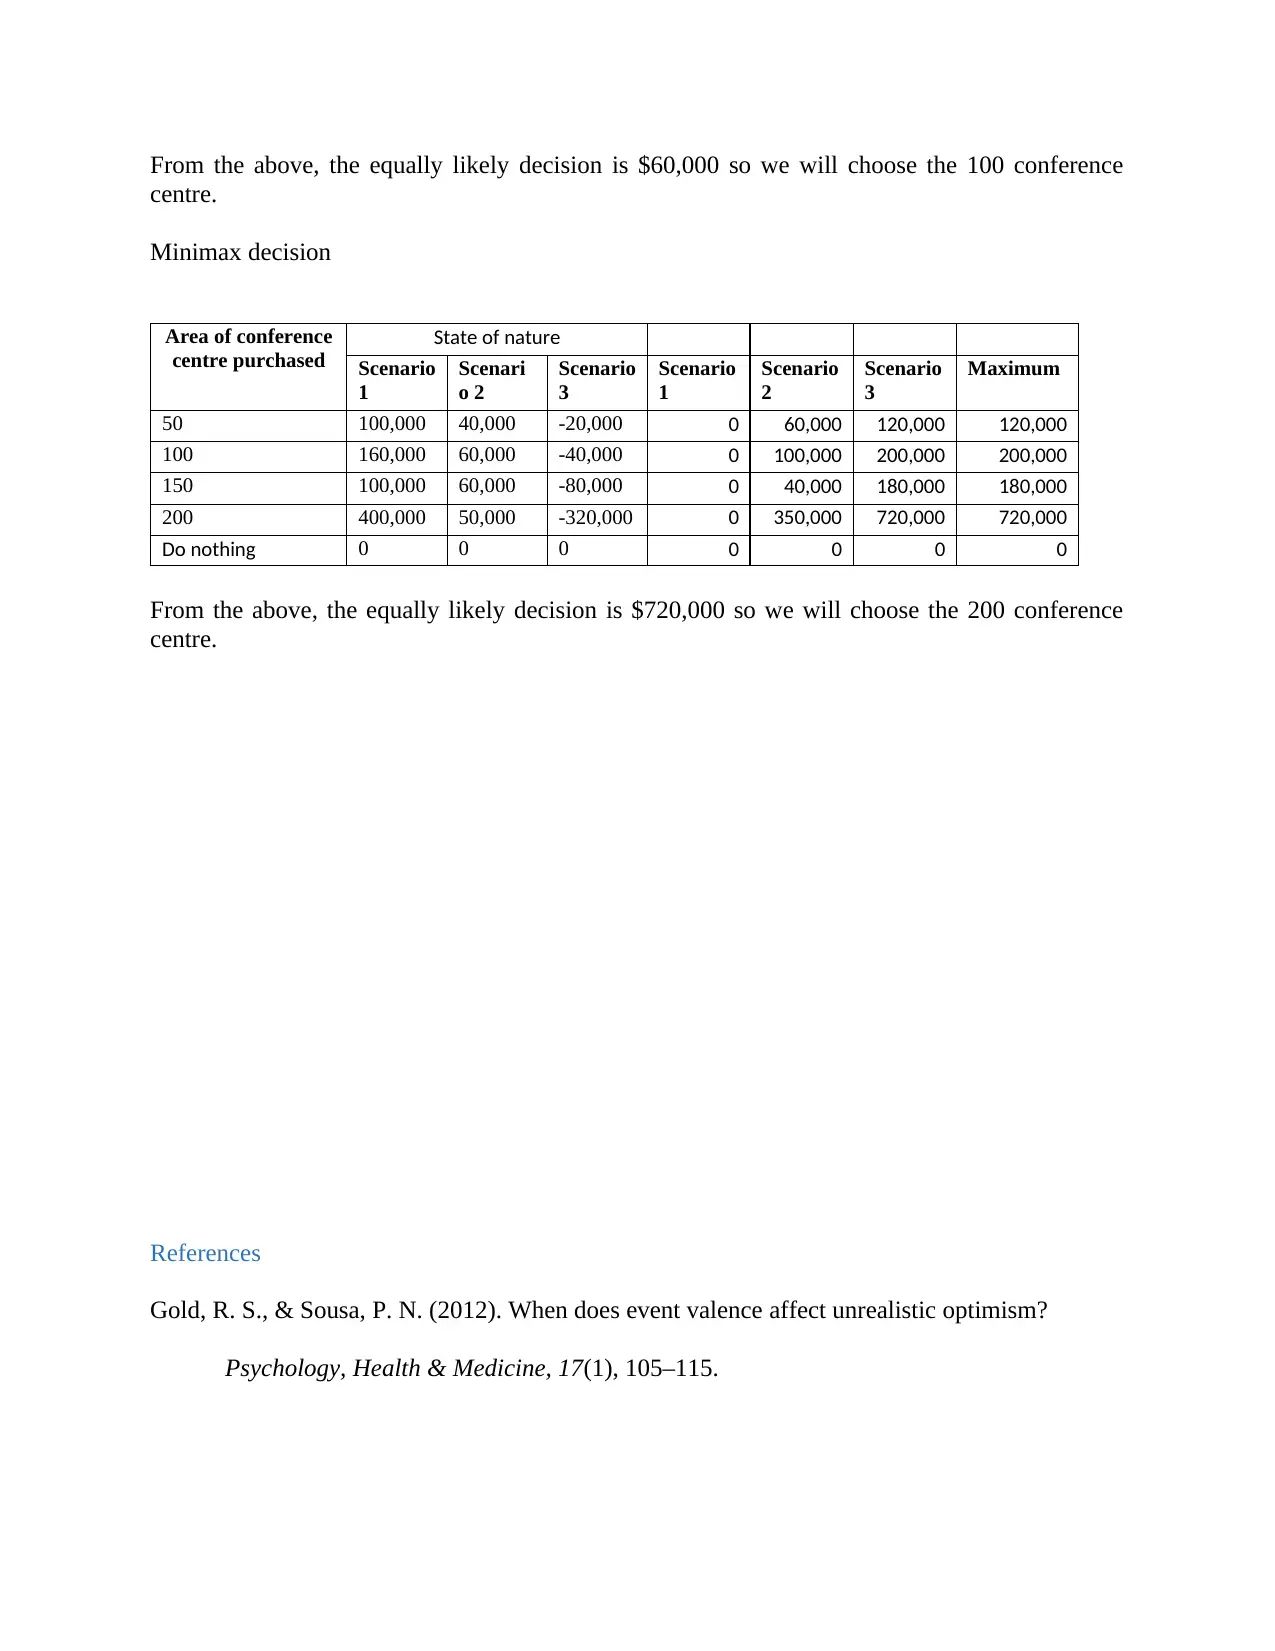
This report analyzes decision support tools for Boutique Catering, a rapidly growing business. It defines key terms like optimistic, pessimistic, criterion of realism, equally likely, and minimax regret, illustrating their relevance to decision-making. The report explores the application of expected value and variance calculations to assess the potential of expanding into frozen meal home delivery. A decision tree is constructed to analyze a specific problem, and a decision table is presented, utilizing maximax, maximin, equally likely, and minimax criteria to evaluate various investment scenarios, such as purchasing different sized conference centers. The report concludes with references to support the analysis and findings, providing a comprehensive overview of decision-making strategies for business growth.

Decision support tools
Student Name:
University Name:
4th August 2019
Student Name:
University Name:
4th August 2019
Paraphrase This Document
Need a fresh take? Get an instant paraphrase of this document with our AI Paraphraser

Table of Contents
Task 1: Definition of terms..........................................................................................................................2
Task 2: Expected value and Variance...........................................................................................................4
Expected value........................................................................................................................................4
Variance...................................................................................................................................................5
Task 3: Decision tree....................................................................................................................................5
Task 4: Decision table..................................................................................................................................6
Decision table..........................................................................................................................................6
Maximax decision....................................................................................................................................6
Equally likely decision..............................................................................................................................7

Task 1: Definition of terms
In this section, we define some terms in relation to the Boutique Catering activities. We provide
explanation to the following terms;
Optimistic
Pessimistic
Criterion of realism
Equally likely
Minimax regret
Optimistic: As Boutique Catering we are optimistic that we will be able to make a choice
option that is within our control as an organization and be able to choose the best payoff
possible. In this case we will have to choose the highest possible payoff which is 8000 and if we
have a payoff of 3000 for the same menu we will choose the new menu as the optimistic decision
we will be making (Pezzo, Litman, & Stephanie, 2016).
Pessimistic: When it comes to pessimistic, the approach is to compare two alternatives with the
lowest possible payoff and pick one which has a better option. Considering two payoffs of the
new menu and that of the same menu given as -500 and 200 respectively, we will go for the
better option which is 200 with the same menu (Gold & Sousa, 2012). So in a pessimistic
approach, we will have to continue with the same menu.
Criteria or realism: In this case, we apply the probability scores for each and every state of
nature. This implies that the payoffs are multiplied with the probability and then sum them up
and do a comparison (Harris , 2016). Example is given as follows;
⊘ This is a preview!⊘
Do you want full access?
Subscribe today to unlock all pages.

Trusted by 1+ million students worldwide

New menu = 0.3*8000 + 0.2*3000 + (-2000)*0.5 = 2000
Same menu = 0.3*3000 + 0.2*2000 + 0.5*1000 = 1800
So the better option is the new menu.
Equally likely: This works same as the criteria of realism. However, instead of variety of
probabilities we should just use (1/3) as probabilities for each of them. This means the total
probabilities are shared between the states of nature.
Minimax regret: In this case decide what our regret will be in case we choose an option and a
state of nature takes place. Since states of nature are not in our control, we can only choose
alternatives. This means if we choose to create a new menu and there is high or medium demand
then we will not regret. However if the demand is low then we will regret that we didn’t choose
to use the same menu and the regret value will be 1000-(2000) = 3000. This way we create the
regret table. The regret table from the example is shown below
High demand Medium demand Low demand
New menu 0 0 3000
Same menu 5000 1000 0
Then compare the maximum regret between the two alternatives. Choose the one with the
smallest regret. That will be new menu. Because the maximum regret of new menu is 3000
against 5000 from same menu.
Paraphrase This Document
Need a fresh take? Get an instant paraphrase of this document with our AI Paraphraser

Task 2: Expected value and Variance
In this section, we present the idea behind Boutique Catering considering to expand the business
by preparing frozen meals that will be home-delivered. The probability table of likely sales of
frozen meals is given as follows.
Number of frozen meals ( xi) Probability ( pi)
1 0.05
2 0.1
3 0.15
4 0.2
5 0.2
6 0.15
7 0.1
8 0.05
We calculated both the expected value and variance as follows;
Expected value
Number of frozen
meals ( xi)
Probability ( pi) xi pi
1 0.05 0.05
2 0.1 0.2
3 0.15 0.45
4 0.2 0.8
5 0.2 1
6 0.15 0.9
7 0.1 0.7
8 0.05 0.4
4.5
Expected Value=∑ xi pi= ( 1∗0.05 )+ ( 2∗0.10 )+ (3∗0.15 )+ ( 4∗0.20 ) + ( 5∗0.20 ) + ( 6∗0.15 )+ (7∗0.10 )+ ( 8∗0.05 )=0.0
Thus the expected value is 4.5
Variance
Number of frozen meals ( xi) Probability
( pi)
xi pi xi
2 pi
1 0.05 0.05 0.05

2 0.1 0.2 0.4
3 0.15 0.45 1.35
4 0.2 0.8 3.2
5 0.2 1 5
6 0.15 0.9 5.4
7 0.1 0.7 4.9
8 0.05 0.4 3.2
4.5 23.5
Variance=∑ xi
2 pi−E ( x ) 2= [ ( 12∗0.05 ) + ( 22∗0.10 ) + ( 32∗0.15 ) + ( 42∗0.20 ) + ( 52∗0.20 ) + ( 62∗0.15 ) + ( 72∗0.10 ) + ( 82∗0
¿ 23.5−20.25=3.25
The results clearly shows that the expected value of the number of frozen meals sold is
approximately 4.5 while the variance is approximately 3.25.
Task 3: Decision tree
The decision tree to help analyze the problem is given as follows;
Task 4: Decision table
In this section, we present the decision table for Boutique catering.
Decision table
$200,000
$0
$0
-$50,000
1/2
Unfavorable
Favorable
1/2
Profit
Loss
Profit
Loss
⊘ This is a preview!⊘
Do you want full access?
Subscribe today to unlock all pages.

Trusted by 1+ million students worldwide

Area of conference centre
purchased
State of nature
Strong market Average market Weak market
50 100,000 40,000 -20,000
100 160,000 60,000 -40,000
150 100,000 60,000 -80,000
200 400,000 50,000 -320,000
Do nothing 0 0 0
Maximax decision
Area of conference
centre purchased
State of nature
Strong market Average market Weak
market
Maximum
50 100,000 40,000 -20,000 100,000
100 160,000 60,000 -40,000 160,000
150 100,000 60,000 -80,000 100,000
200 400,000 50,000 -320,000 400,000
Do nothing 0 0 0 0
From the above, the maximax decision is $400,000 so we will choose the 200 conference centre.
Maximin decision
Area of conference
centre purchased
State of nature
Strong market Average market Weak
market
Minimum
50 100,000 40,000 -20,000 -20,000
100 160,000 60,000 -40,000 -40,000
150 100,000 60,000 -80,000 -80,000
200 400,000 50,000 -320,000 -320,000
Do nothing 0 0 0 0
From the above, the maximin decision is $0 we will do nothing
Equally likely decision
Area of conference centre
purchased
State of nature
Strong market Average
market
Weak
market
Criterion
or realism
50 100,000 40,000 -20,000 40,000
100 160,000 60,000 -40,000 60,000
150 100,000 60,000 -80,000 26,667
200 400,000 50,000 -320,000 43,333
Do nothing 0 0 0 0
purchased
State of nature
Strong market Average market Weak market
50 100,000 40,000 -20,000
100 160,000 60,000 -40,000
150 100,000 60,000 -80,000
200 400,000 50,000 -320,000
Do nothing 0 0 0
Maximax decision
Area of conference
centre purchased
State of nature
Strong market Average market Weak
market
Maximum
50 100,000 40,000 -20,000 100,000
100 160,000 60,000 -40,000 160,000
150 100,000 60,000 -80,000 100,000
200 400,000 50,000 -320,000 400,000
Do nothing 0 0 0 0
From the above, the maximax decision is $400,000 so we will choose the 200 conference centre.
Maximin decision
Area of conference
centre purchased
State of nature
Strong market Average market Weak
market
Minimum
50 100,000 40,000 -20,000 -20,000
100 160,000 60,000 -40,000 -40,000
150 100,000 60,000 -80,000 -80,000
200 400,000 50,000 -320,000 -320,000
Do nothing 0 0 0 0
From the above, the maximin decision is $0 we will do nothing
Equally likely decision
Area of conference centre
purchased
State of nature
Strong market Average
market
Weak
market
Criterion
or realism
50 100,000 40,000 -20,000 40,000
100 160,000 60,000 -40,000 60,000
150 100,000 60,000 -80,000 26,667
200 400,000 50,000 -320,000 43,333
Do nothing 0 0 0 0
Paraphrase This Document
Need a fresh take? Get an instant paraphrase of this document with our AI Paraphraser

From the above, the equally likely decision is $60,000 so we will choose the 100 conference
centre.
Minimax decision
Area of conference
centre purchased
State of nature
Scenario
1
Scenari
o 2
Scenario
3
Scenario
1
Scenario
2
Scenario
3
Maximum
50 100,000 40,000 -20,000 0 60,000 120,000 120,000
100 160,000 60,000 -40,000 0 100,000 200,000 200,000
150 100,000 60,000 -80,000 0 40,000 180,000 180,000
200 400,000 50,000 -320,000 0 350,000 720,000 720,000
Do nothing 0 0 0 0 0 0 0
From the above, the equally likely decision is $720,000 so we will choose the 200 conference
centre.
References
Gold, R. S., & Sousa, P. N. (2012). When does event valence affect unrealistic optimism?
Psychology, Health & Medicine, 17(1), 105–115.
centre.
Minimax decision
Area of conference
centre purchased
State of nature
Scenario
1
Scenari
o 2
Scenario
3
Scenario
1
Scenario
2
Scenario
3
Maximum
50 100,000 40,000 -20,000 0 60,000 120,000 120,000
100 160,000 60,000 -40,000 0 100,000 200,000 200,000
150 100,000 60,000 -80,000 0 40,000 180,000 180,000
200 400,000 50,000 -320,000 0 350,000 720,000 720,000
Do nothing 0 0 0 0 0 0 0
From the above, the equally likely decision is $720,000 so we will choose the 200 conference
centre.
References
Gold, R. S., & Sousa, P. N. (2012). When does event valence affect unrealistic optimism?
Psychology, Health & Medicine, 17(1), 105–115.

Harris , P. (2016). Sufficient grounds for optimism?: The relationship between perceived
controllability and optimistic bias. Journal of Social and Clinical Psychology, 15(1), 9–
52.
Pezzo, M. V., Litman, J. A., & Stephanie, P. (2016). On the distinction between yuppies and
hippies: Individual differences in prediction biases for planning future tasks. Personality
and Individual Differences, 41(7), 1359–1371.
⊘ This is a preview!⊘
Do you want full access?
Subscribe today to unlock all pages.

Trusted by 1+ million students worldwide
1 out of 9
Related Documents
Your All-in-One AI-Powered Toolkit for Academic Success.
+13062052269
info@desklib.com
Available 24*7 on WhatsApp / Email
Unlock your academic potential
Copyright © 2020–2025 A2Z Services. All Rights Reserved. Developed and managed by ZUCOL.


