Decision Support Tools Assessment - Analysis and Solutions Report

Verified

Added on  2020/03/23

|17
|906
|342
Homework Assignment
AI Summary
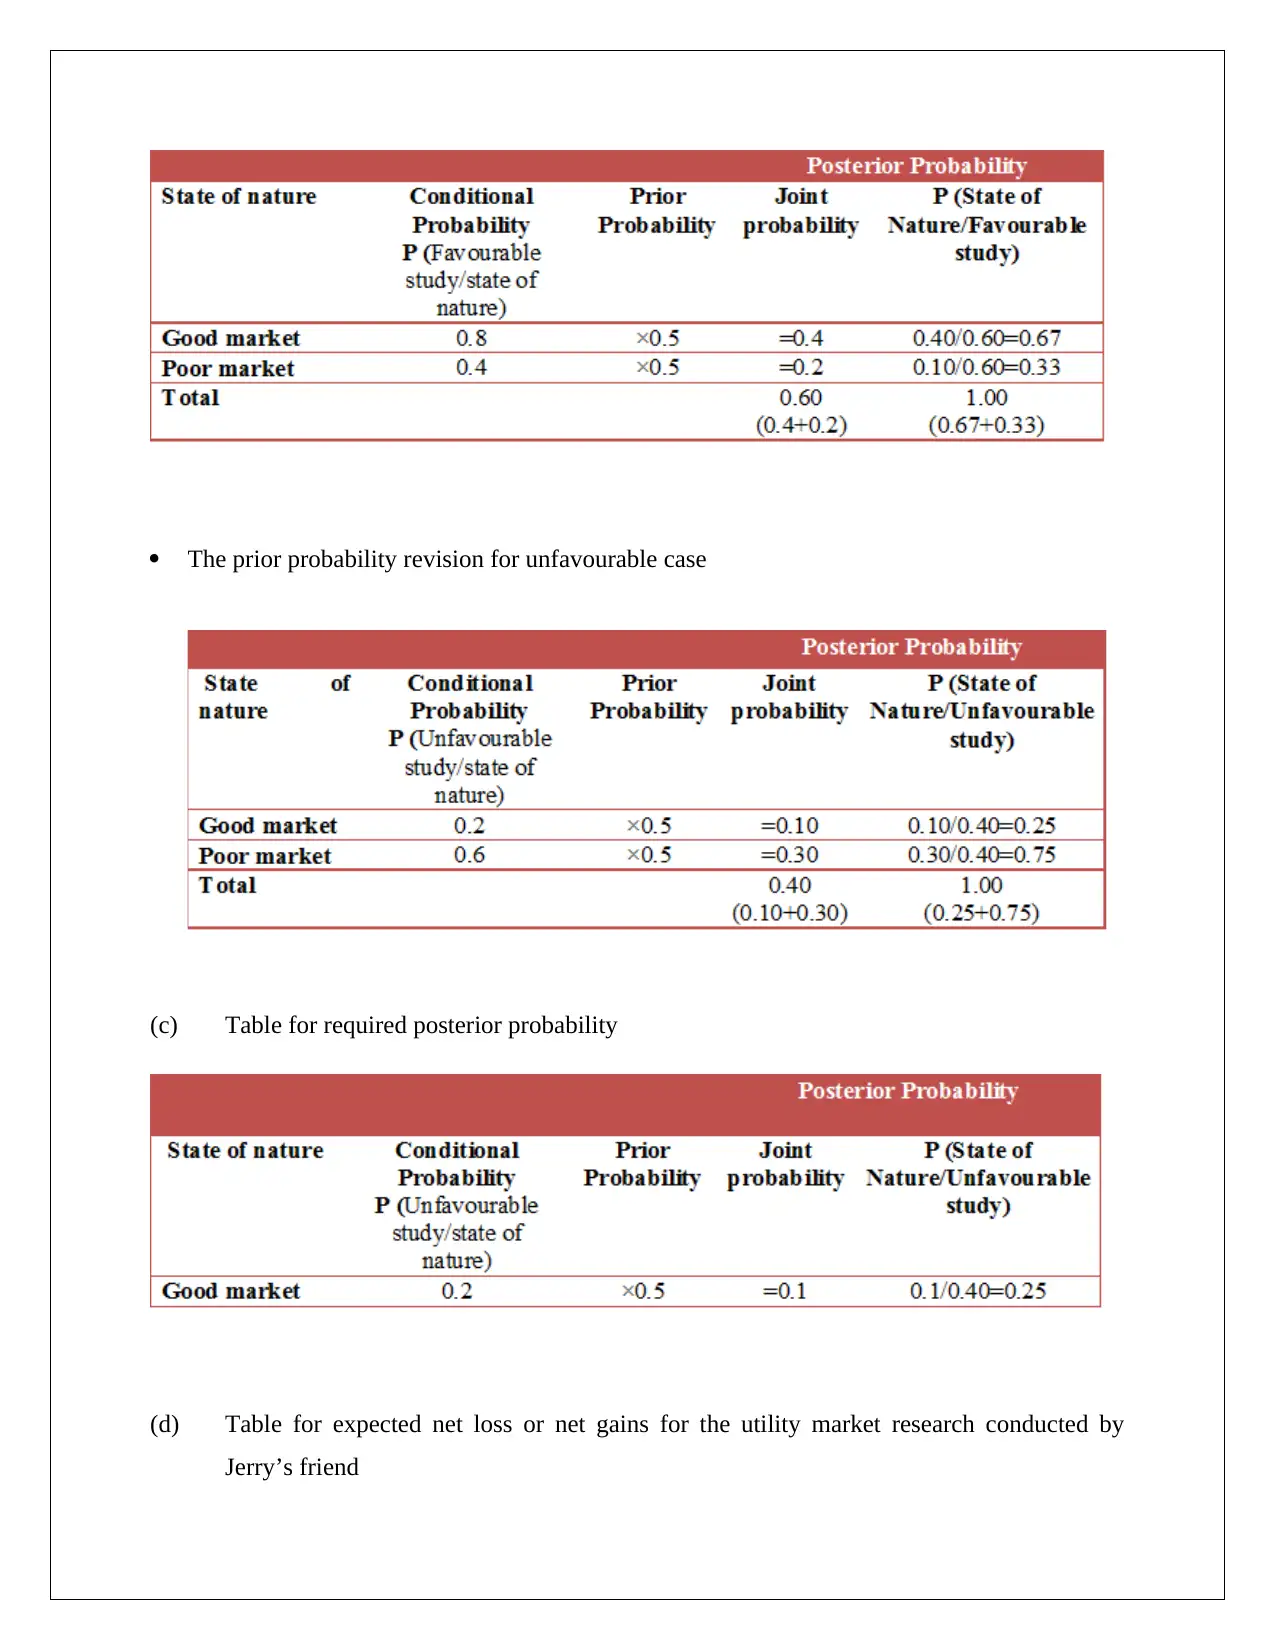
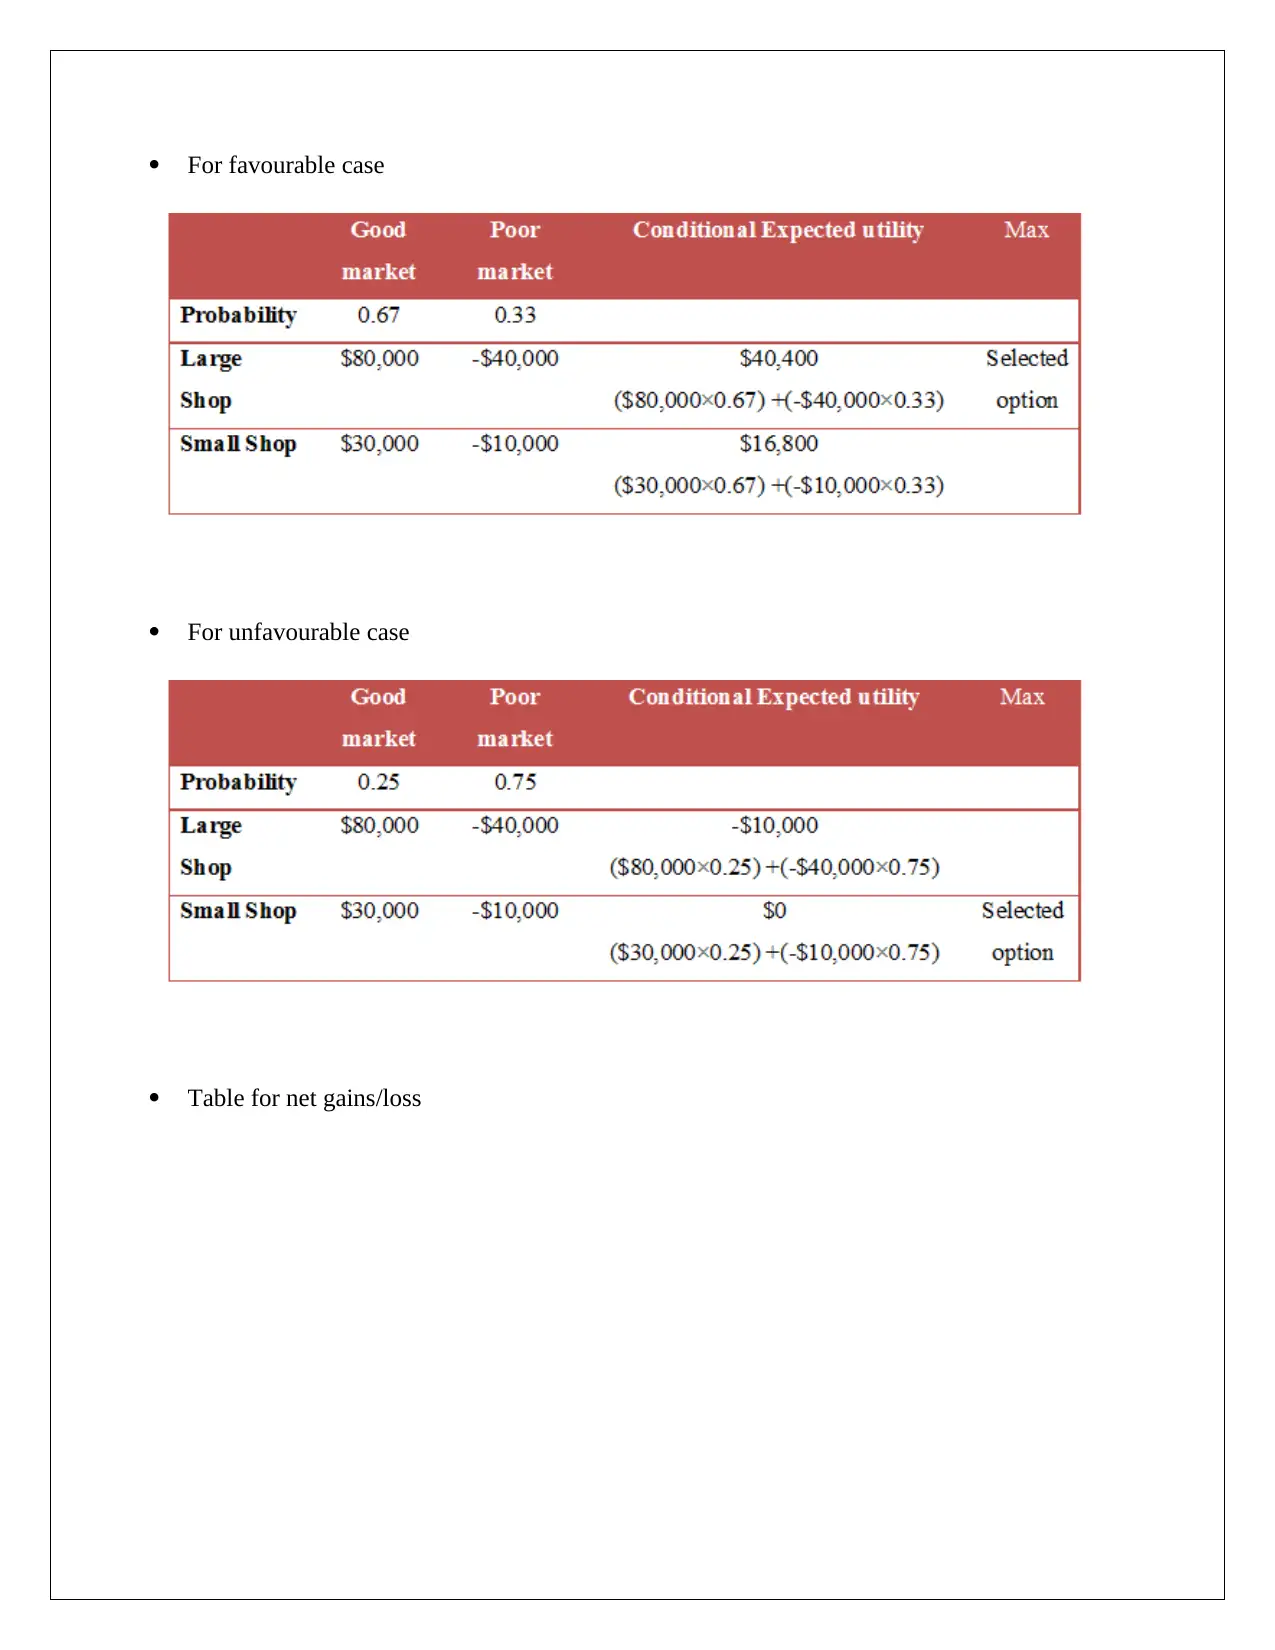
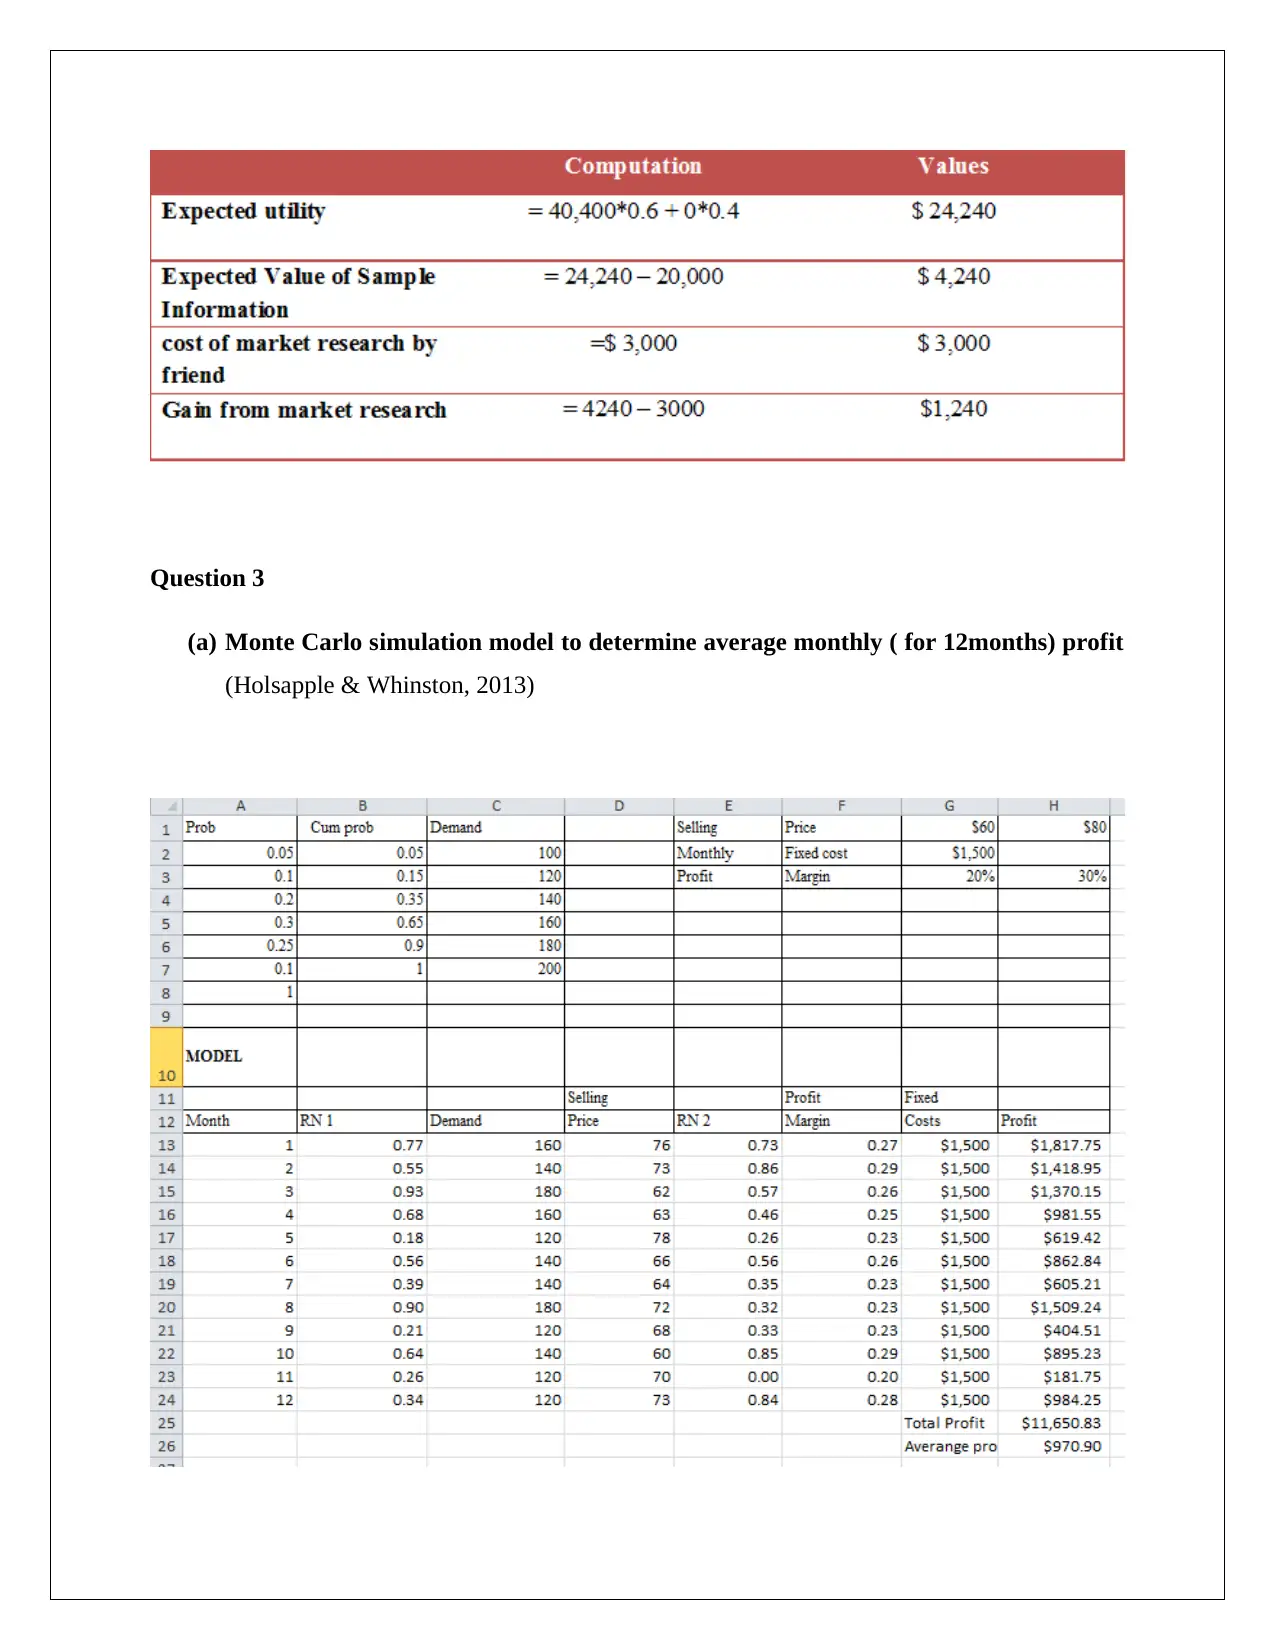
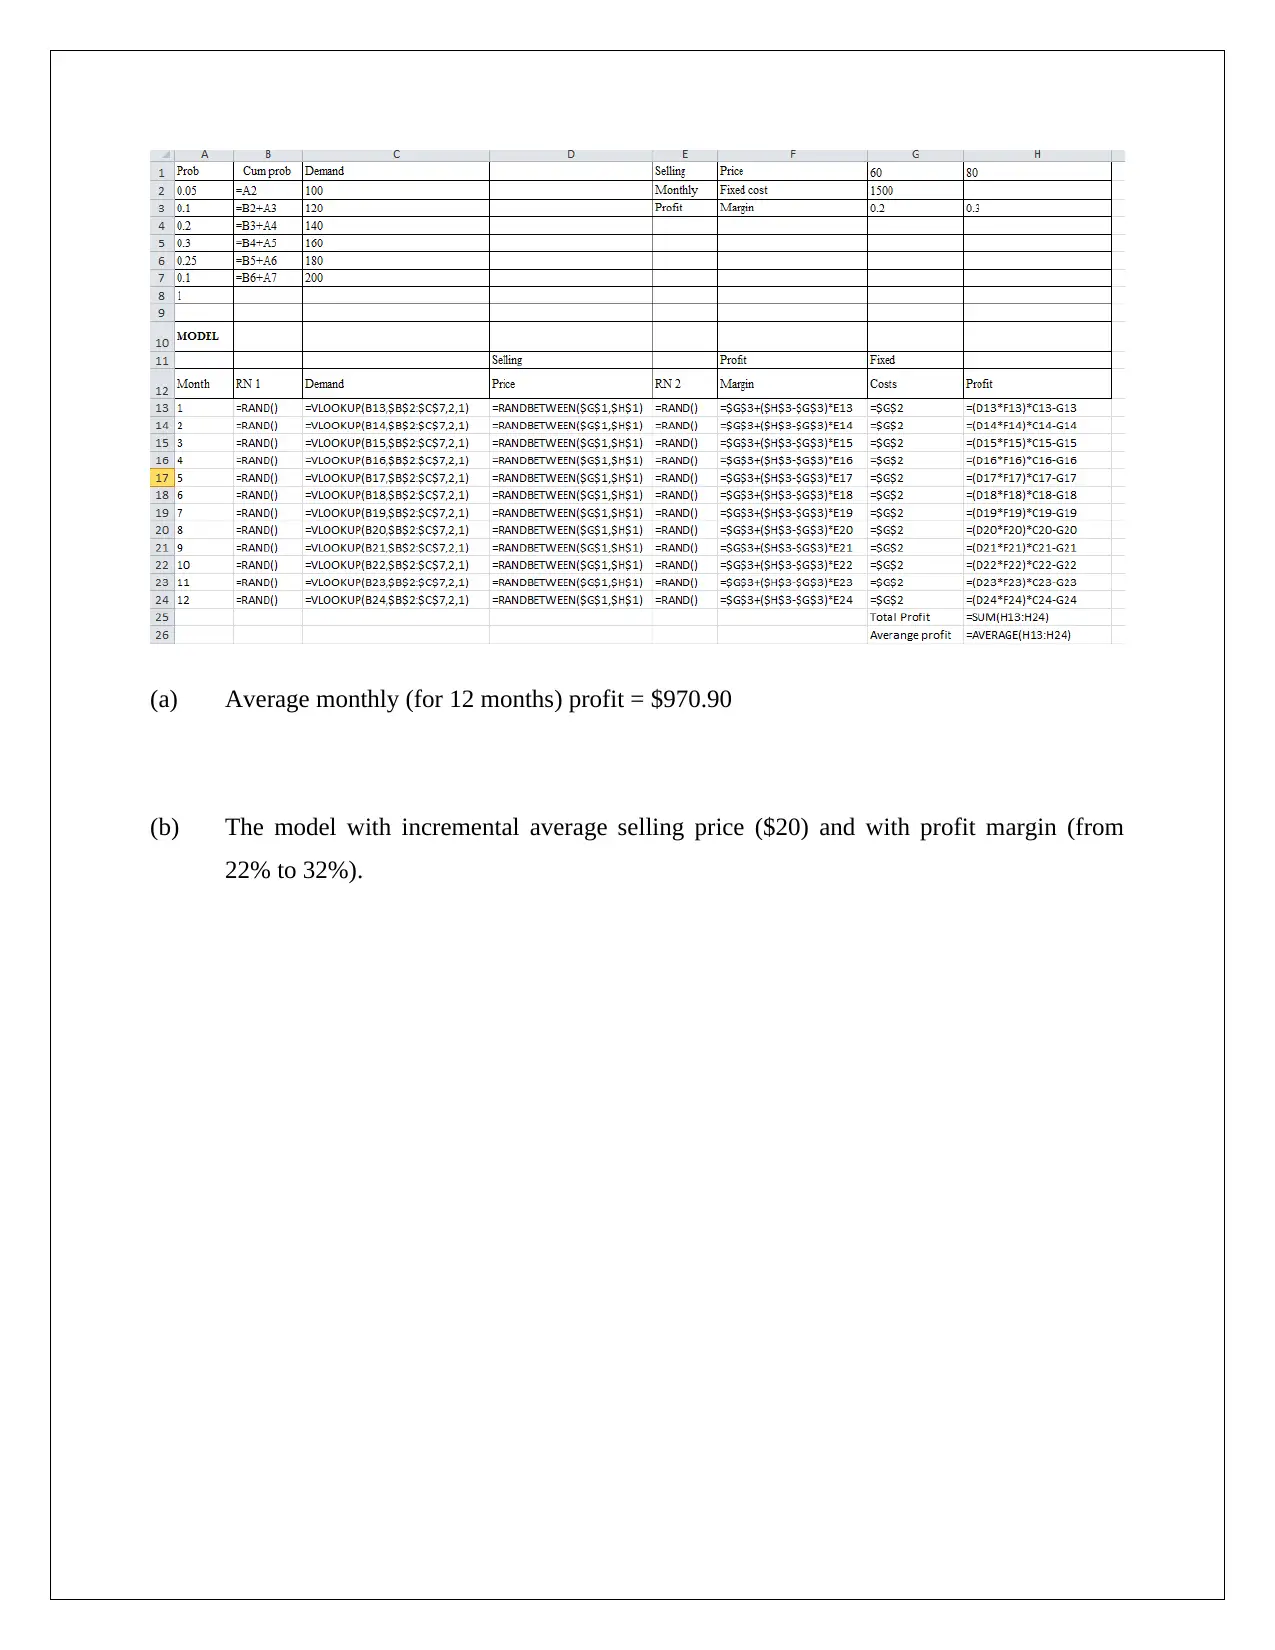
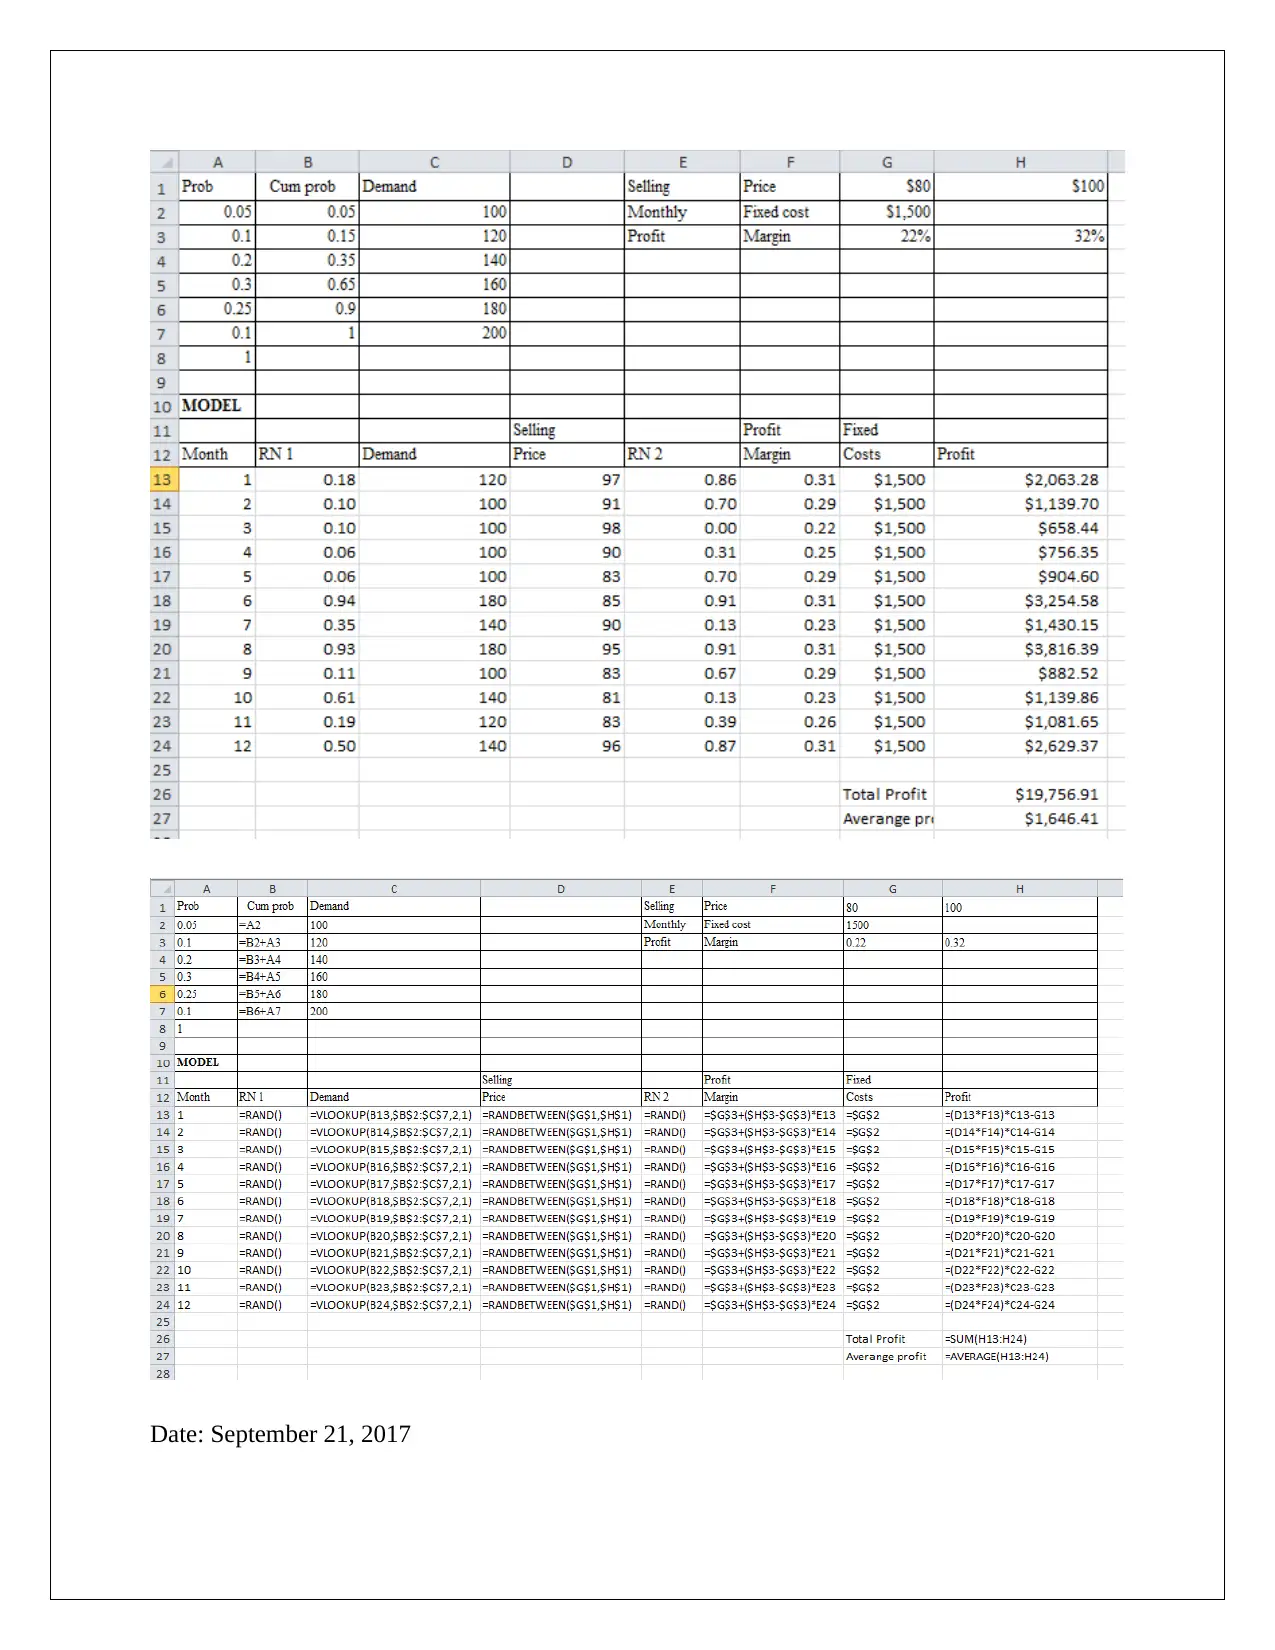
This document presents a detailed analysis and solutions for a Decision Support Tools assessment. The assignment covers various aspects of business decision-making, including investment strategies using optimist, pessimist, and regret criteria, as well as the computation of expected monetary values. It also includes profit calculations for a business, prior probability revision, and the application of Monte Carlo simulation for determining average monthly profit. Furthermore, the assessment involves the application of the high-low method for overhead cost computation, regression analysis, and break-even point analysis. The document provides step-by-step solutions, calculations, and interpretations to guide students through the complexities of decision support tools in a business context. References are also provided for further reading and understanding of the concepts discussed.
Document Page
DECISION SUPPORT TOOLS
Assessment - 3
[Pick the date]
Student id and name
tabler-icon-diamond-filled.svg

Paraphrase This Document

Need a fresh take? Get an instant paraphrase of this document with our AI Paraphraser
Document Page
Question 1
(a)
(b)
(1) Optimist will select share market which is apparent from the below highlighted table:
(2) Pessimist will select bonds which are apparent from the below highlighted table:
Document Page
(3) By taking the effect of criteria of regret the selected investment would be Real Estate which
are apparent from the below highlighted table (Mittra, 2006).
(4) Computation of expected monetary values for investment options is highlighted below:
Highest expected monetary value is for “Bonds” hence, this is the best option for investment.
(5) Expected value of perfect information
Question 2
Document Page
(a) Profit computation for each shop
It is apparent that large shop would result prominent profit and therefore, Jerry should open a
large bicycle shop.
(b) Table to represent prior probability revision
The prior probability revision for favourable case
tabler-icon-diamond-filled.svg

Paraphrase This Document

Need a fresh take? Get an instant paraphrase of this document with our AI Paraphraser
Document Page
The prior probability revision for unfavourable case
(c) Table for required posterior probability
(d) Table for expected net loss or net gains for the utility market research conducted by
Jerry’s friend
Document Page
For favourable case
For unfavourable case
Table for net gains/loss
Document Page
Question 3
(a) Monte Carlo simulation model to determine average monthly ( for 12months) profit
(Holsapple & Whinston, 2013)
tabler-icon-diamond-filled.svg

Paraphrase This Document

Need a fresh take? Get an instant paraphrase of this document with our AI Paraphraser
Document Page
(a) Average monthly (for 12 months) profit = $970.90
(b) The model with incremental average selling price ($20) and with profit margin (from
22% to 32%).
Document Page
Date: September 21, 2017
Document Page
To: Manager, Tully Tyres
Dear Sir
The simulation model has been suitable amended to price in the average rise of $ 20 which has
led to surge in the profit margins and higher profit generation for the company. However, despite
the positives of this move, I would like to take your attention towards a major assumption that
forms the lynchpin of the above analysis. It is estimated that the price increase would not have
any impact on sales and product demand which seems counterintuitive. Hence, the following
measures are advisable.
Carry a pilot study with increased price to witness the impact on sales
Vigilant monitoring of the daily sales to measure any dip on sales.
Consideration to the likely response from the competitors to this move by the company
The above measures would ensure that any potential adverse impact of the move would be
minimised.
Yours Sincerely
STUDENT NAME
Question 4
(a) Computation of over-head cost through high- low method
Variable cost (VC) per unit manufactured = (48000-46000)/ (3800-1800)=$1.00
Fixed cost (FC) = =48000-(3800*1)=$44,200
Regression equation for high- low method
MH= 3000 hours
tabler-icon-diamond-filled.svg

Paraphrase This Document

Need a fresh take? Get an instant paraphrase of this document with our AI Paraphraser
Document Page
¿head cost=44200+ { ( 13000 ) }
¿head cost=$ 47,20 0
(b) The regression analysis
First model by taking overhead cost (dependent) and machine hours (independent variable)
Analyse and Comment:
R square = 0.0109
The low R square coupled with lack of significance of the regression model (From ANOVA
output) and lack of significance of slope (MH p value > 0.05) hints at the model not being
suitable for estimating overheads cost.
Document Page
Second model by taking overhead cost (dependent) and batches (independent variable)
Analyse and Comment:
R square = 0.8313
The high R square coupled with significance of the regression model (From ANOVA output) and
significance of slope (MH p value < 0.05) hints at the model being suitable for estimating
overheads cost (Halhn & Doganaksoy,2011).
Third model by taking overhead cost (dependent) and machine hours and batches
(independent variables)
chevron_up_icon
1 out of 17
circle_padding
hide_on_mobile
zoom_out_icon
[object Object]