Air Conditioning Experiment Report: Cooling and Dehumidification

Verified

Added on  2021/07/28

|9
|1110
|395
Practical Assignment
AI Summary
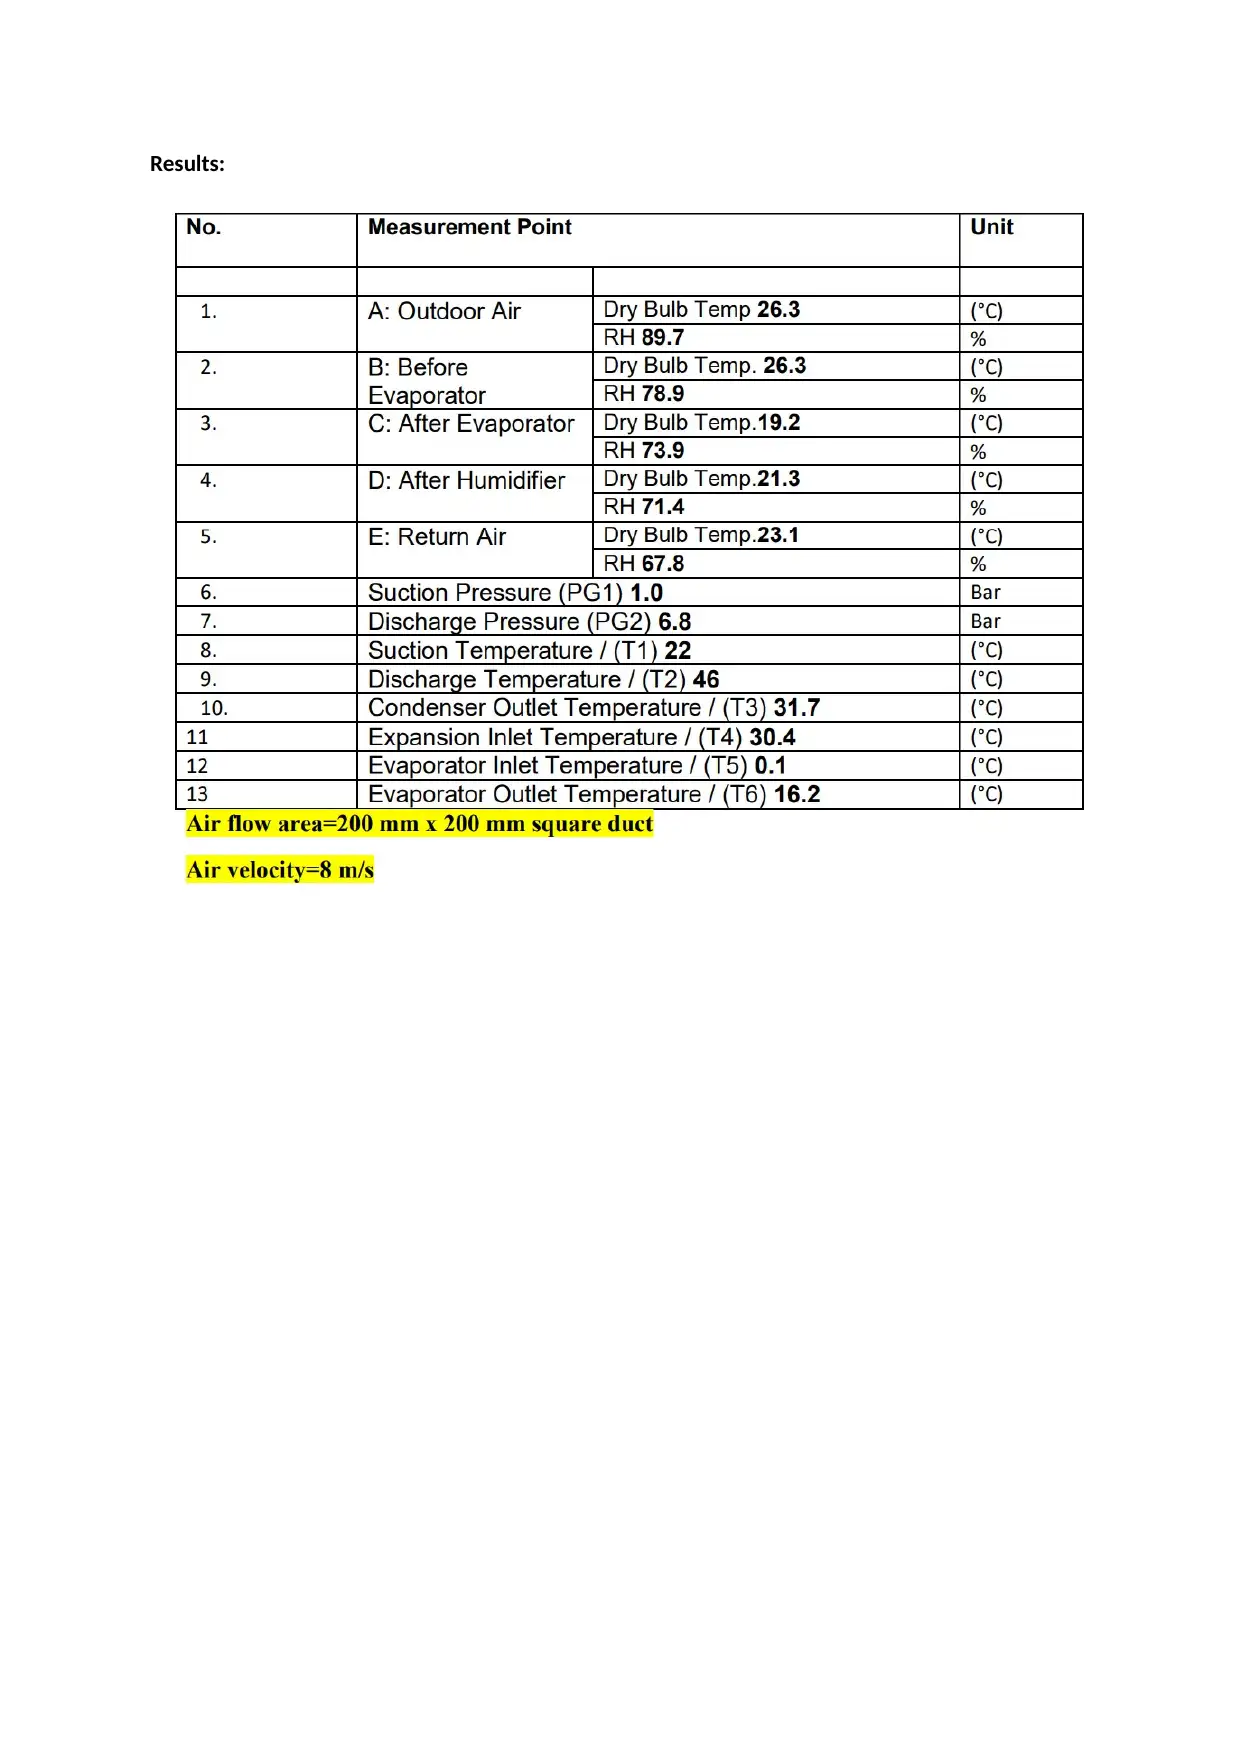
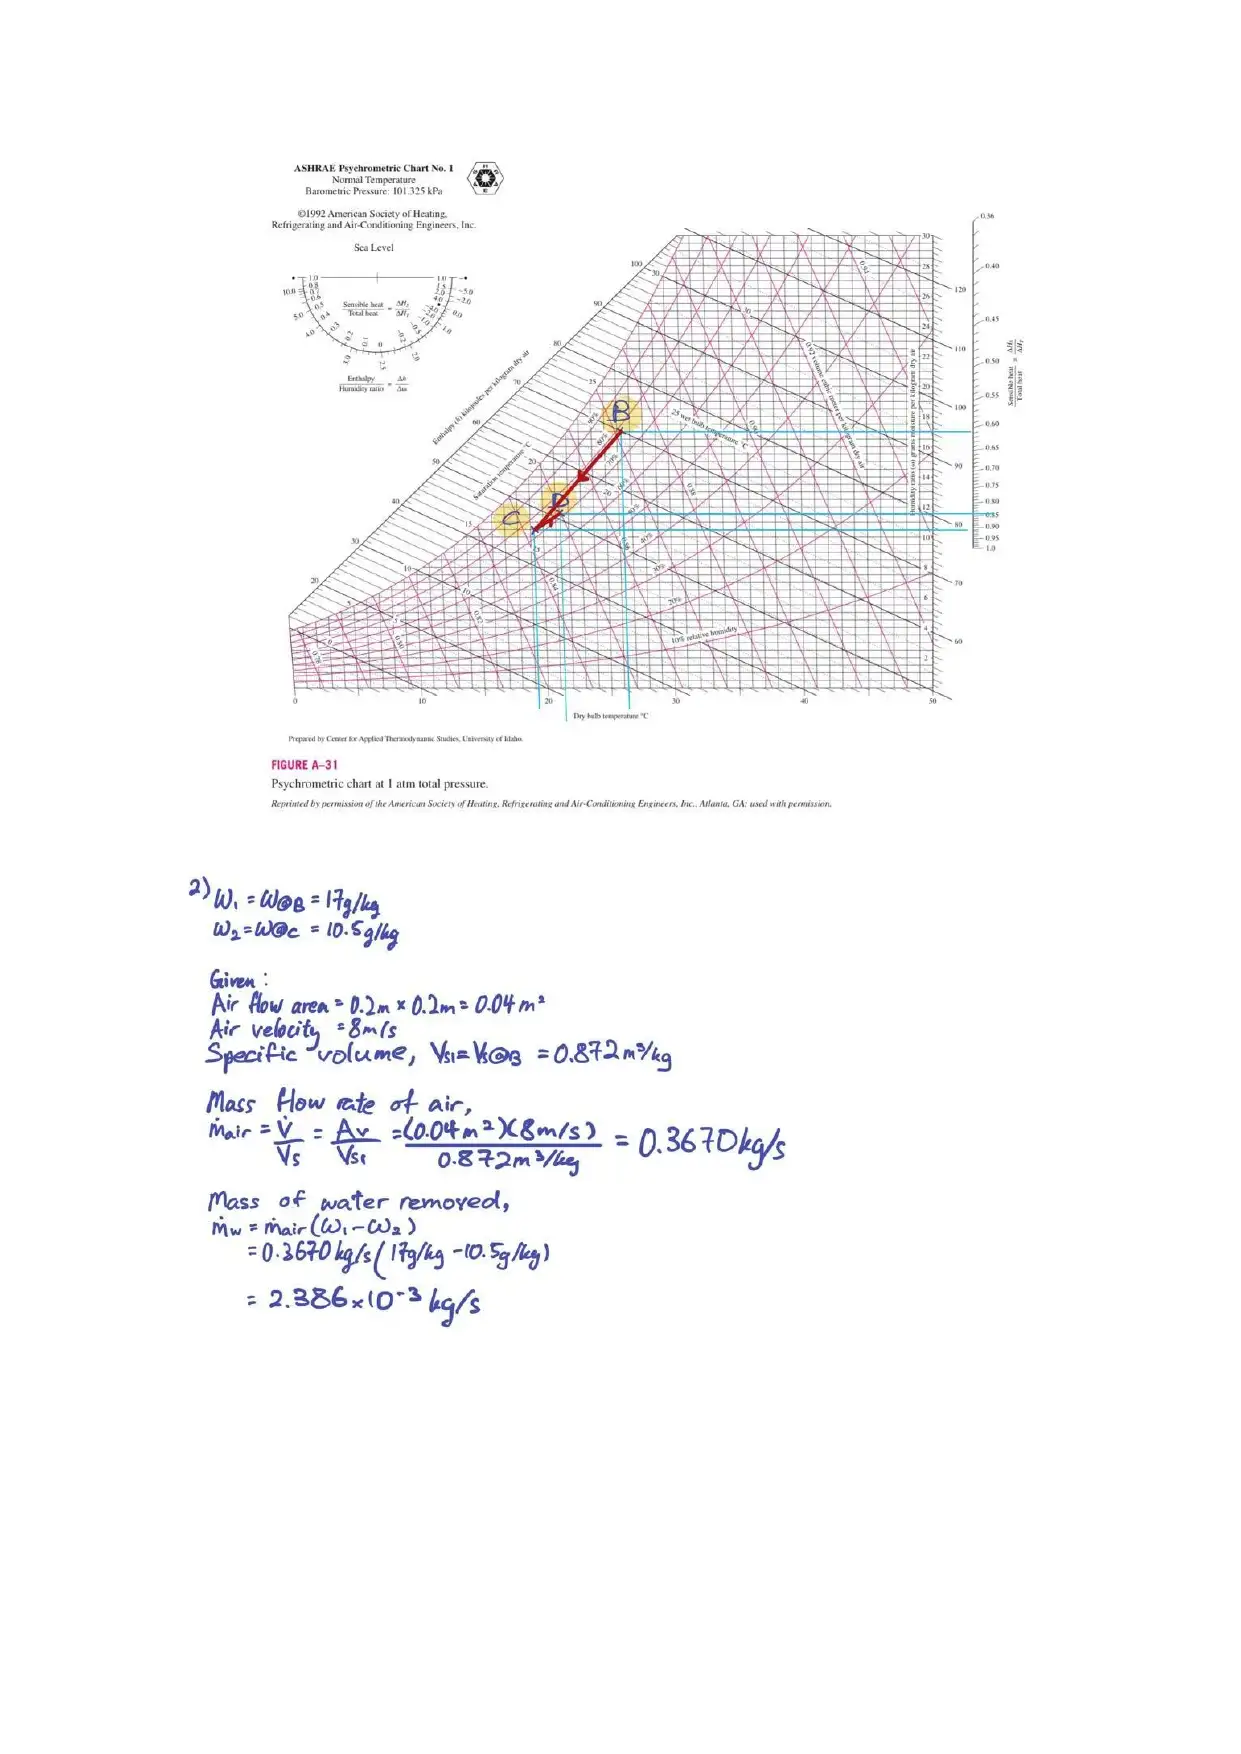
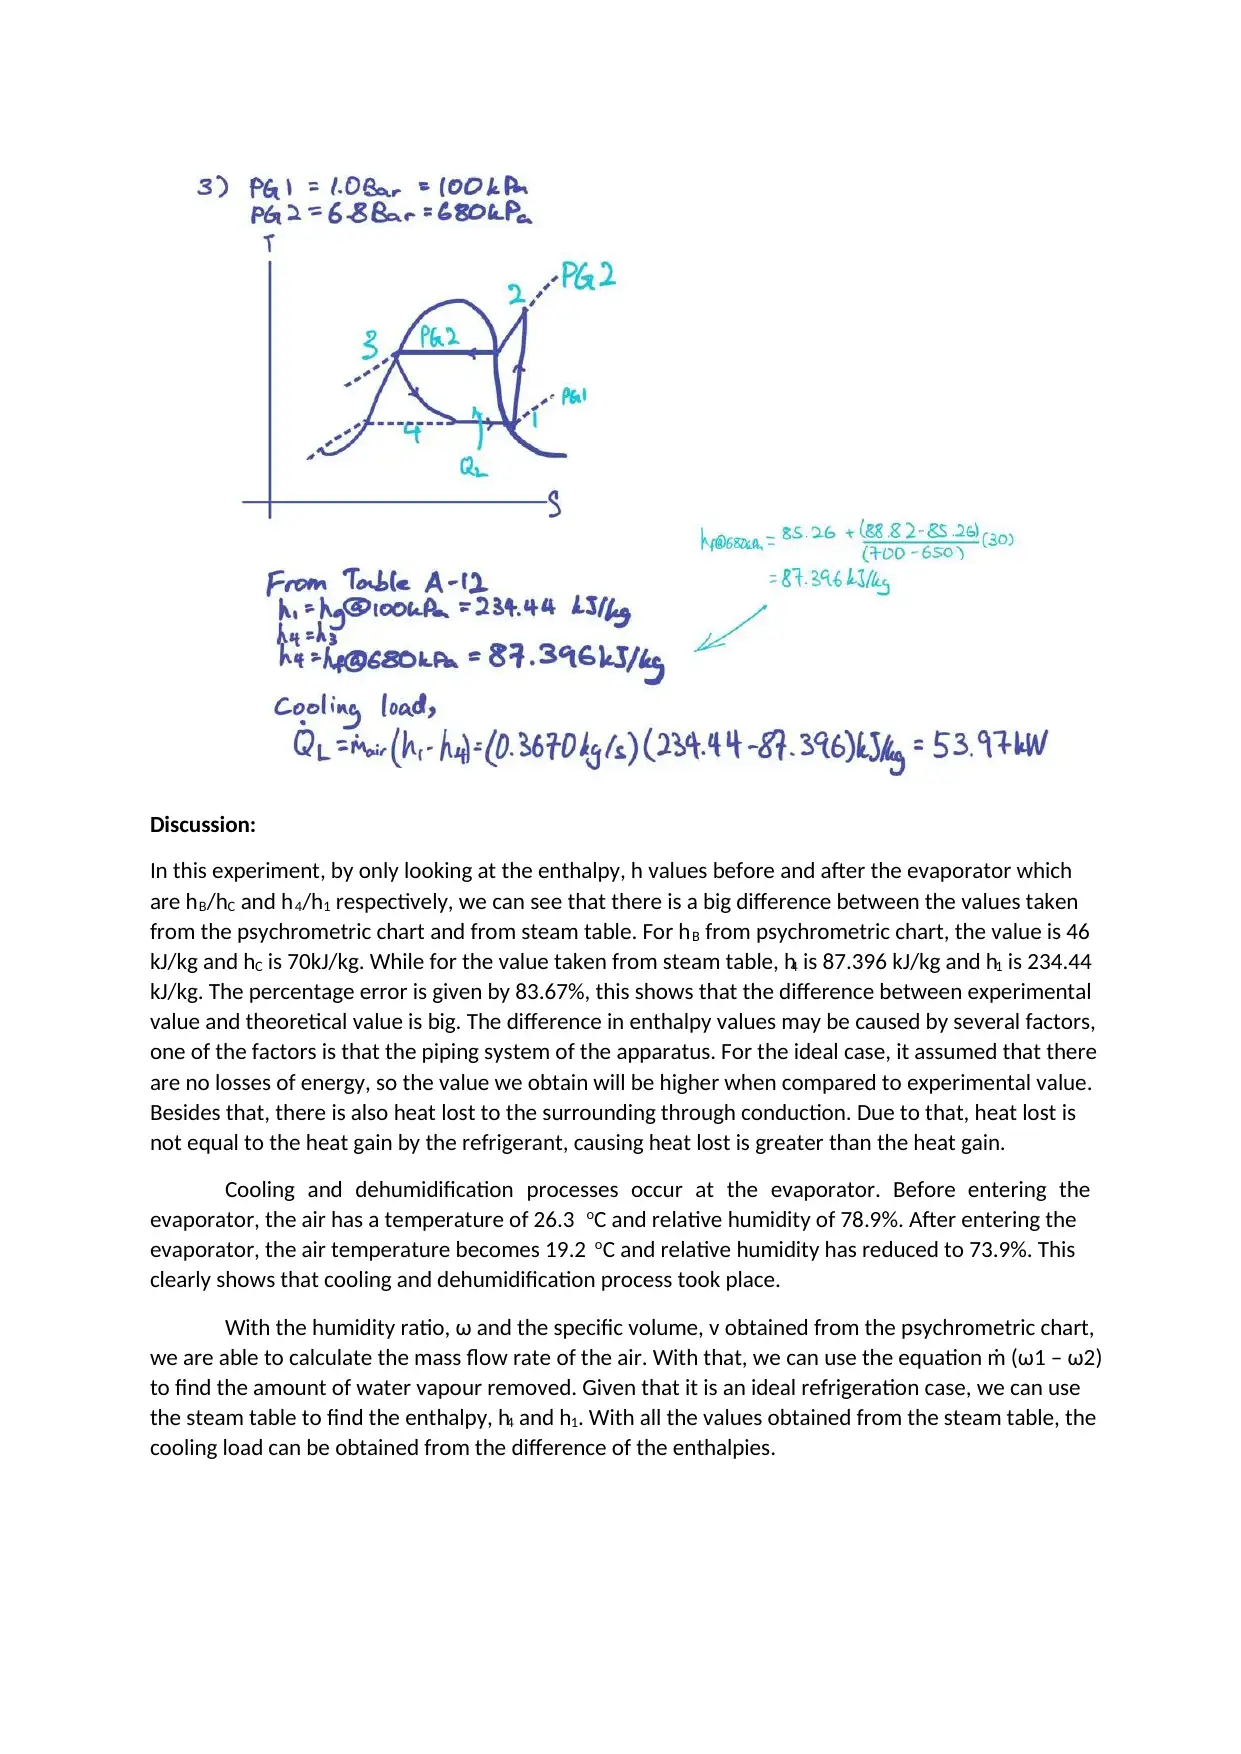
This report details an experiment on the cooling and dehumidification of air using an air conditioning unit. The experiment aimed to familiarize the student with the psychrometric chart and determine thermodynamic properties like dry bulb temperature, specific humidity, relative humidity, specific volume, and enthalpy. The report includes an overview of the air conditioning unit, the refrigeration cycle, and the cooling and dehumidification process within the evaporator. Results are presented, comparing experimental and theoretical enthalpy values, and discussing potential sources of error, such as energy losses in the piping system and heat loss to the surroundings. The analysis highlights the cooling and dehumidification effect on air properties. The conclusion emphasizes the importance of the psychrometric chart in analyzing air properties within the refrigeration cycle, the ability to track cooling and dehumidifying processes, and the discrepancies between experimental and theoretical values due to the ideal refrigeration cycle assumption.
Document Page
Experiment Title: Cooling and dehumidification of air using air conditioning Process
Name : Tan Suker
ID : 1804645
Group : P4
Date : 11 April 2021
Objectives:
(1) To be familiar with Psychrometric chart for cooling and dehumidifying process.
(2) To be able to determine the thermodynamic properties of air such as dry bulb temperature,
specific humidity (moisture content), relative humidity, specific volume and enthalpy by using
Psychrometric chart.
tabler-icon-diamond-filled.svg

Paraphrase This Document

Need a fresh take? Get an instant paraphrase of this document with our AI Paraphraser
Document Page
Experiments:
Identify the major working parts of the setup in the following diagram and discuss the process of
cooling and dehumidifying in brief
Figure 1 : Air conditioning Unit with base refrigeration system
Two major sections make up the refrigeration unit. The two sections are the base refrigeration unit &
air conditioning unit respectively.
Document Page
The base refrigeration unit is made up of 4 main components. These components are the evaporator,
expansion valve, condenser and compressor. The base refrigeration unit runs of the principle of a
refrigeration cycle. The refrigeration cycle starts and ends at the compressor. The refrigerant used in
the experiment is R-14a. Refrigerant flows into the compressor where it is compressed to a high-
pressure gas, causing the temperature to rise. The hot gas then flows into the condenser where it is
cooled down by the exterior air or water to become a hot liquid. The liquid refrigerant then enters an
expansion valve where it cools down due to the pressure drop, resulting in a cold refrigerant. The cold
refrigerant from the expansion valve then enters the evaporator. It enters as a liquid state where heat
exchange takes place with the exterior air or water and therefore cooling the load inside the
refrigerator. As the liquid cools down the load, heat is absorbed turning it back into a gaseous state.
The gas is them pushed back into the compressor where the cycle will repeat again.
Document Page
In the air conditioning unit, hot air will be flowing through the air inlet to the evaporator coils which
has a low temperature due to the cold refrigerant. Heat exchange takes place where the heat from
the inlet air is transferred into the evaporator, cooling the air inside the evaporator. As the air reaches
dew point, water will start condensing. The condensed air is then collected into a reservoir to be
removed. As the air flows out of the evaporator, temperature and relative humidity sensors are
installed to check the air to ensure it reaches the target temperature and humidity. If it does not meet
the selected criteria, an air heater and humidifier tank is installed such to condition the air further.
Before the air escapes through the outlet, another sensor is installed to check the air one last time. If
the air still has not met the selected criteria’s, it will be redirected again into the evaporator to repeat
the process to ensure correct air conditioning has taken place.
tabler-icon-diamond-filled.svg

Paraphrase This Document

Need a fresh take? Get an instant paraphrase of this document with our AI Paraphraser
Document Page
Results:
Document Page
Document Page
Discussion:
In this experiment, by only looking at the enthalpy, h values before and after the evaporator which
are hB/hC and h4/h1 respectively, we can see that there is a big difference between the values taken
from the psychrometric chart and from steam table. For hB from psychrometric chart, the value is 46
kJ/kg and hC is 70kJ/kg. While for the value taken from steam table, h4 is 87.396 kJ/kg and h1 is 234.44
kJ/kg. The percentage error is given by 83.67%, this shows that the difference between experimental
value and theoretical value is big. The difference in enthalpy values may be caused by several factors,
one of the factors is that the piping system of the apparatus. For the ideal case, it assumed that there
are no losses of energy, so the value we obtain will be higher when compared to experimental value.
Besides that, there is also heat lost to the surrounding through conduction. Due to that, heat lost is
not equal to the heat gain by the refrigerant, causing heat lost is greater than the heat gain.
Cooling and dehumidification processes occur at the evaporator. Before entering the
evaporator, the air has a temperature of 26.3 oC and relative humidity of 78.9%. After entering the
evaporator, the air temperature becomes 19.2 oC and relative humidity has reduced to 73.9%. This
clearly shows that cooling and dehumidification process took place.
With the humidity ratio, ω and the specific volume, v obtained from the psychrometric chart,
we are able to calculate the mass flow rate of the air. With that, we can use the equation ṁ (ω1 – ω2)
to find the amount of water vapour removed. Given that it is an ideal refrigeration case, we can use
the steam table to find the enthalpy, h4 and h1. With all the values obtained from the steam table, the
cooling load can be obtained from the difference of the enthalpies.
tabler-icon-diamond-filled.svg

Paraphrase This Document

Need a fresh take? Get an instant paraphrase of this document with our AI Paraphraser
Document Page
Conclusion
In conclusion, the psychometric chart is very important in analysing the properties of air in the
refrigeration cycle. By only using the dry bulb temperature and relative humidity, we may be able to
obtain the specific humidity (moisture content), specific volume and enthalpy. Besides that, cooling
and dehumidifying processes can be easily tracked using the psychometric chart. The difference
between theoretical and experimental values is given by a percentage error of 83.67%. This huge
difference in values is due to the theoretical values are obtained based on an ideal refrigeration
cycle.
Document Page
For lecturer use only.
Criteria Scale
(Score)
Report
(100%)
Results – 30% 1
(6%)
2
(12%)
3
(18%)
4
(24%)
5
(30%)
Analysis – 50% 1
(10%)
2
(20%)
3
(30%)
4
(40%)
5
(50%)
Conclusions – 20% 1
(4%)
2
(8%)
3
(12%)
4
(16%)
5
(20%)
Total marks (100%)
**Marks are awarded based on marking rubrics.
Comments:
chevron_up_icon
1 out of 9
circle_padding
hide_on_mobile
zoom_out_icon
[object Object]