Capital Budgeting Analysis and Investment Decisions for Delaware Pipe
VerifiedAdded on 2020/06/04
|19
|4338
|30
Homework Assignment
AI Summary
This assignment provides a comprehensive capital budgeting analysis for Delaware Pipe, evaluating the financial viability of a project to produce 10-in and 12-in pipes. It utilizes various capital budgeting tools, including Net Present Value (NPV), Internal Rate of Return (IRR), and Profitability Index (PI), to compare the MAKE and BUY options. The analysis includes an incremental cash flow table, sensitivity analysis, and break-even cash flow calculations. The study makes assumptions about sales growth, labor costs, and depreciation, and provides recommendations based on the calculated financial metrics. The assignment suggests that the BUY option is more profitable for Delaware Pipe, offering higher NPV, IRR, and PI values. The analysis also explores the impact of different scenarios (worst, most likely, best) on the NPV, providing a robust evaluation of the investment decisions. The document also provides a detailed overview of the cost and revenue structure for the project.

CAPITAL BUDGETING
Paraphrase This Document
Need a fresh take? Get an instant paraphrase of this document with our AI Paraphraser
TABLE OF CONTENTS
INTRODUCTION...........................................................................................................................1
QUESTION 1...................................................................................................................................1
Comment on items listed in Exhibit 1.........................................................................................1
QUESTION 2...................................................................................................................................2
Incremental cash flow table........................................................................................................2
QUESTION 3...................................................................................................................................5
Capital budgeting tools for MAKE option..................................................................................5
Capital budgeting tools for BUY option.....................................................................................6
Suggestions for undertaking project on the basis of above investment evaluation tools............8
QUESTION 4...................................................................................................................................9
Sensitivity analysis of NPV for MAKE option...........................................................................9
Sensitivity analysis of NPV for BUY option............................................................................10
QUESTION 5.................................................................................................................................12
For MAKE option.....................................................................................................................12
For BUY option........................................................................................................................12
QUESTION 6.................................................................................................................................13
Break even cash flow for MAKE option...................................................................................13
Break even cash flow for BUY option......................................................................................14
QUESTION 7.................................................................................................................................15
QUESTION 8.................................................................................................................................16
CONCLUSION..............................................................................................................................16
REFERENCES..............................................................................................................................17
INTRODUCTION
Capital budgeting is one of the important and widely considered tool by the project
managers in order to make effectual business decisions. The reason is that, it helps to compare
and take decisions that which one project will be the most profitable for the working
environment. The study is based on Delaware Pipe which owner is Philip Walker and going to
undertake new project. In this, owner going to produce 10-in and 12-in pipes on the basis of
interest of various distributors. When he will produce such both kinds of pipes then profitable in
two ways like preventing expenses and assisting problems of staff. The present project shows
about the calculation of various capital budgeting tools and methods for net cash flows estimated
in the incremental cash flow table. Apart from this, in order to make effective decisions for
undertaking the project in Delaware Pipe company, base of NPV, IRR and PI calculations is
taken into account.
QUESTION 1
Comment on items listed in Exhibit 1
In the present case scenario basically three conditions are provided which are like worst,
most likely as well as the best. In this, accountant of Delaware Pipe company used situation of
the most likely where annual sales is worth of 1.65 million. This figure of revenue is considered
at the higher value which can affect to the decision making in order to undertake the project.
Further, all the items are providing information about the expenses only to the accountant which
are adequate. Apart from expenses data related to the incomes are also required in order to assess
viability of the project. However, given data and information in the Exhibit 3 are not considering
to the probability which also plays a major role. The reason is that, on the basis of probabilities
future scenario of conditions of the project can be easily and clearly assumed (Chow and
Teicher, 2012). Henceforth, the provided data is not sufficient which lead to create impact of
effective decision making. As the probabilities level are not undertaken in the project then
transpire to cash flows as well as net present value in a negative direction. Moreover, it can be
said that information provided in the Exhibit 3 are sufficient up to the certain level. Therefore,
the accountant should work upon it and consider effective strategies for estimating data in order
to perform calculation of Net Present Value (NPV).
⊘ This is a preview!⊘
Do you want full access?
Subscribe today to unlock all pages.
Trusted by 1+ million students worldwide
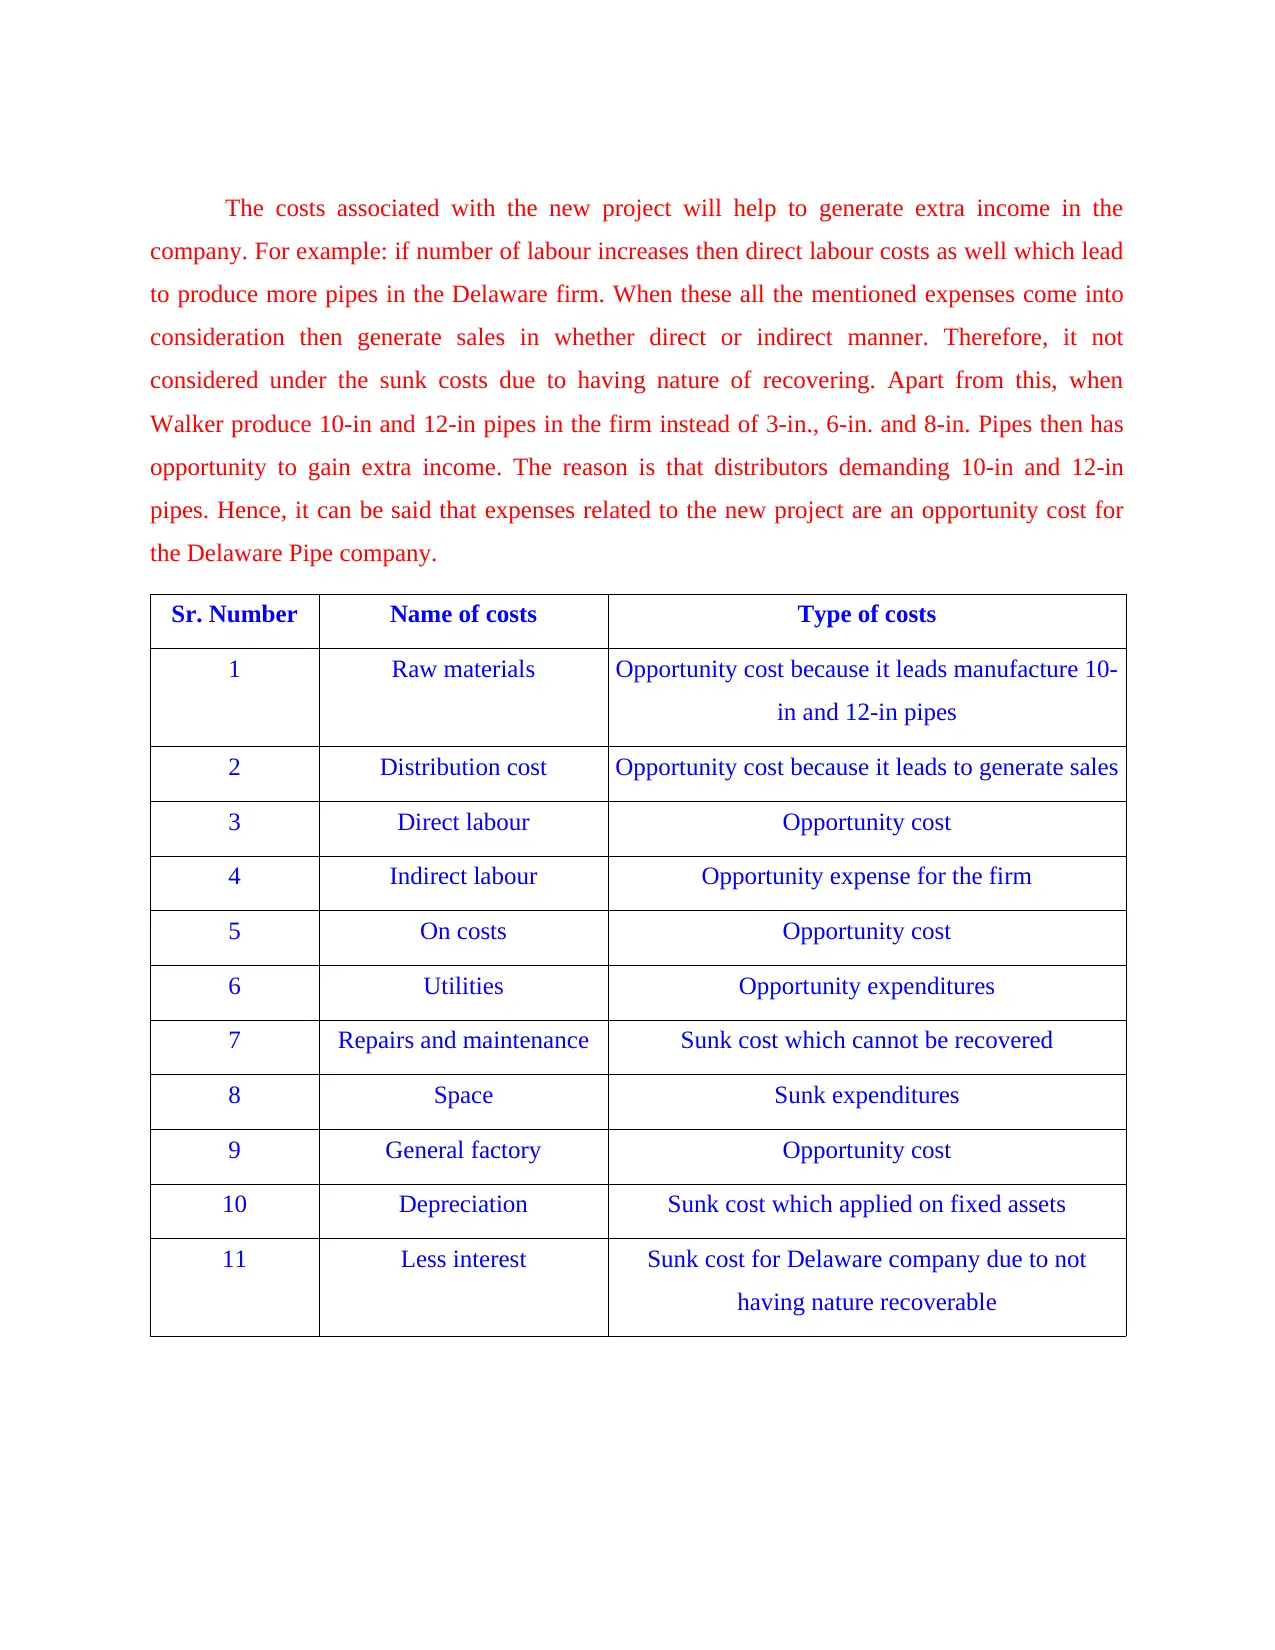
The costs associated with the new project will help to generate extra income in the
company. For example: if number of labour increases then direct labour costs as well which lead
to produce more pipes in the Delaware firm. When these all the mentioned expenses come into
consideration then generate sales in whether direct or indirect manner. Therefore, it not
considered under the sunk costs due to having nature of recovering. Apart from this, when
Walker produce 10-in and 12-in pipes in the firm instead of 3-in., 6-in. and 8-in. Pipes then has
opportunity to gain extra income. The reason is that distributors demanding 10-in and 12-in
pipes. Hence, it can be said that expenses related to the new project are an opportunity cost for
the Delaware Pipe company.
Sr. Number Name of costs Type of costs
1 Raw materials Opportunity cost because it leads manufacture 10-
in and 12-in pipes
2 Distribution cost Opportunity cost because it leads to generate sales
3 Direct labour Opportunity cost
4 Indirect labour Opportunity expense for the firm
5 On costs Opportunity cost
6 Utilities Opportunity expenditures
7 Repairs and maintenance Sunk cost which cannot be recovered
8 Space Sunk expenditures
9 General factory Opportunity cost
10 Depreciation Sunk cost which applied on fixed assets
11 Less interest Sunk cost for Delaware company due to not
having nature recoverable
Paraphrase This Document
Need a fresh take? Get an instant paraphrase of this document with our AI Paraphraser
QUESTION 2
Incremental cash flow table
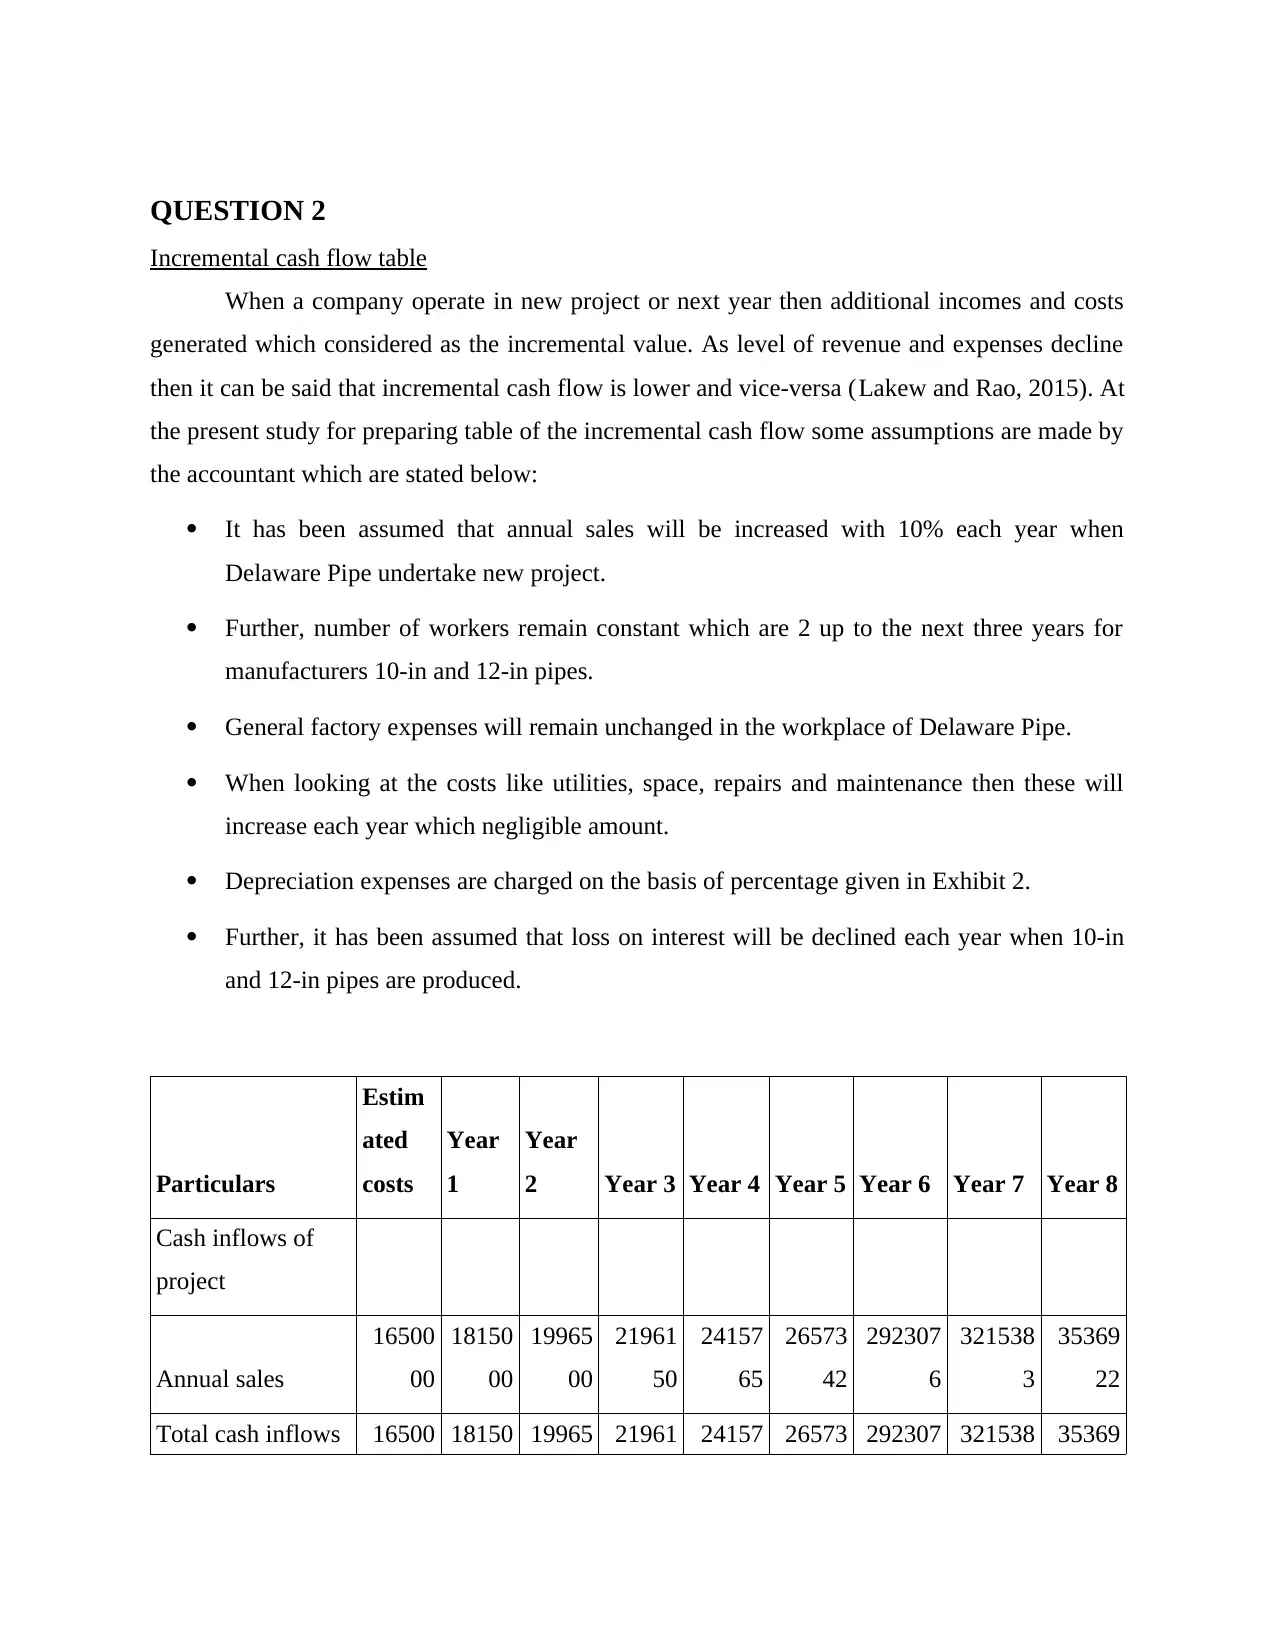
When a company operate in new project or next year then additional incomes and costs
generated which considered as the incremental value. As level of revenue and expenses decline
then it can be said that incremental cash flow is lower and vice-versa (Lakew and Rao, 2015). At
the present study for preparing table of the incremental cash flow some assumptions are made by
the accountant which are stated below:
It has been assumed that annual sales will be increased with 10% each year when
Delaware Pipe undertake new project.
Further, number of workers remain constant which are 2 up to the next three years for
manufacturers 10-in and 12-in pipes.
General factory expenses will remain unchanged in the workplace of Delaware Pipe.
When looking at the costs like utilities, space, repairs and maintenance then these will
increase each year which negligible amount.
Depreciation expenses are charged on the basis of percentage given in Exhibit 2.
Further, it has been assumed that loss on interest will be declined each year when 10-in
and 12-in pipes are produced.
Particulars
Estim
ated
costs
Year
1
Year
2 Year 3 Year 4 Year 5 Year 6 Year 7 Year 8
Cash inflows of
project
Annual sales
16500
00
18150
00
19965
00
21961
50
24157
65
26573
42
292307
6
321538
3
35369
22
Total cash inflows 16500 18150 19965 21961 24157 26573 292307 321538 35369
Incremental cash flow table
When a company operate in new project or next year then additional incomes and costs
generated which considered as the incremental value. As level of revenue and expenses decline
then it can be said that incremental cash flow is lower and vice-versa (Lakew and Rao, 2015). At
the present study for preparing table of the incremental cash flow some assumptions are made by
the accountant which are stated below:
It has been assumed that annual sales will be increased with 10% each year when
Delaware Pipe undertake new project.
Further, number of workers remain constant which are 2 up to the next three years for
manufacturers 10-in and 12-in pipes.
General factory expenses will remain unchanged in the workplace of Delaware Pipe.
When looking at the costs like utilities, space, repairs and maintenance then these will
increase each year which negligible amount.
Depreciation expenses are charged on the basis of percentage given in Exhibit 2.
Further, it has been assumed that loss on interest will be declined each year when 10-in
and 12-in pipes are produced.
Particulars
Estim
ated
costs
Year
1
Year
2 Year 3 Year 4 Year 5 Year 6 Year 7 Year 8
Cash inflows of
project
Annual sales
16500
00
18150
00
19965
00
21961
50
24157
65
26573
42
292307
6
321538
3
35369
22
Total cash inflows 16500 18150 19965 21961 24157 26573 292307 321538 35369
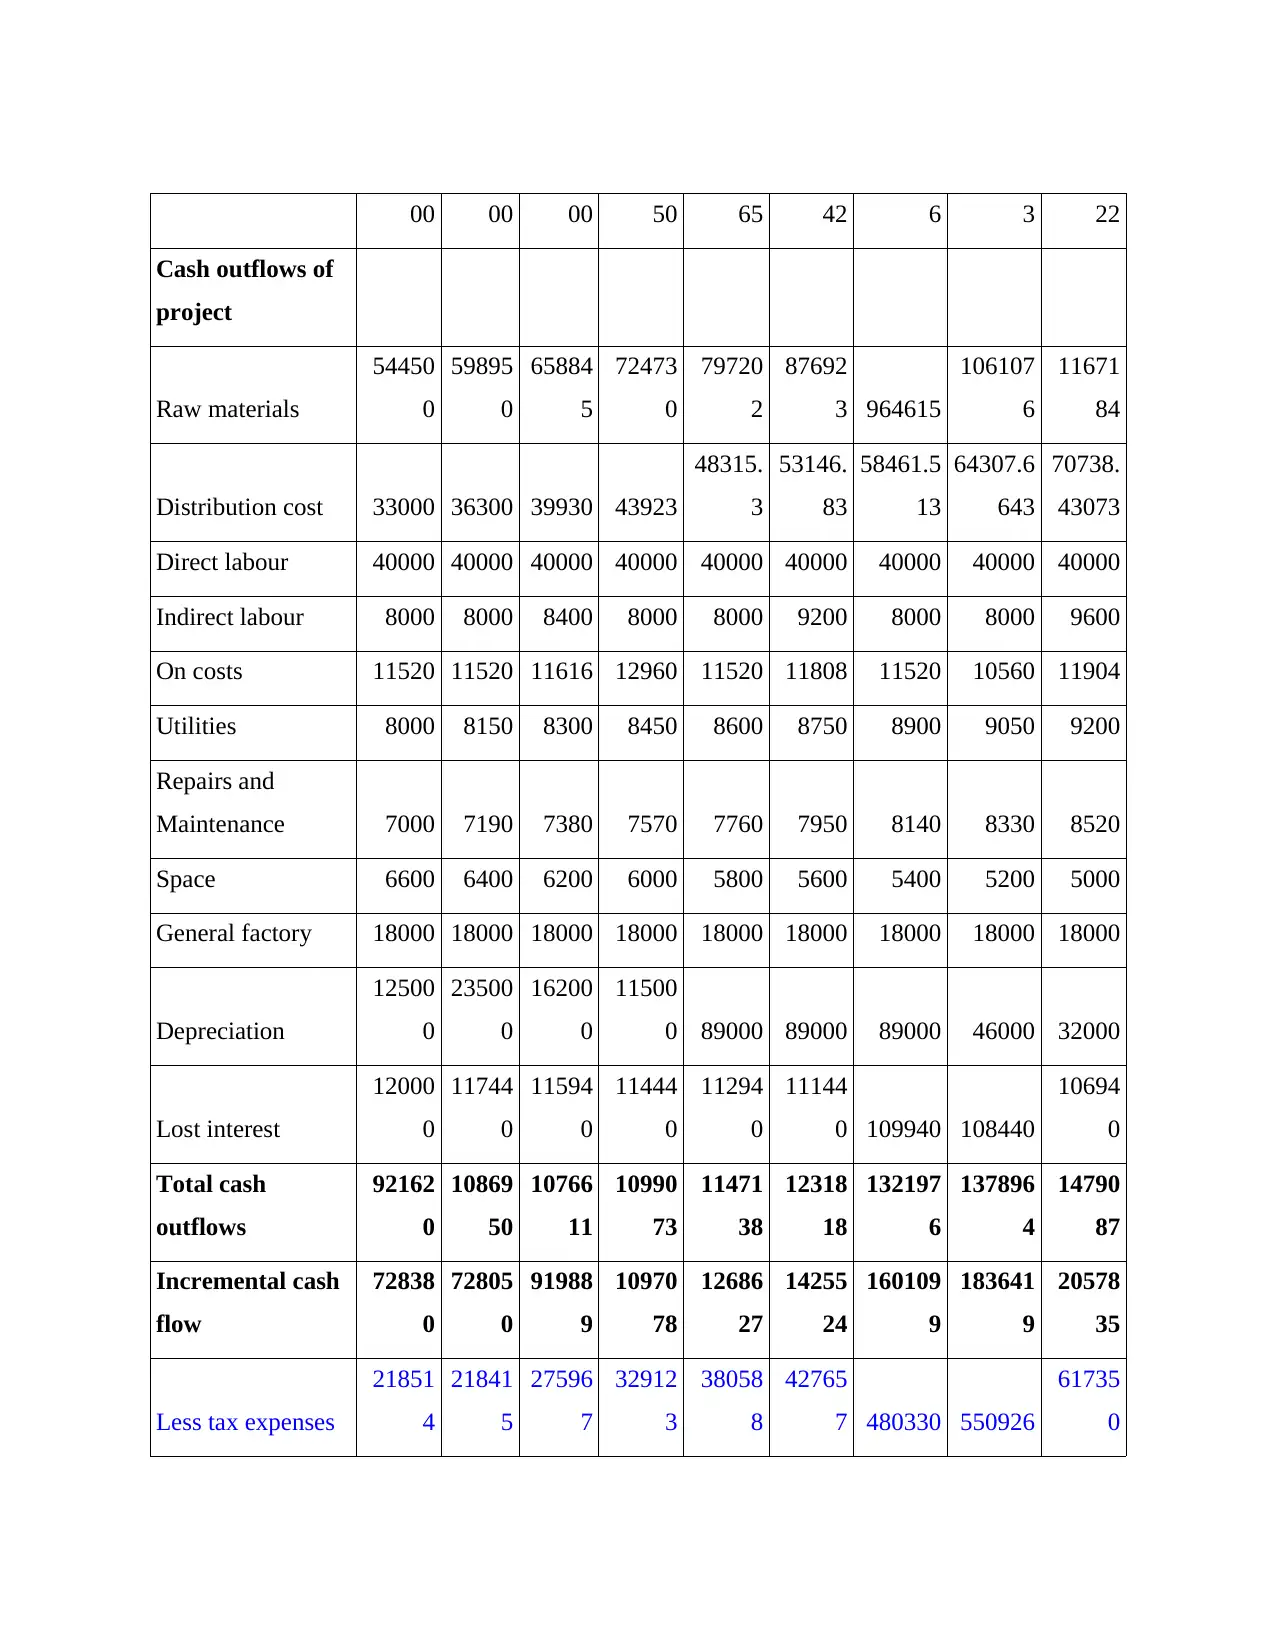
00 00 00 50 65 42 6 3 22
Cash outflows of
project
Raw materials
54450
0
59895
0
65884
5
72473
0
79720
2
87692
3 964615
106107
6
11671
84
Distribution cost 33000 36300 39930 43923
48315.
3
53146.
83
58461.5
13
64307.6
643
70738.
43073
Direct labour 40000 40000 40000 40000 40000 40000 40000 40000 40000
Indirect labour 8000 8000 8400 8000 8000 9200 8000 8000 9600
On costs 11520 11520 11616 12960 11520 11808 11520 10560 11904
Utilities 8000 8150 8300 8450 8600 8750 8900 9050 9200
Repairs and
Maintenance 7000 7190 7380 7570 7760 7950 8140 8330 8520
Space 6600 6400 6200 6000 5800 5600 5400 5200 5000
General factory 18000 18000 18000 18000 18000 18000 18000 18000 18000
Depreciation
12500
0
23500
0
16200
0
11500
0 89000 89000 89000 46000 32000
Lost interest
12000
0
11744
0
11594
0
11444
0
11294
0
11144
0 109940 108440
10694
0
Total cash
outflows
92162
0
10869
50
10766
11
10990
73
11471
38
12318
18
132197
6
137896
4
14790
87
Incremental cash
flow
72838
0
72805
0
91988
9
10970
78
12686
27
14255
24
160109
9
183641
9
20578
35
Less tax expenses
21851
4
21841
5
27596
7
32912
3
38058
8
42765
7 480330 550926
61735
0
⊘ This is a preview!⊘
Do you want full access?
Subscribe today to unlock all pages.
Trusted by 1+ million students worldwide
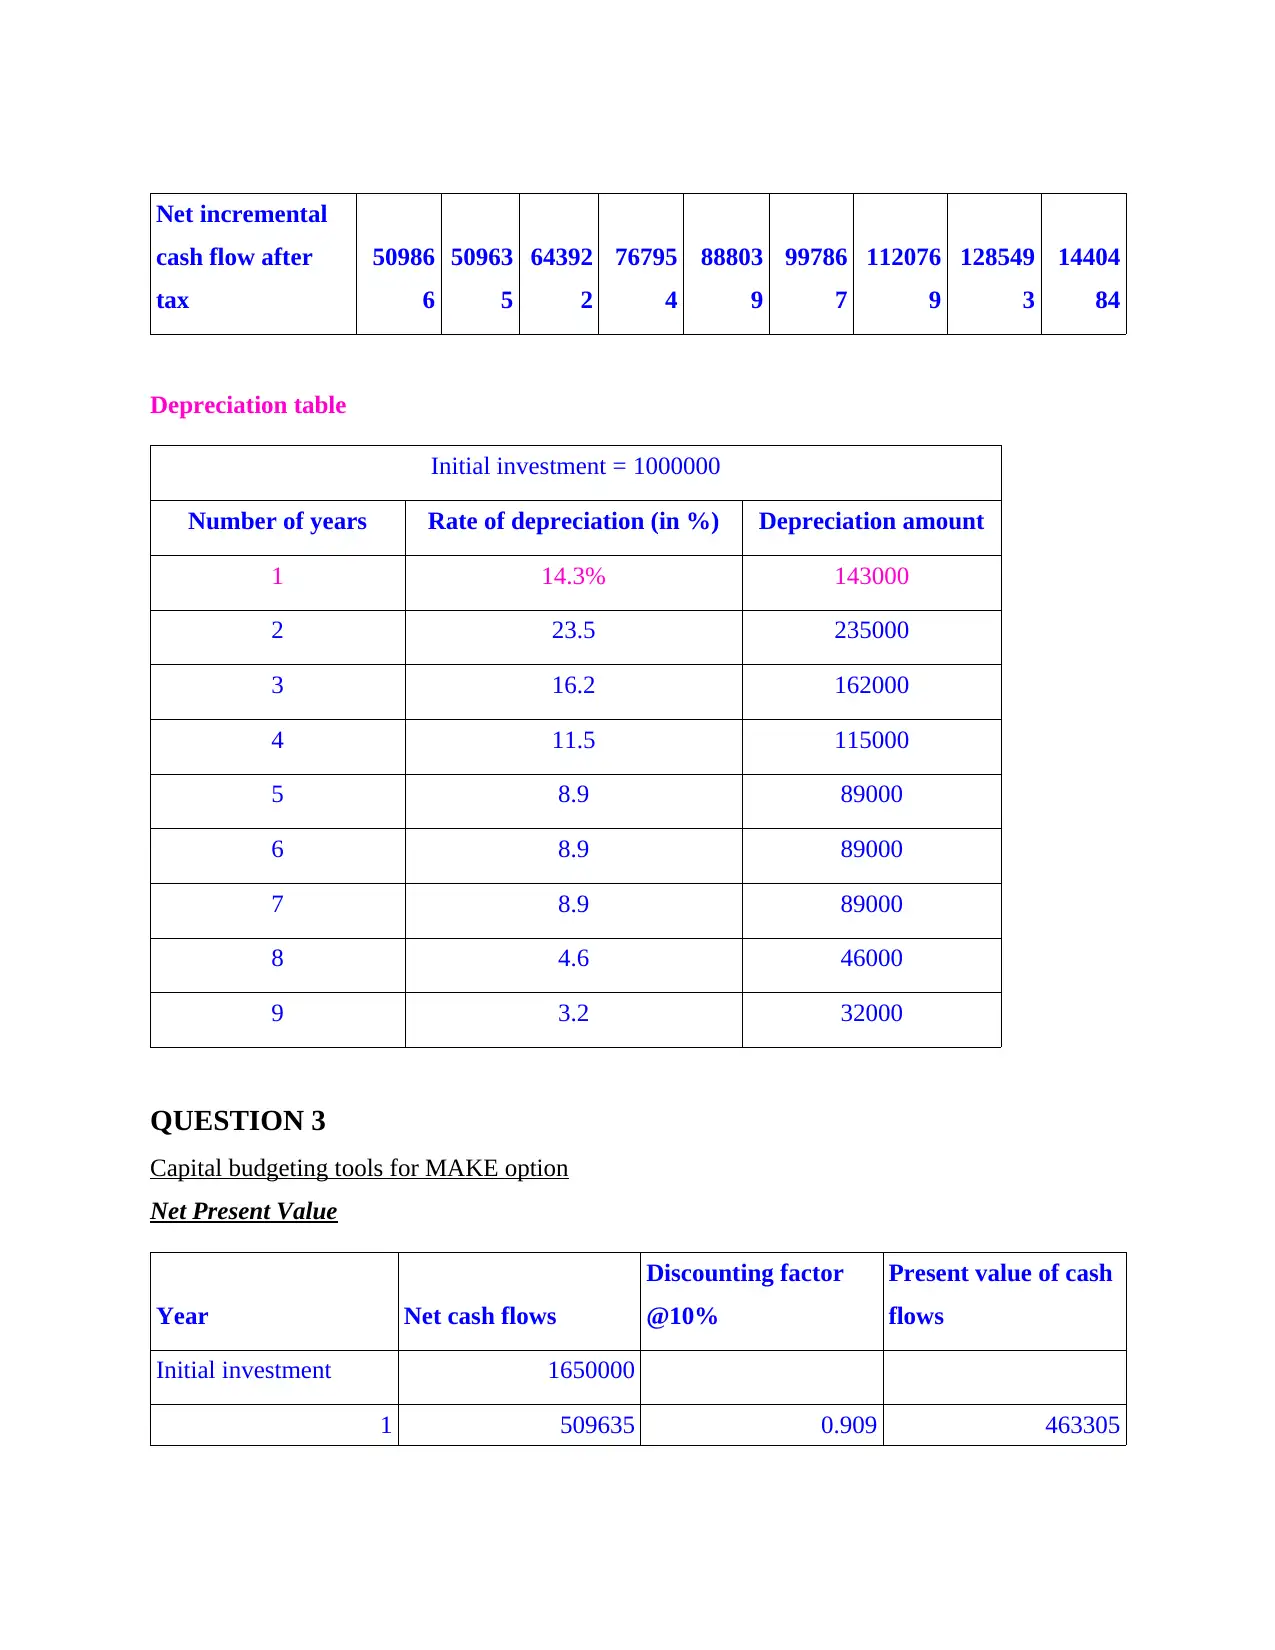
Net incremental
cash flow after
tax
50986
6
50963
5
64392
2
76795
4
88803
9
99786
7
112076
9
128549
3
14404
84
Depreciation table
Initial investment = 1000000
Number of years Rate of depreciation (in %) Depreciation amount
1 14.3% 143000
2 23.5 235000
3 16.2 162000
4 11.5 115000
5 8.9 89000
6 8.9 89000
7 8.9 89000
8 4.6 46000
9 3.2 32000
QUESTION 3
Capital budgeting tools for MAKE option
Net Present Value
Year Net cash flows
Discounting factor
@10%
Present value of cash
flows
Initial investment 1650000
1 509635 0.909 463305
Paraphrase This Document
Need a fresh take? Get an instant paraphrase of this document with our AI Paraphraser
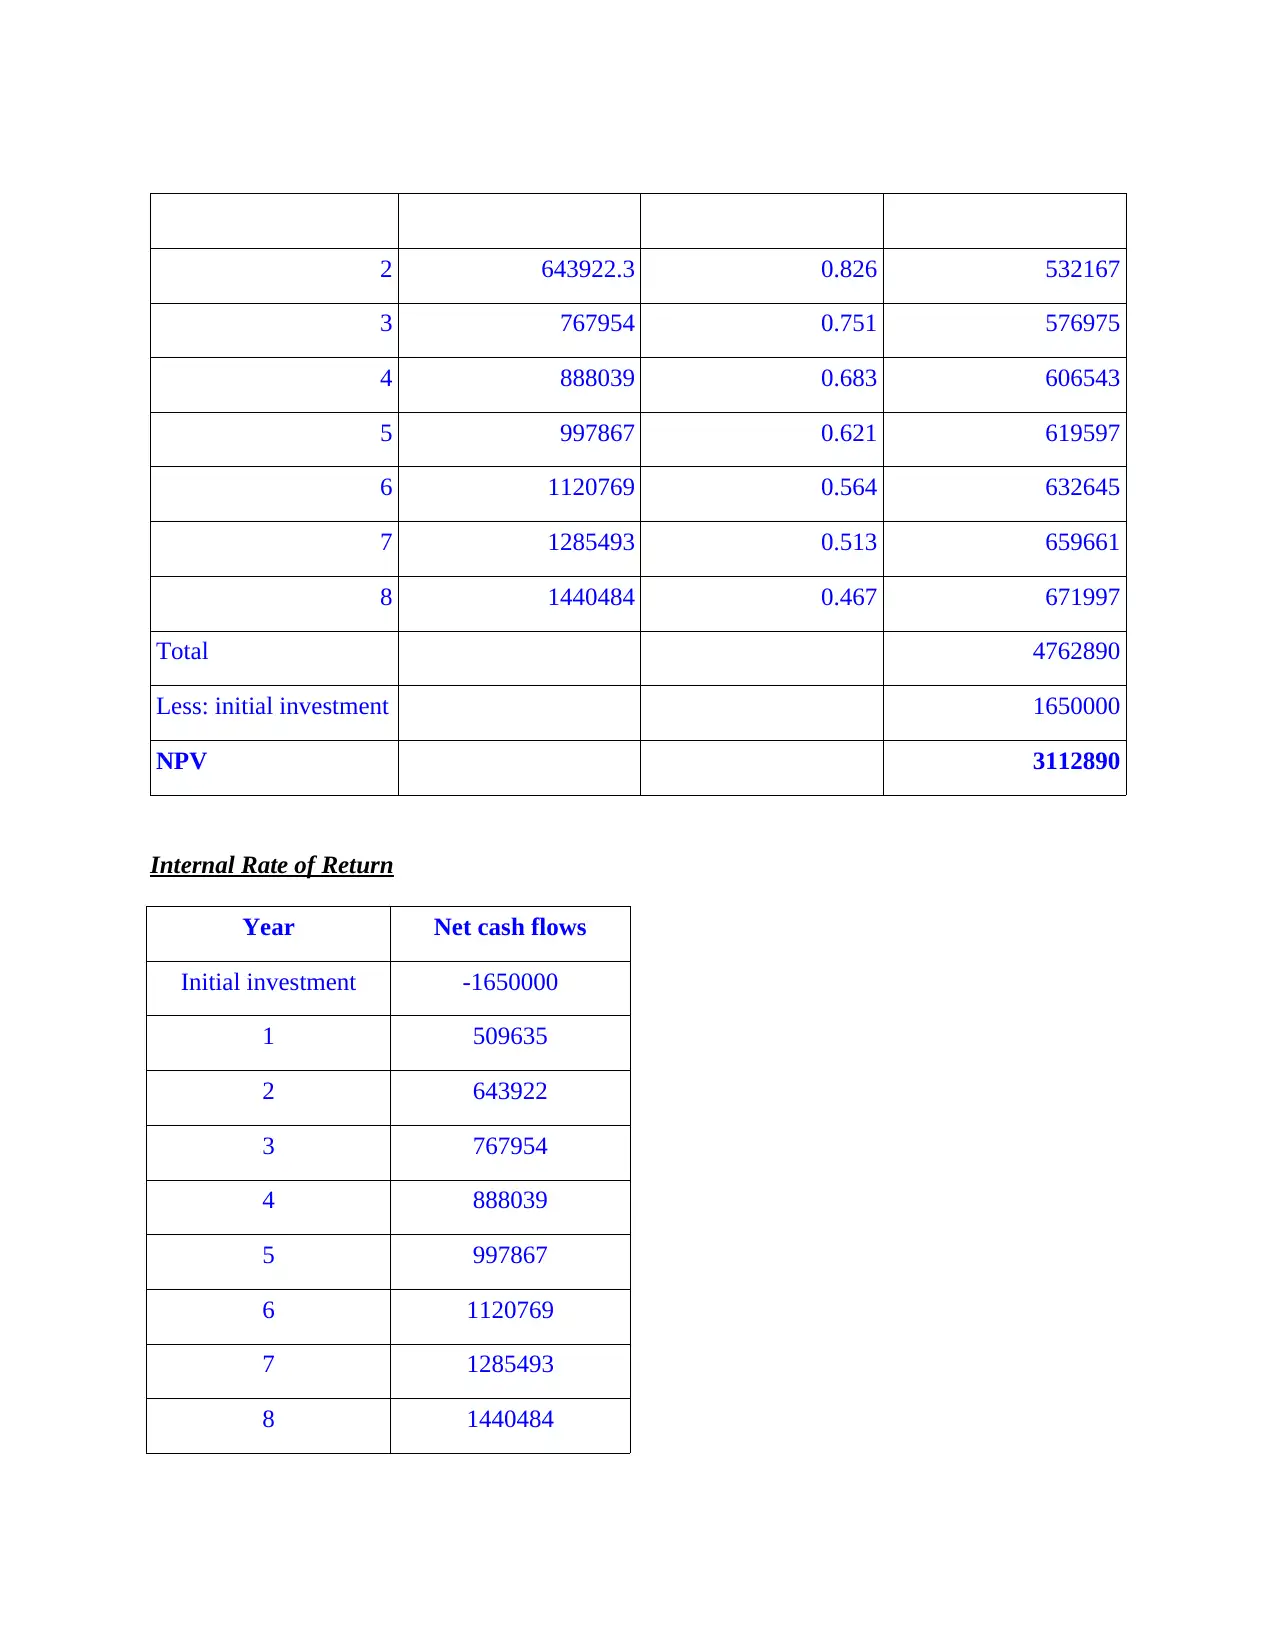
2 643922.3 0.826 532167
3 767954 0.751 576975
4 888039 0.683 606543
5 997867 0.621 619597
6 1120769 0.564 632645
7 1285493 0.513 659661
8 1440484 0.467 671997
Total 4762890
Less: initial investment 1650000
NPV 3112890
Internal Rate of Return
Year Net cash flows
Initial investment -1650000
1 509635
2 643922
3 767954
4 888039
5 997867
6 1120769
7 1285493
8 1440484
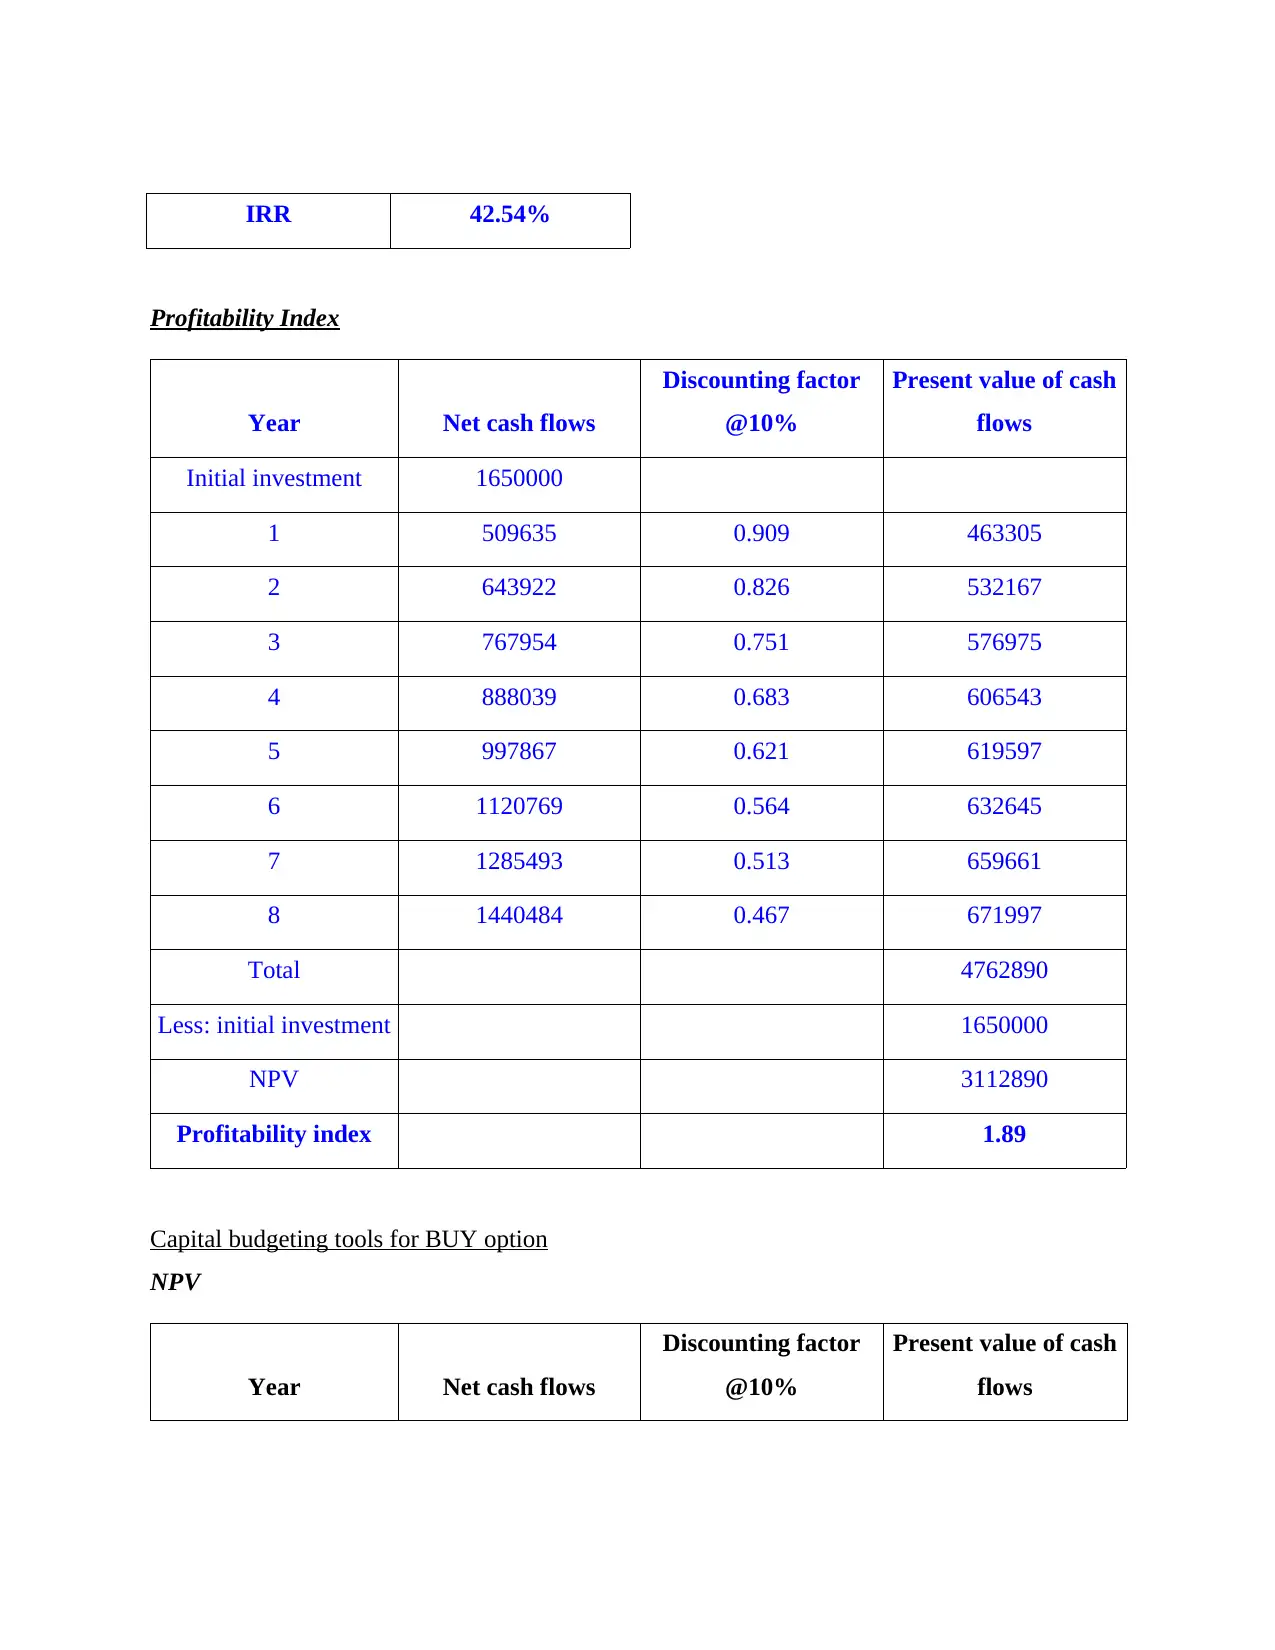
IRR 42.54%
Profitability Index
Year Net cash flows
Discounting factor
@10%
Present value of cash
flows
Initial investment 1650000
1 509635 0.909 463305
2 643922 0.826 532167
3 767954 0.751 576975
4 888039 0.683 606543
5 997867 0.621 619597
6 1120769 0.564 632645
7 1285493 0.513 659661
8 1440484 0.467 671997
Total 4762890
Less: initial investment 1650000
NPV 3112890
Profitability index 1.89
Capital budgeting tools for BUY option
NPV
Year Net cash flows
Discounting factor
@10%
Present value of cash
flows
⊘ This is a preview!⊘
Do you want full access?
Subscribe today to unlock all pages.
Trusted by 1+ million students worldwide
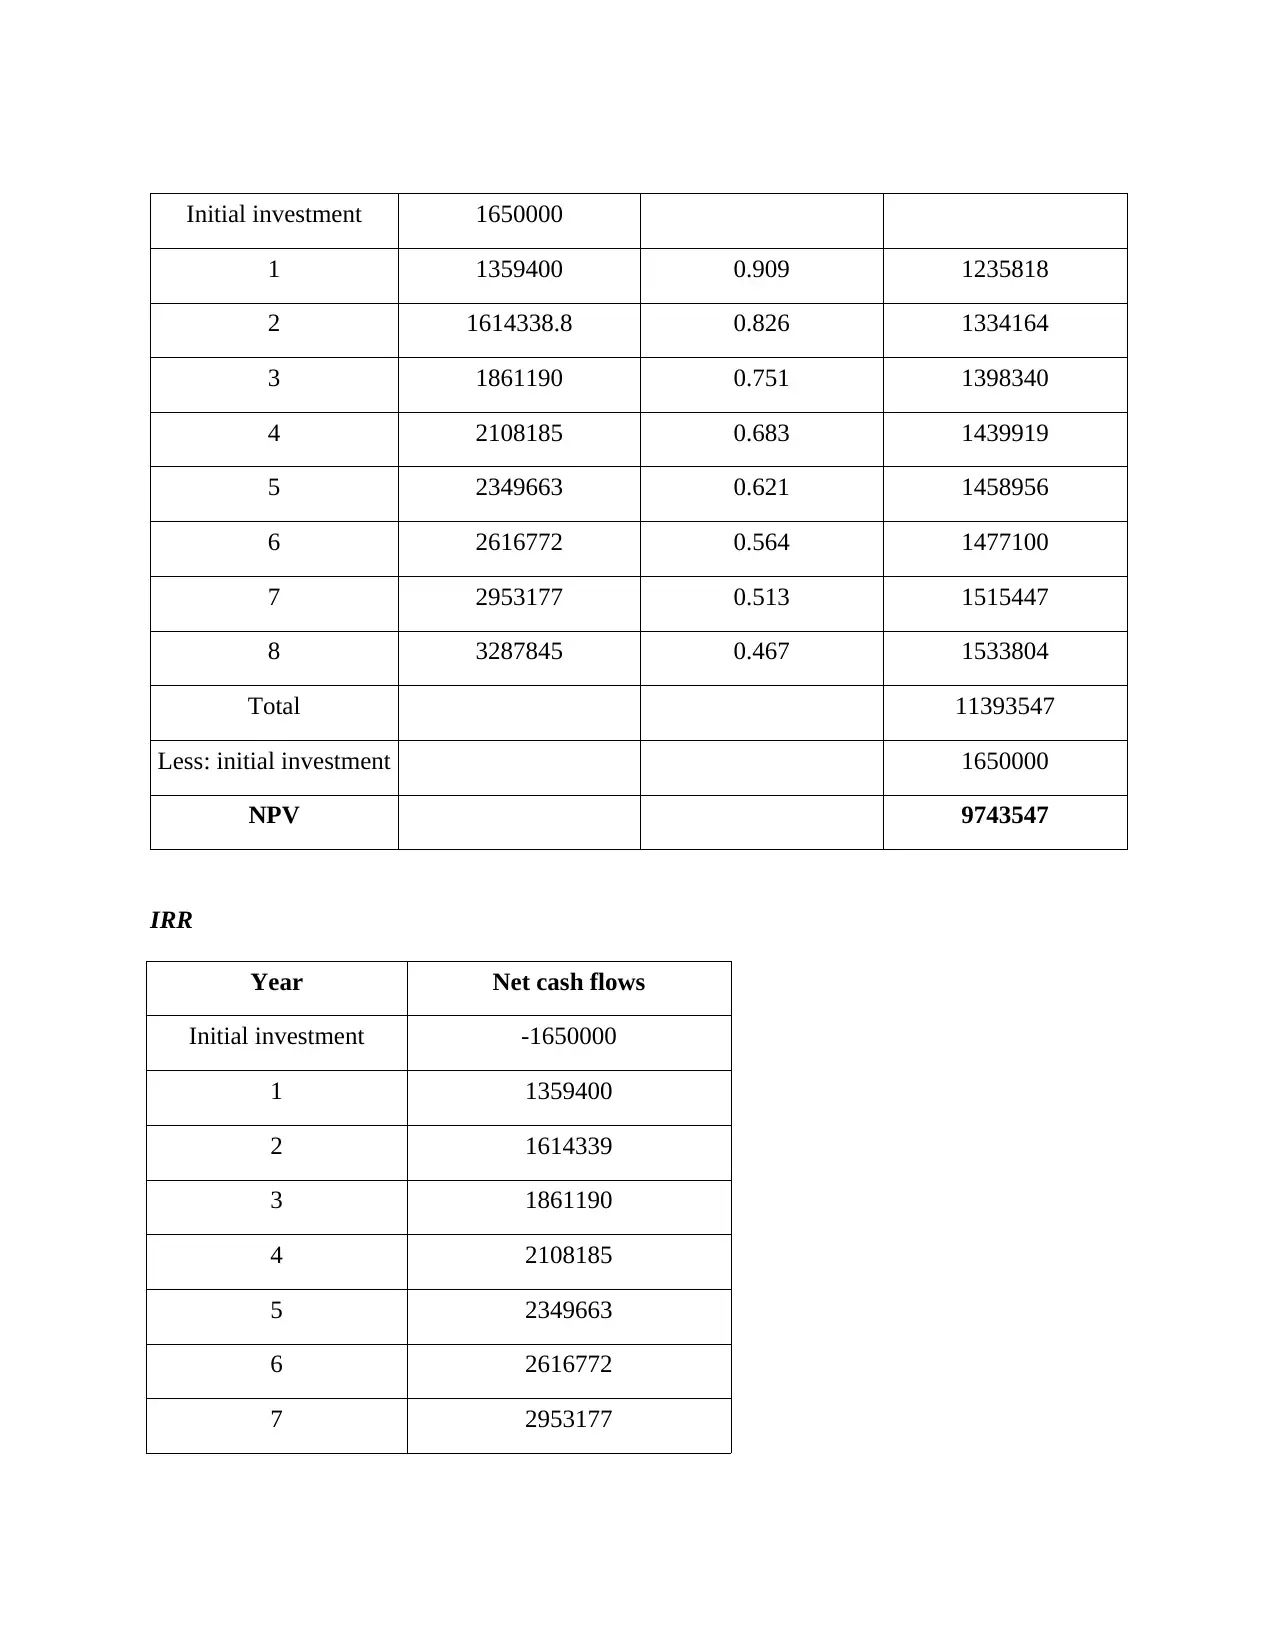
Initial investment 1650000
1 1359400 0.909 1235818
2 1614338.8 0.826 1334164
3 1861190 0.751 1398340
4 2108185 0.683 1439919
5 2349663 0.621 1458956
6 2616772 0.564 1477100
7 2953177 0.513 1515447
8 3287845 0.467 1533804
Total 11393547
Less: initial investment 1650000
NPV 9743547
IRR
Year Net cash flows
Initial investment -1650000
1 1359400
2 1614339
3 1861190
4 2108185
5 2349663
6 2616772
7 2953177
Paraphrase This Document
Need a fresh take? Get an instant paraphrase of this document with our AI Paraphraser
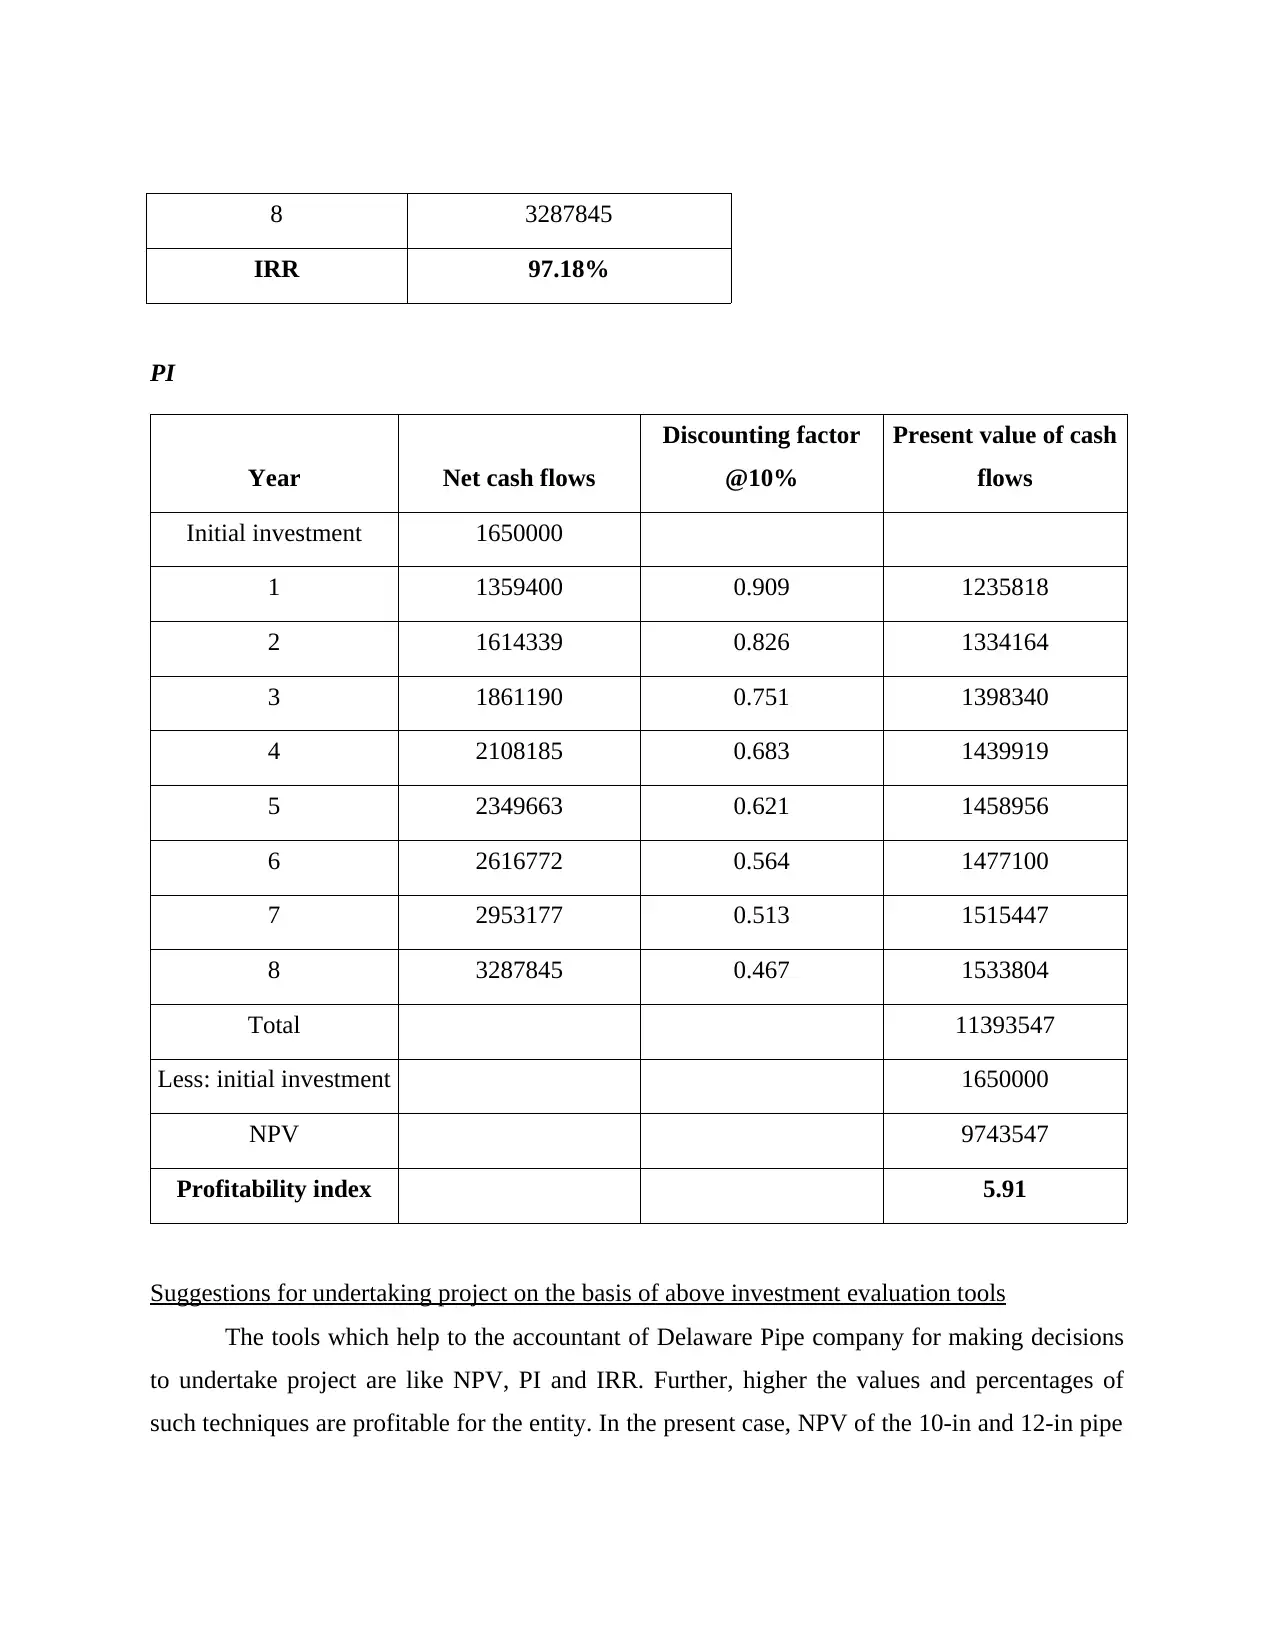
8 3287845
IRR 97.18%
PI
Year Net cash flows
Discounting factor
@10%
Present value of cash
flows
Initial investment 1650000
1 1359400 0.909 1235818
2 1614339 0.826 1334164
3 1861190 0.751 1398340
4 2108185 0.683 1439919
5 2349663 0.621 1458956
6 2616772 0.564 1477100
7 2953177 0.513 1515447
8 3287845 0.467 1533804
Total 11393547
Less: initial investment 1650000
NPV 9743547
Profitability index 5.91
Suggestions for undertaking project on the basis of above investment evaluation tools
The tools which help to the accountant of Delaware Pipe company for making decisions
to undertake project are like NPV, PI and IRR. Further, higher the values and percentages of
such techniques are profitable for the entity. In the present case, NPV of the 10-in and 12-in pipe
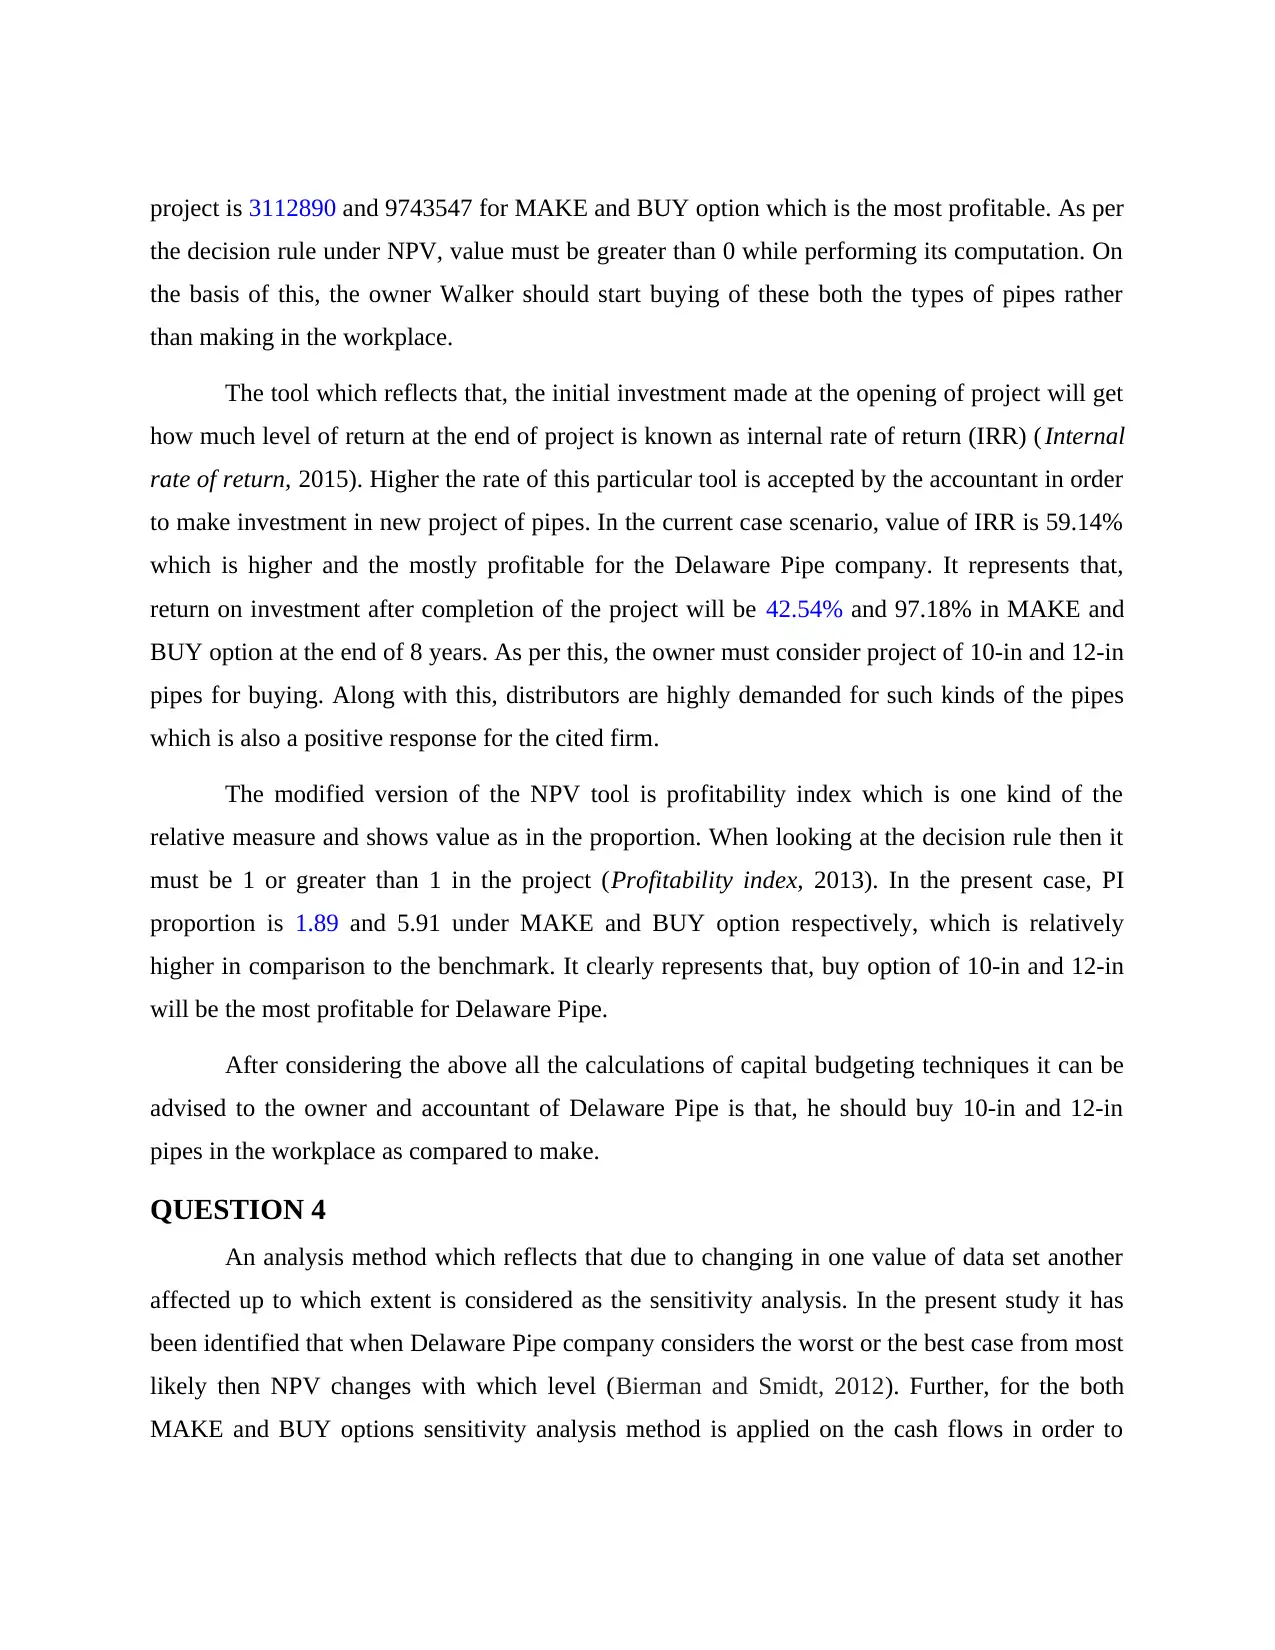
project is 3112890 and 9743547 for MAKE and BUY option which is the most profitable. As per
the decision rule under NPV, value must be greater than 0 while performing its computation. On
the basis of this, the owner Walker should start buying of these both the types of pipes rather
than making in the workplace.
The tool which reflects that, the initial investment made at the opening of project will get
how much level of return at the end of project is known as internal rate of return (IRR) ( Internal
rate of return, 2015). Higher the rate of this particular tool is accepted by the accountant in order
to make investment in new project of pipes. In the current case scenario, value of IRR is 59.14%
which is higher and the mostly profitable for the Delaware Pipe company. It represents that,
return on investment after completion of the project will be 42.54% and 97.18% in MAKE and
BUY option at the end of 8 years. As per this, the owner must consider project of 10-in and 12-in
pipes for buying. Along with this, distributors are highly demanded for such kinds of the pipes
which is also a positive response for the cited firm.
The modified version of the NPV tool is profitability index which is one kind of the
relative measure and shows value as in the proportion. When looking at the decision rule then it
must be 1 or greater than 1 in the project (Profitability index, 2013). In the present case, PI
proportion is 1.89 and 5.91 under MAKE and BUY option respectively, which is relatively
higher in comparison to the benchmark. It clearly represents that, buy option of 10-in and 12-in
will be the most profitable for Delaware Pipe.
After considering the above all the calculations of capital budgeting techniques it can be
advised to the owner and accountant of Delaware Pipe is that, he should buy 10-in and 12-in
pipes in the workplace as compared to make.
QUESTION 4
An analysis method which reflects that due to changing in one value of data set another
affected up to which extent is considered as the sensitivity analysis. In the present study it has
been identified that when Delaware Pipe company considers the worst or the best case from most
likely then NPV changes with which level (Bierman and Smidt, 2012). Further, for the both
MAKE and BUY options sensitivity analysis method is applied on the cash flows in order to
⊘ This is a preview!⊘
Do you want full access?
Subscribe today to unlock all pages.
Trusted by 1+ million students worldwide
1 out of 19
Related Documents


Your All-in-One AI-Powered Toolkit for Academic Success.
+13062052269
info@desklib.com
Available 24*7 on WhatsApp / Email
![[object Object]](/_next/static/media/star-bottom.7253800d.svg)
Unlock your academic potential
Copyright © 2020–2026 A2Z Services. All Rights Reserved. Developed and managed by ZUCOL.