Analyzing Dell Customer Loyalty: A Market Research Demographics Report
VerifiedAdded on 2023/06/13
|26
|5028
|133
Report
AI Summary
This market research report analyzes Dell's customer loyalty, recommendation likelihood, and price sensitivity in relation to customer demographics such as age, gender, income, and education level. The analysis uses Pearson correlation coefficients to determine the strength and direction of relationships between these variables. Key findings include very weak correlations between overall satisfaction and demographic factors, as well as between recommendation likelihood and demographics. Price sensitivity, measured by potential reactions to 5% and 10% price increases, also shows weak correlations with demographic characteristics. The report concludes with a discussion of the qualitative insights derived from these statistical findings, intended to provide Dell with actionable information to improve their segmentation and targeting strategies. This report is available on Desklib, a platform offering study tools and resources for students.

Business market research 1
Name:
Institution:
Date:
Name:
Institution:
Date:
Paraphrase This Document
Need a fresh take? Get an instant paraphrase of this document with our AI Paraphraser
Business market research 2
Introduction
Marketing research has become an important aspect in the world of business today. Due to the
rise in competition, companies have been compelled to move a notch higher to understand their
customers better. This can only be made possible through marketing research. This market report
is based on a survey conducted by Burke marketing research firm on behalf of Dell Company.
The survey sought to establish customers’ loyalty towards Dell products, extent of their
recommendations to other customers and also find out if there are any correlations behaviors
with customers’ demographics. The research findings are expected to be used by the company’s
management to better their services to consumers and thus increase their profit margins.
Statistical findings
Question one
a) Test for relationship between overall satisfaction with age, gender, income level and
education level.
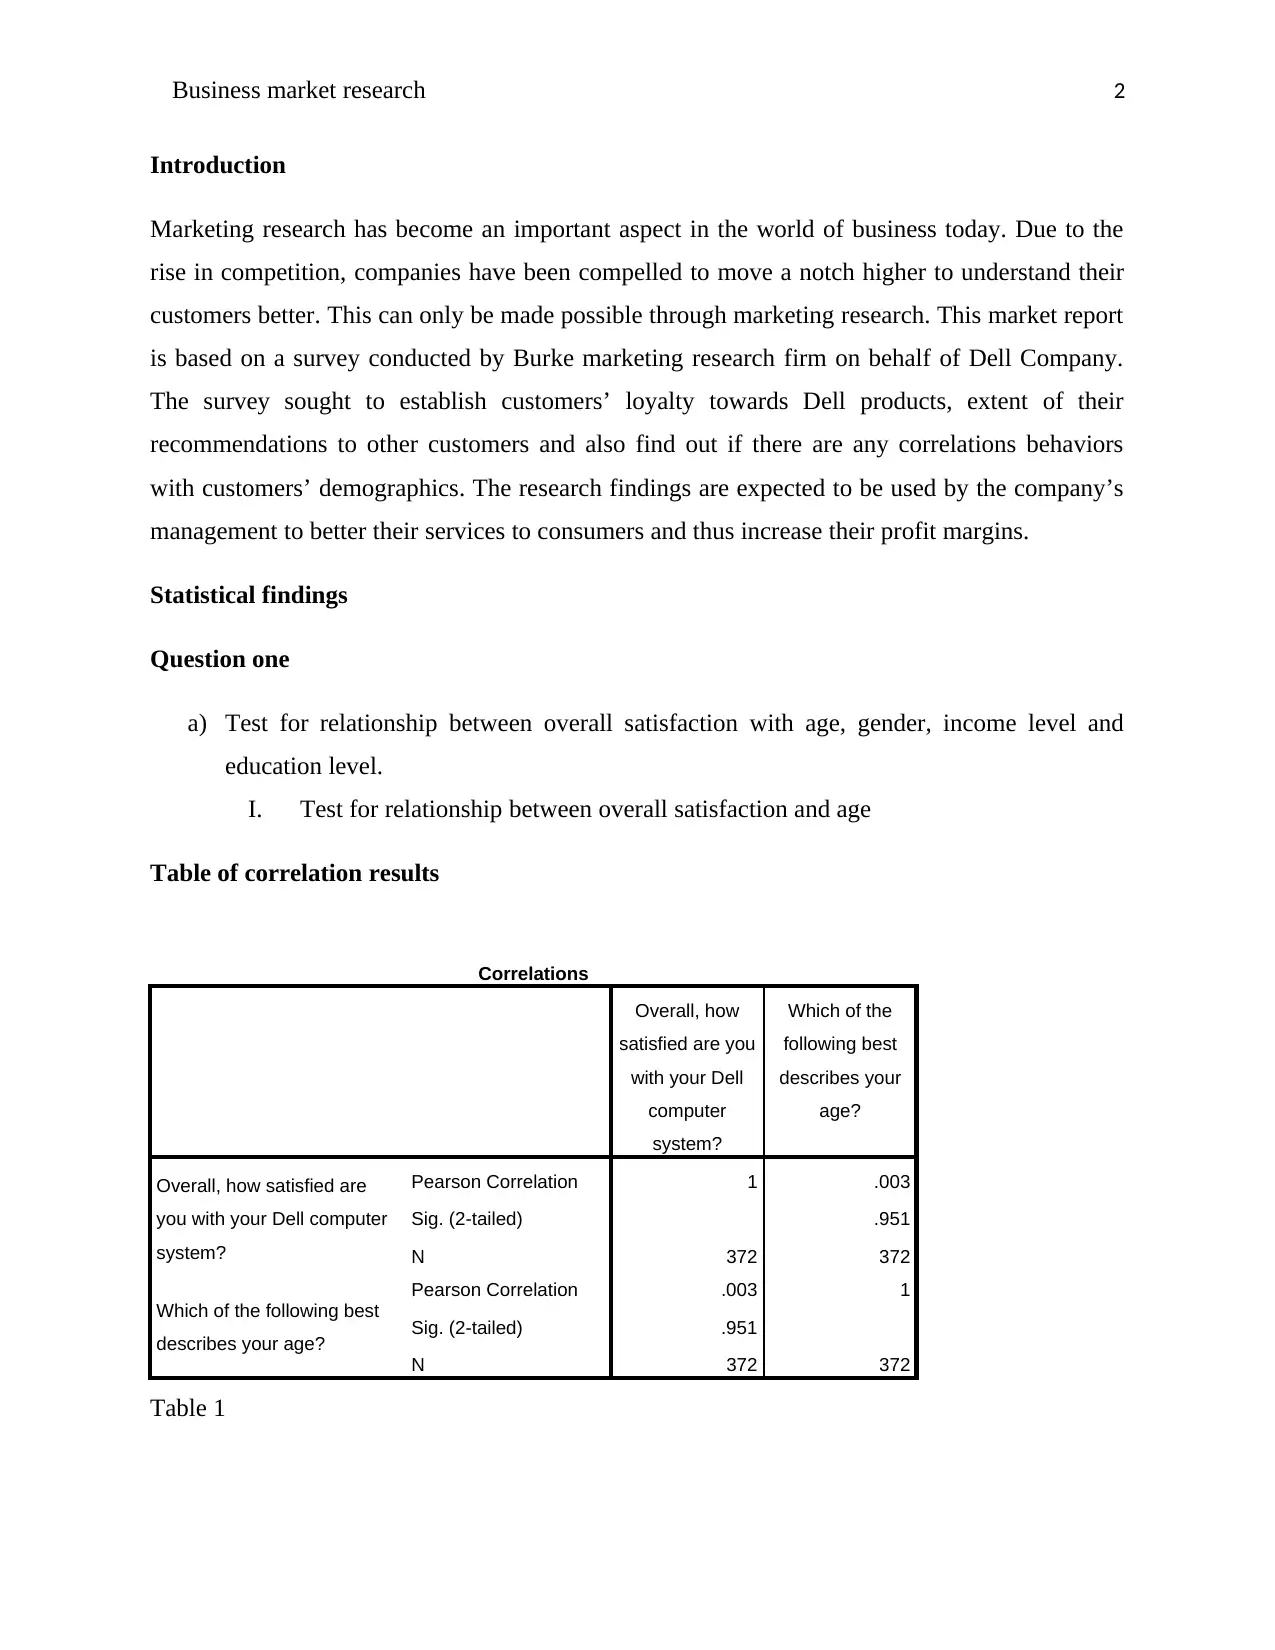
I. Test for relationship between overall satisfaction and age
Table of correlation results
Correlations
Overall, how
satisfied are you
with your Dell
computer
system?
Which of the
following best
describes your
age?
Overall, how satisfied are
you with your Dell computer
system?
Pearson Correlation 1 .003
Sig. (2-tailed) .951
N 372 372
Which of the following best
describes your age?
Pearson Correlation .003 1
Sig. (2-tailed) .951
N 372 372
Table 1
Introduction
Marketing research has become an important aspect in the world of business today. Due to the
rise in competition, companies have been compelled to move a notch higher to understand their
customers better. This can only be made possible through marketing research. This market report
is based on a survey conducted by Burke marketing research firm on behalf of Dell Company.
The survey sought to establish customers’ loyalty towards Dell products, extent of their
recommendations to other customers and also find out if there are any correlations behaviors
with customers’ demographics. The research findings are expected to be used by the company’s
management to better their services to consumers and thus increase their profit margins.
Statistical findings
Question one
a) Test for relationship between overall satisfaction with age, gender, income level and
education level.
I. Test for relationship between overall satisfaction and age
Table of correlation results
Correlations
Overall, how
satisfied are you
with your Dell
computer
system?
Which of the
following best
describes your
age?
Overall, how satisfied are
you with your Dell computer
system?
Pearson Correlation 1 .003
Sig. (2-tailed) .951
N 372 372
Which of the following best
describes your age?
Pearson Correlation .003 1
Sig. (2-tailed) .951
N 372 372
Table 1
Business market research 3
It can be observed that the Pearson correlation coefficient between the two variables is 0.003.
This is an indication that there is a very weak but positive relationship or correlation between
satisfaction with dell computers and age.
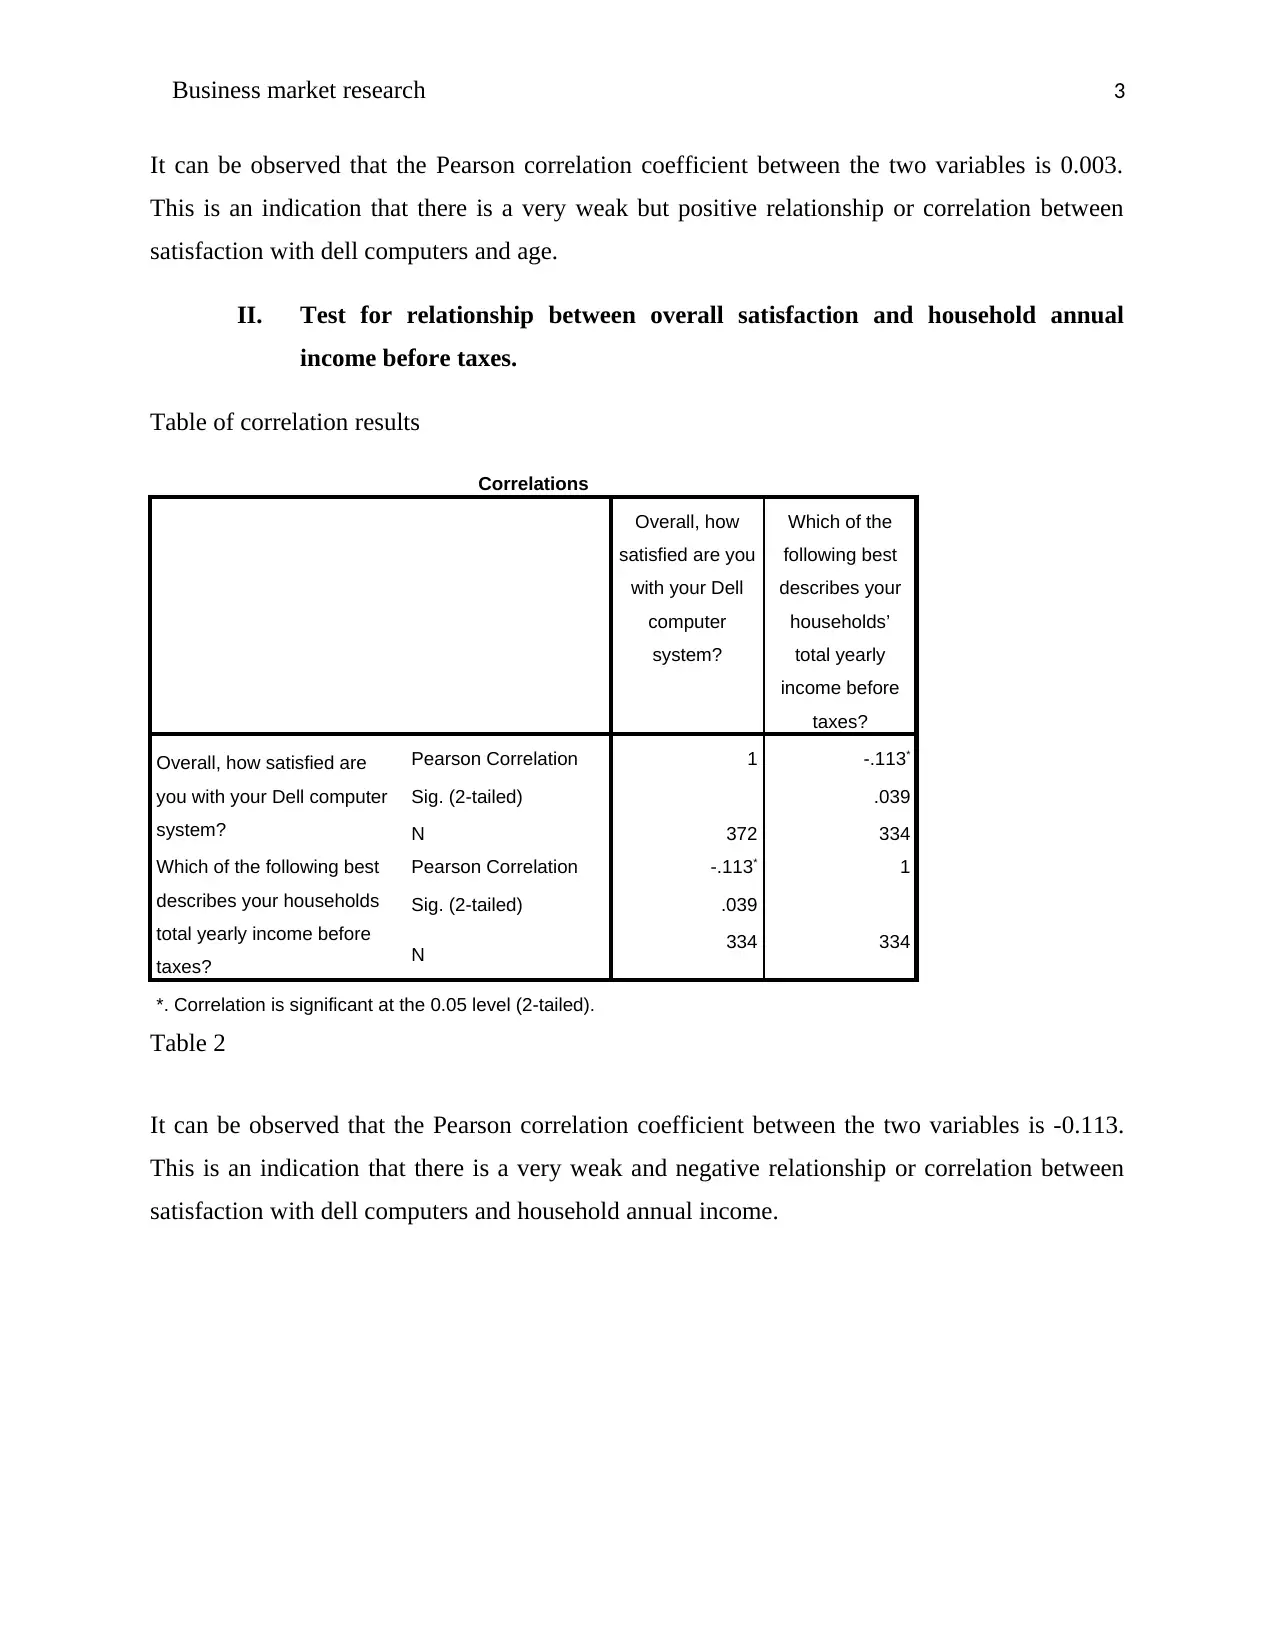
II. Test for relationship between overall satisfaction and household annual
income before taxes.
Table of correlation results
Correlations
Overall, how
satisfied are you
with your Dell
computer
system?
Which of the
following best
describes your
households’
total yearly
income before
taxes?
Overall, how satisfied are
you with your Dell computer
system?
Pearson Correlation 1 -.113*
Sig. (2-tailed) .039
N 372 334
Which of the following best
describes your households
total yearly income before
taxes?
Pearson Correlation -.113* 1
Sig. (2-tailed) .039
N 334 334
*. Correlation is significant at the 0.05 level (2-tailed).
Table 2
It can be observed that the Pearson correlation coefficient between the two variables is -0.113.
This is an indication that there is a very weak and negative relationship or correlation between
satisfaction with dell computers and household annual income.
It can be observed that the Pearson correlation coefficient between the two variables is 0.003.
This is an indication that there is a very weak but positive relationship or correlation between
satisfaction with dell computers and age.
II. Test for relationship between overall satisfaction and household annual
income before taxes.
Table of correlation results
Correlations
Overall, how
satisfied are you
with your Dell
computer
system?
Which of the
following best
describes your
households’
total yearly
income before
taxes?
Overall, how satisfied are
you with your Dell computer
system?
Pearson Correlation 1 -.113*
Sig. (2-tailed) .039
N 372 334
Which of the following best
describes your households
total yearly income before
taxes?
Pearson Correlation -.113* 1
Sig. (2-tailed) .039
N 334 334
*. Correlation is significant at the 0.05 level (2-tailed).
Table 2
It can be observed that the Pearson correlation coefficient between the two variables is -0.113.
This is an indication that there is a very weak and negative relationship or correlation between
satisfaction with dell computers and household annual income.
⊘ This is a preview!⊘
Do you want full access?
Subscribe today to unlock all pages.
Trusted by 1+ million students worldwide
Business market research 4
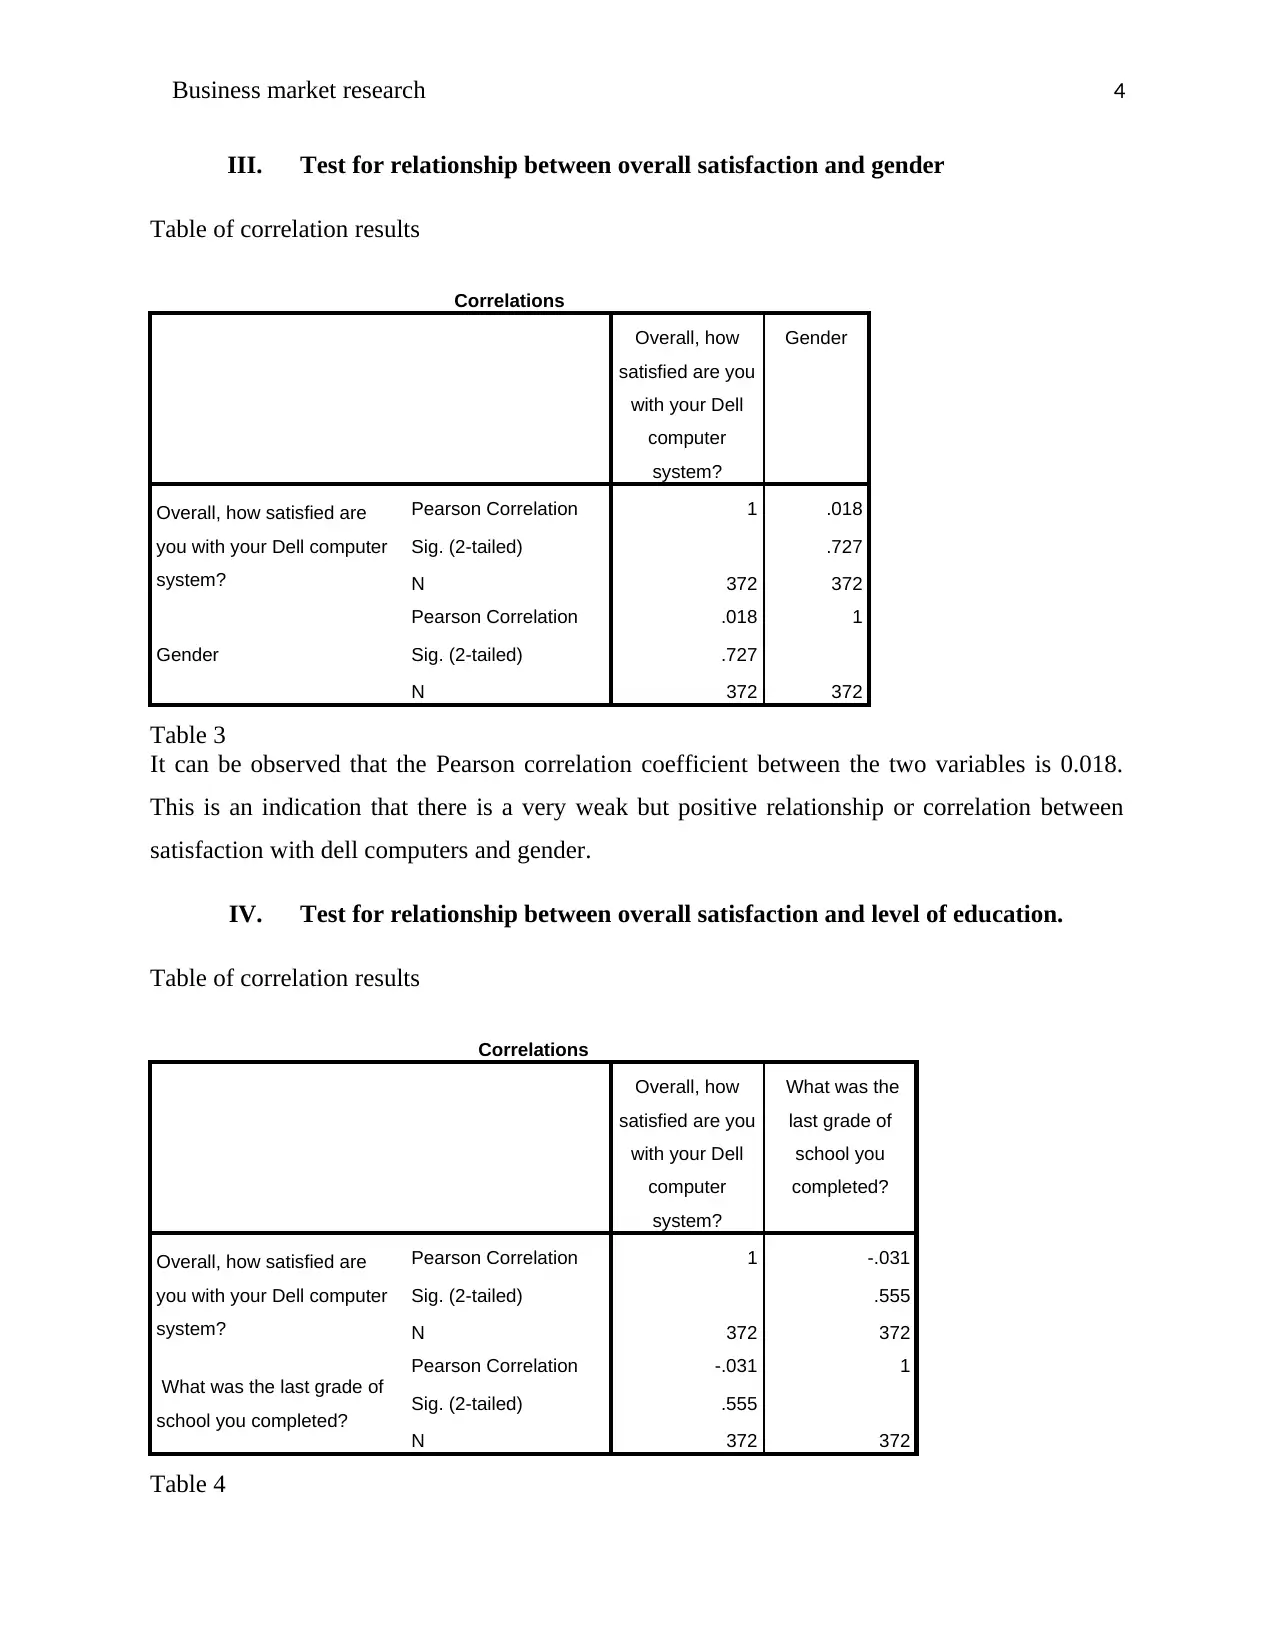
III. Test for relationship between overall satisfaction and gender
Table of correlation results
Correlations
Overall, how
satisfied are you
with your Dell
computer
system?
Gender
Overall, how satisfied are
you with your Dell computer
system?
Pearson Correlation 1 .018
Sig. (2-tailed) .727
N 372 372
Gender
Pearson Correlation .018 1
Sig. (2-tailed) .727
N 372 372
Table 3
It can be observed that the Pearson correlation coefficient between the two variables is 0.018.
This is an indication that there is a very weak but positive relationship or correlation between
satisfaction with dell computers and gender.
IV. Test for relationship between overall satisfaction and level of education.
Table of correlation results
Correlations
Overall, how
satisfied are you
with your Dell
computer
system?
What was the
last grade of
school you
completed?
Overall, how satisfied are
you with your Dell computer
system?
Pearson Correlation 1 -.031
Sig. (2-tailed) .555
N 372 372
What was the last grade of
school you completed?
Pearson Correlation -.031 1
Sig. (2-tailed) .555
N 372 372
Table 4
Paraphrase This Document
Need a fresh take? Get an instant paraphrase of this document with our AI Paraphraser
Business market research 5
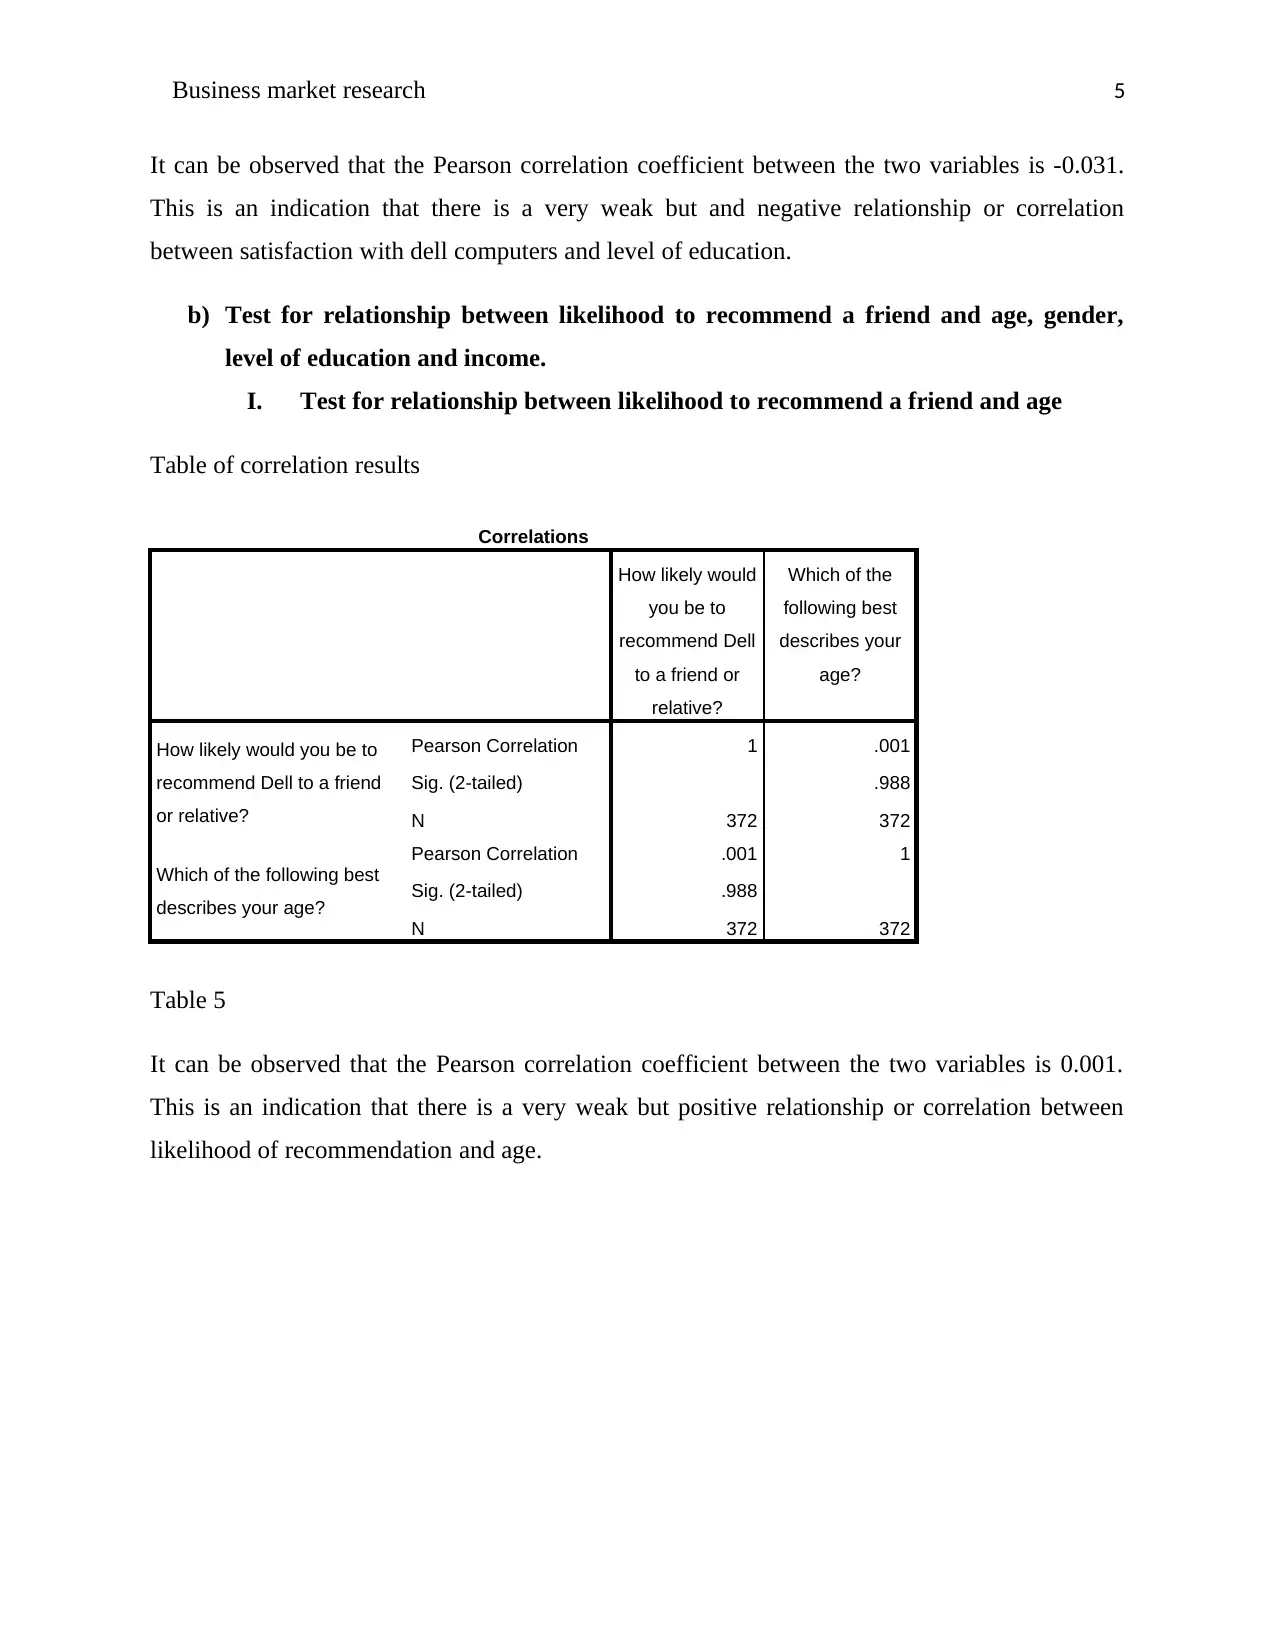
It can be observed that the Pearson correlation coefficient between the two variables is -0.031.
This is an indication that there is a very weak but and negative relationship or correlation
between satisfaction with dell computers and level of education.
b) Test for relationship between likelihood to recommend a friend and age, gender,
level of education and income.
I. Test for relationship between likelihood to recommend a friend and age
Table of correlation results
Correlations
How likely would
you be to
recommend Dell
to a friend or
relative?
Which of the
following best
describes your
age?
How likely would you be to
recommend Dell to a friend
or relative?
Pearson Correlation 1 .001
Sig. (2-tailed) .988
N 372 372
Which of the following best
describes your age?
Pearson Correlation .001 1
Sig. (2-tailed) .988
N 372 372
Table 5
It can be observed that the Pearson correlation coefficient between the two variables is 0.001.
This is an indication that there is a very weak but positive relationship or correlation between
likelihood of recommendation and age.
Business market research 6
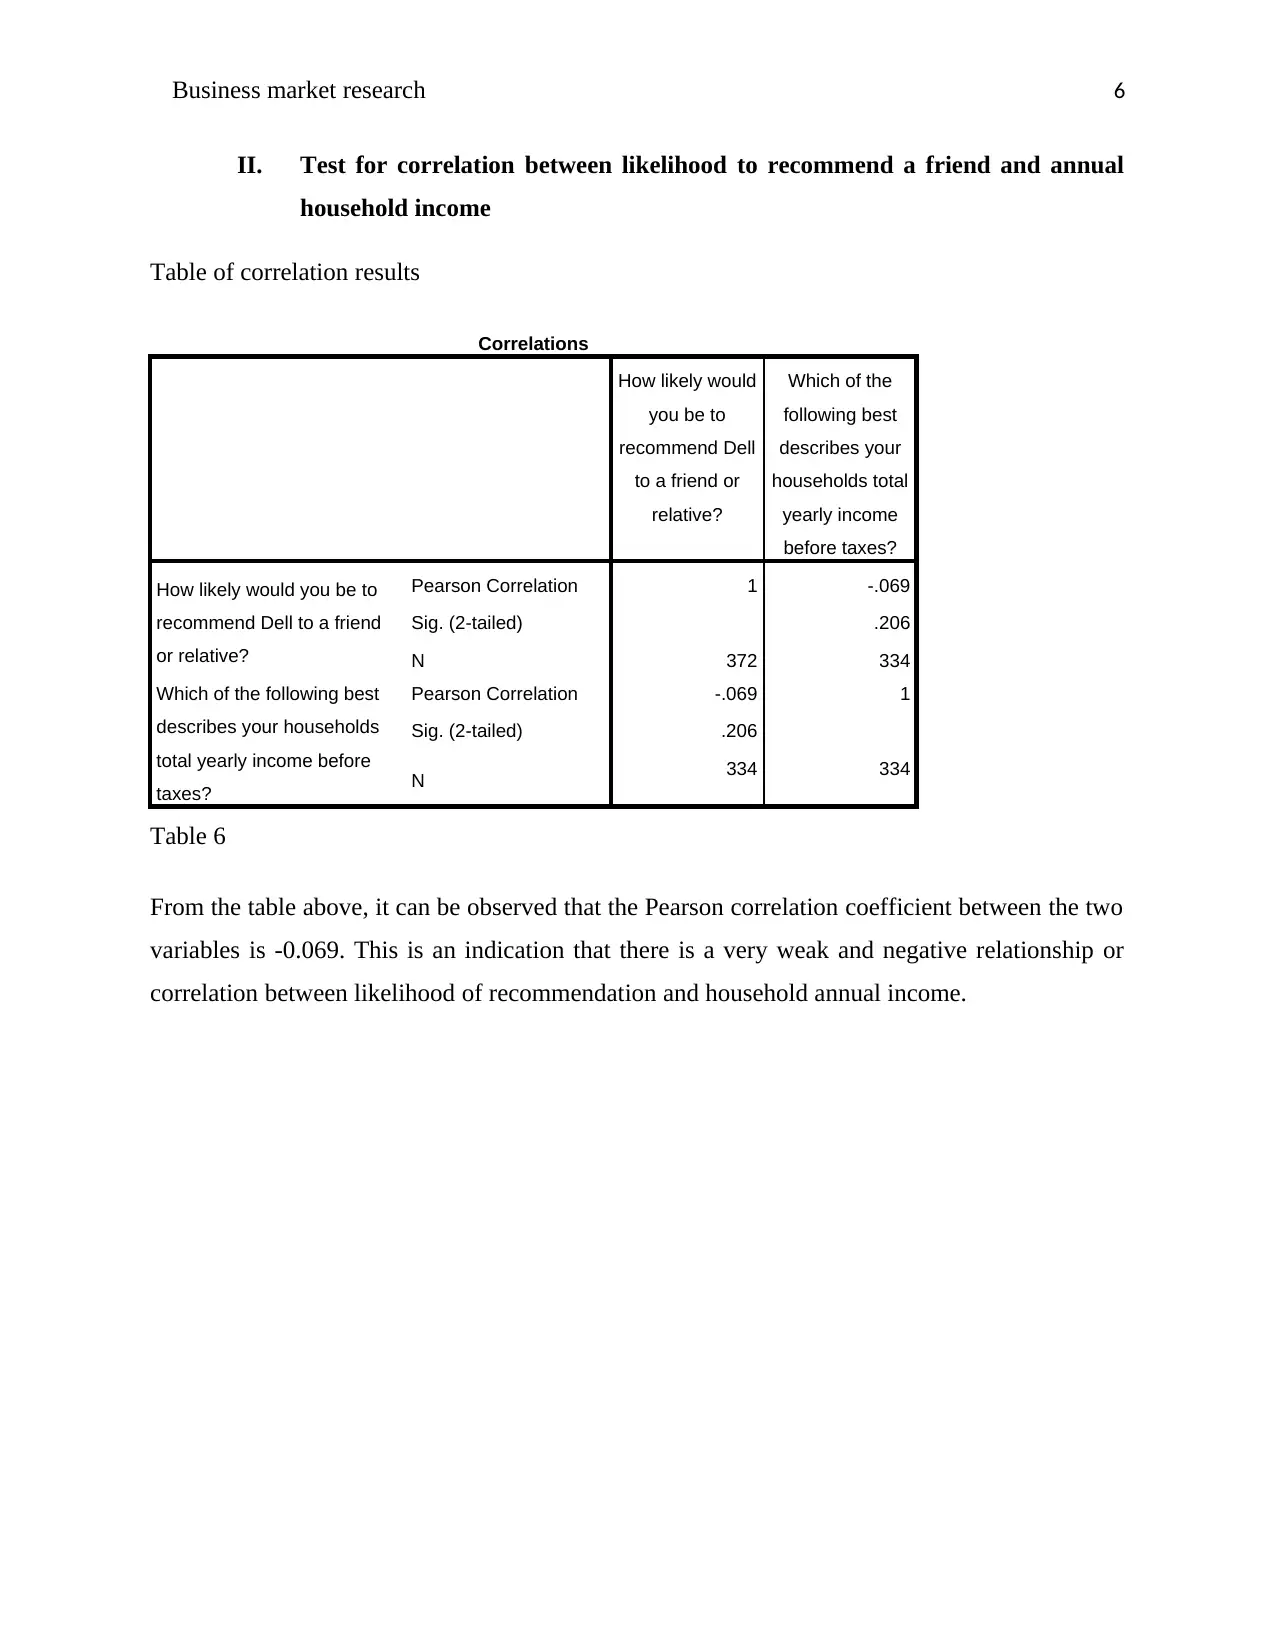
II. Test for correlation between likelihood to recommend a friend and annual
household income
Table of correlation results
Correlations
How likely would
you be to
recommend Dell
to a friend or
relative?
Which of the
following best
describes your
households total
yearly income
before taxes?
How likely would you be to
recommend Dell to a friend
or relative?
Pearson Correlation 1 -.069
Sig. (2-tailed) .206
N 372 334
Which of the following best
describes your households
total yearly income before
taxes?
Pearson Correlation -.069 1
Sig. (2-tailed) .206
N 334 334
Table 6
From the table above, it can be observed that the Pearson correlation coefficient between the two
variables is -0.069. This is an indication that there is a very weak and negative relationship or
correlation between likelihood of recommendation and household annual income.
⊘ This is a preview!⊘
Do you want full access?
Subscribe today to unlock all pages.
Trusted by 1+ million students worldwide
Business market research 7
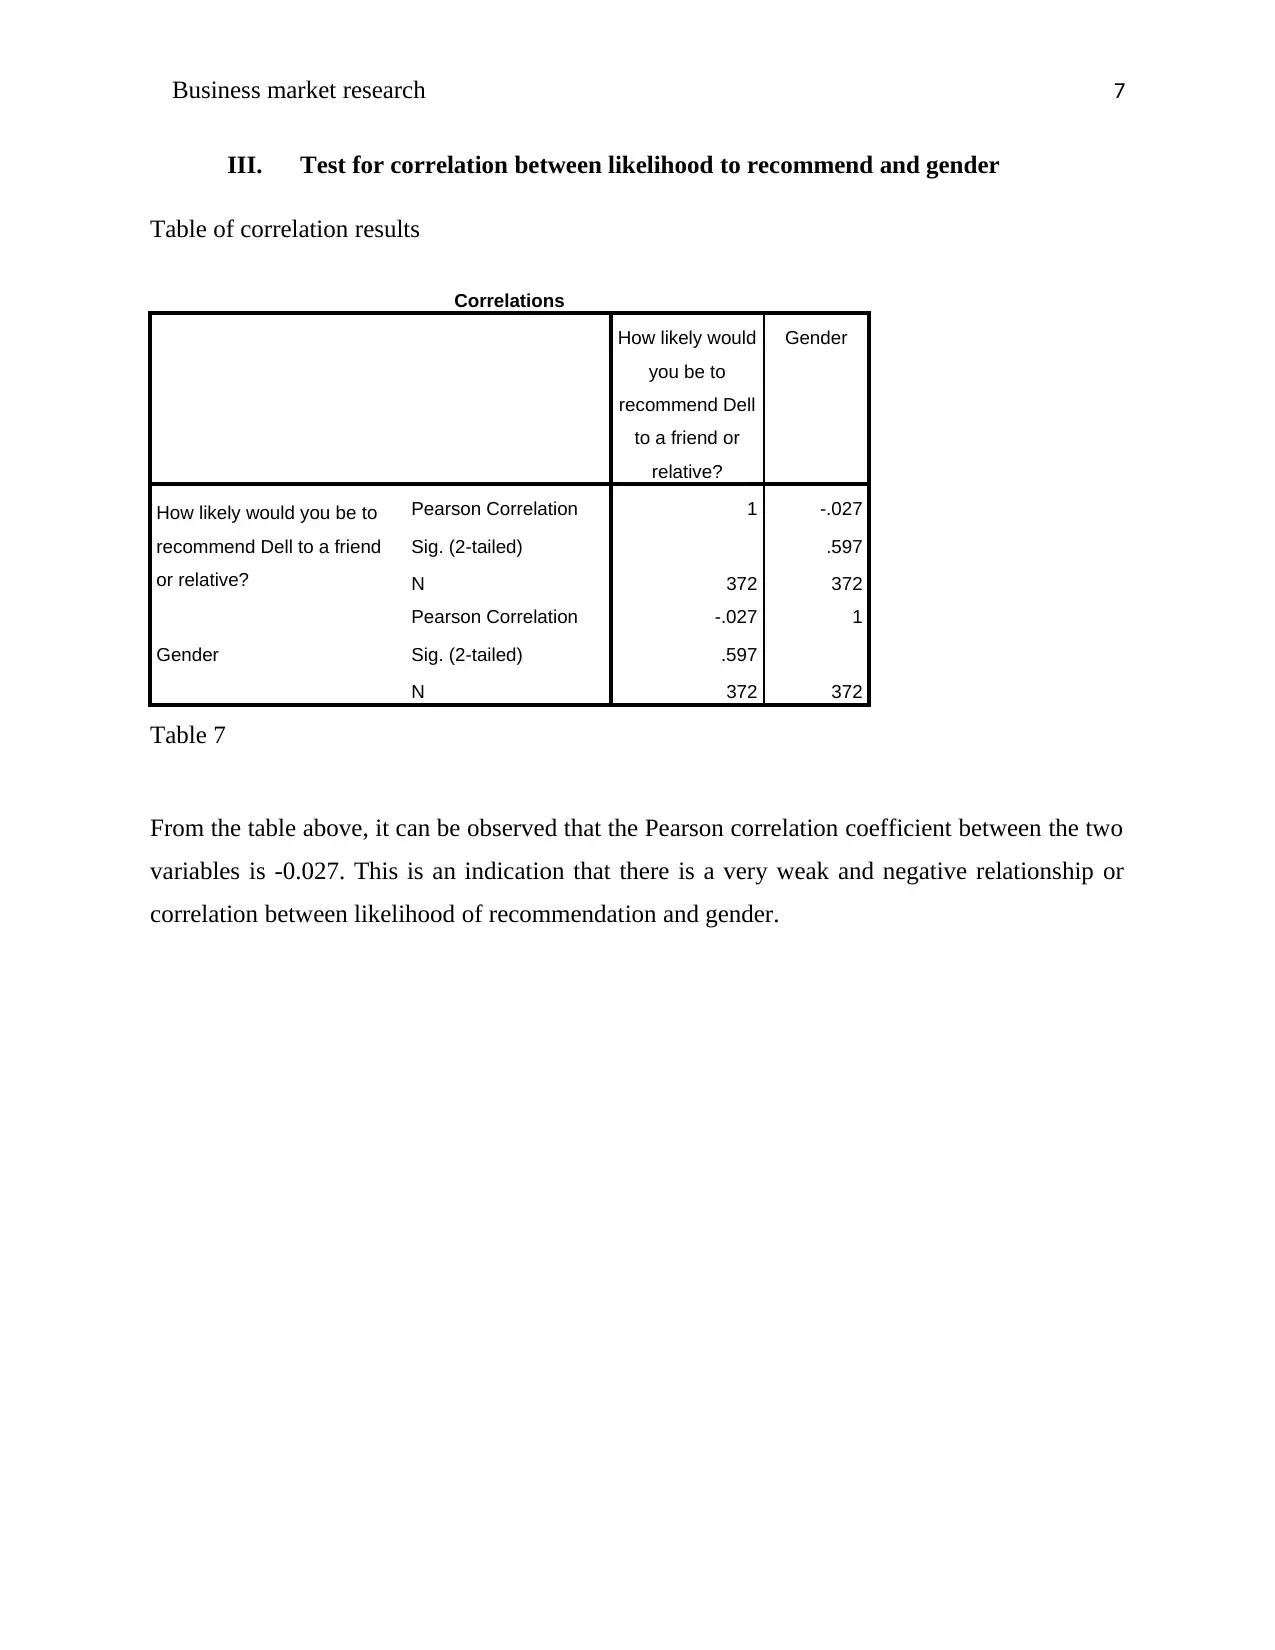
III. Test for correlation between likelihood to recommend and gender
Table of correlation results
Correlations
How likely would
you be to
recommend Dell
to a friend or
relative?
Gender
How likely would you be to
recommend Dell to a friend
or relative?
Pearson Correlation 1 -.027
Sig. (2-tailed) .597
N 372 372
Gender
Pearson Correlation -.027 1
Sig. (2-tailed) .597
N 372 372
Table 7
From the table above, it can be observed that the Pearson correlation coefficient between the two
variables is -0.027. This is an indication that there is a very weak and negative relationship or
correlation between likelihood of recommendation and gender.
Paraphrase This Document
Need a fresh take? Get an instant paraphrase of this document with our AI Paraphraser
Business market research 8
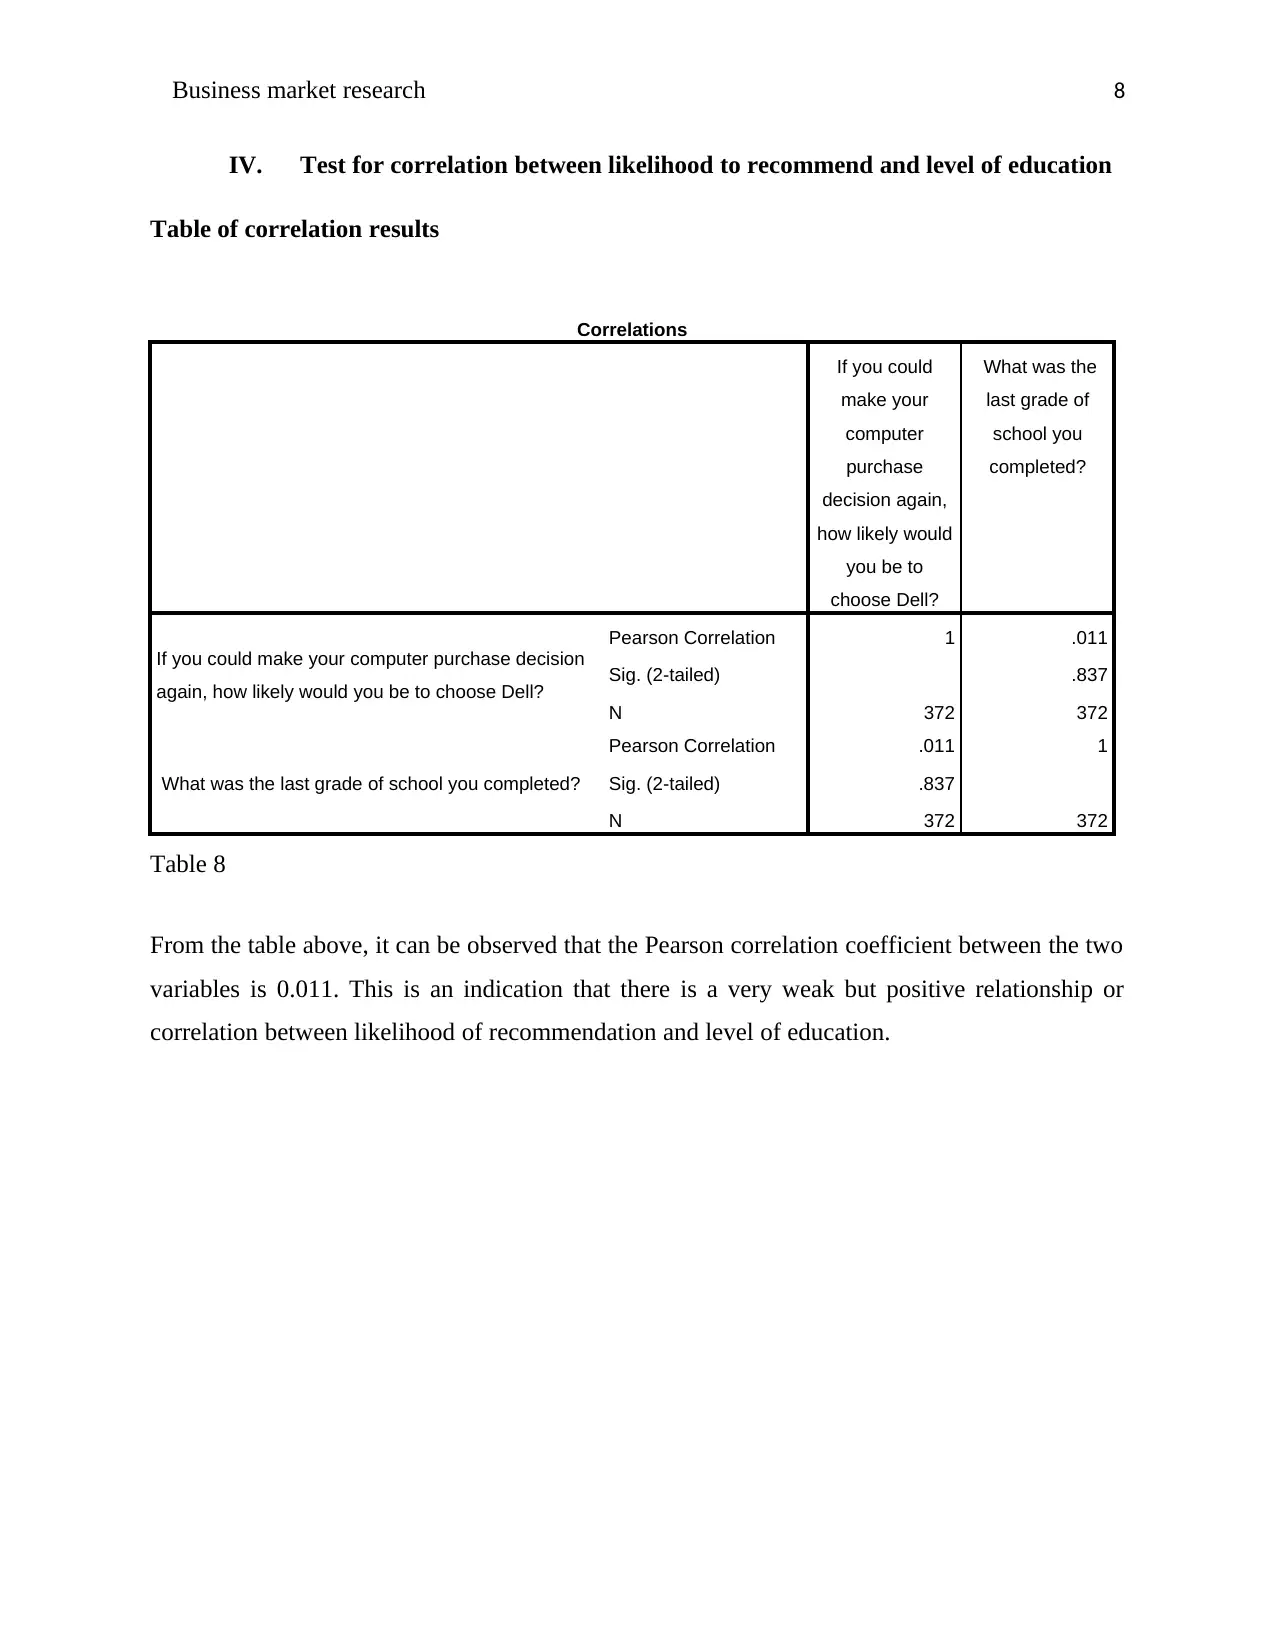
IV. Test for correlation between likelihood to recommend and level of education
Table of correlation results
Correlations
If you could
make your
computer
purchase
decision again,
how likely would
you be to
choose Dell?
What was the
last grade of
school you
completed?
If you could make your computer purchase decision
again, how likely would you be to choose Dell?
Pearson Correlation 1 .011
Sig. (2-tailed) .837
N 372 372
What was the last grade of school you completed?
Pearson Correlation .011 1
Sig. (2-tailed) .837
N 372 372
Table 8
From the table above, it can be observed that the Pearson correlation coefficient between the two
variables is 0.011. This is an indication that there is a very weak but positive relationship or
correlation between likelihood of recommendation and level of education.
Business market research 9
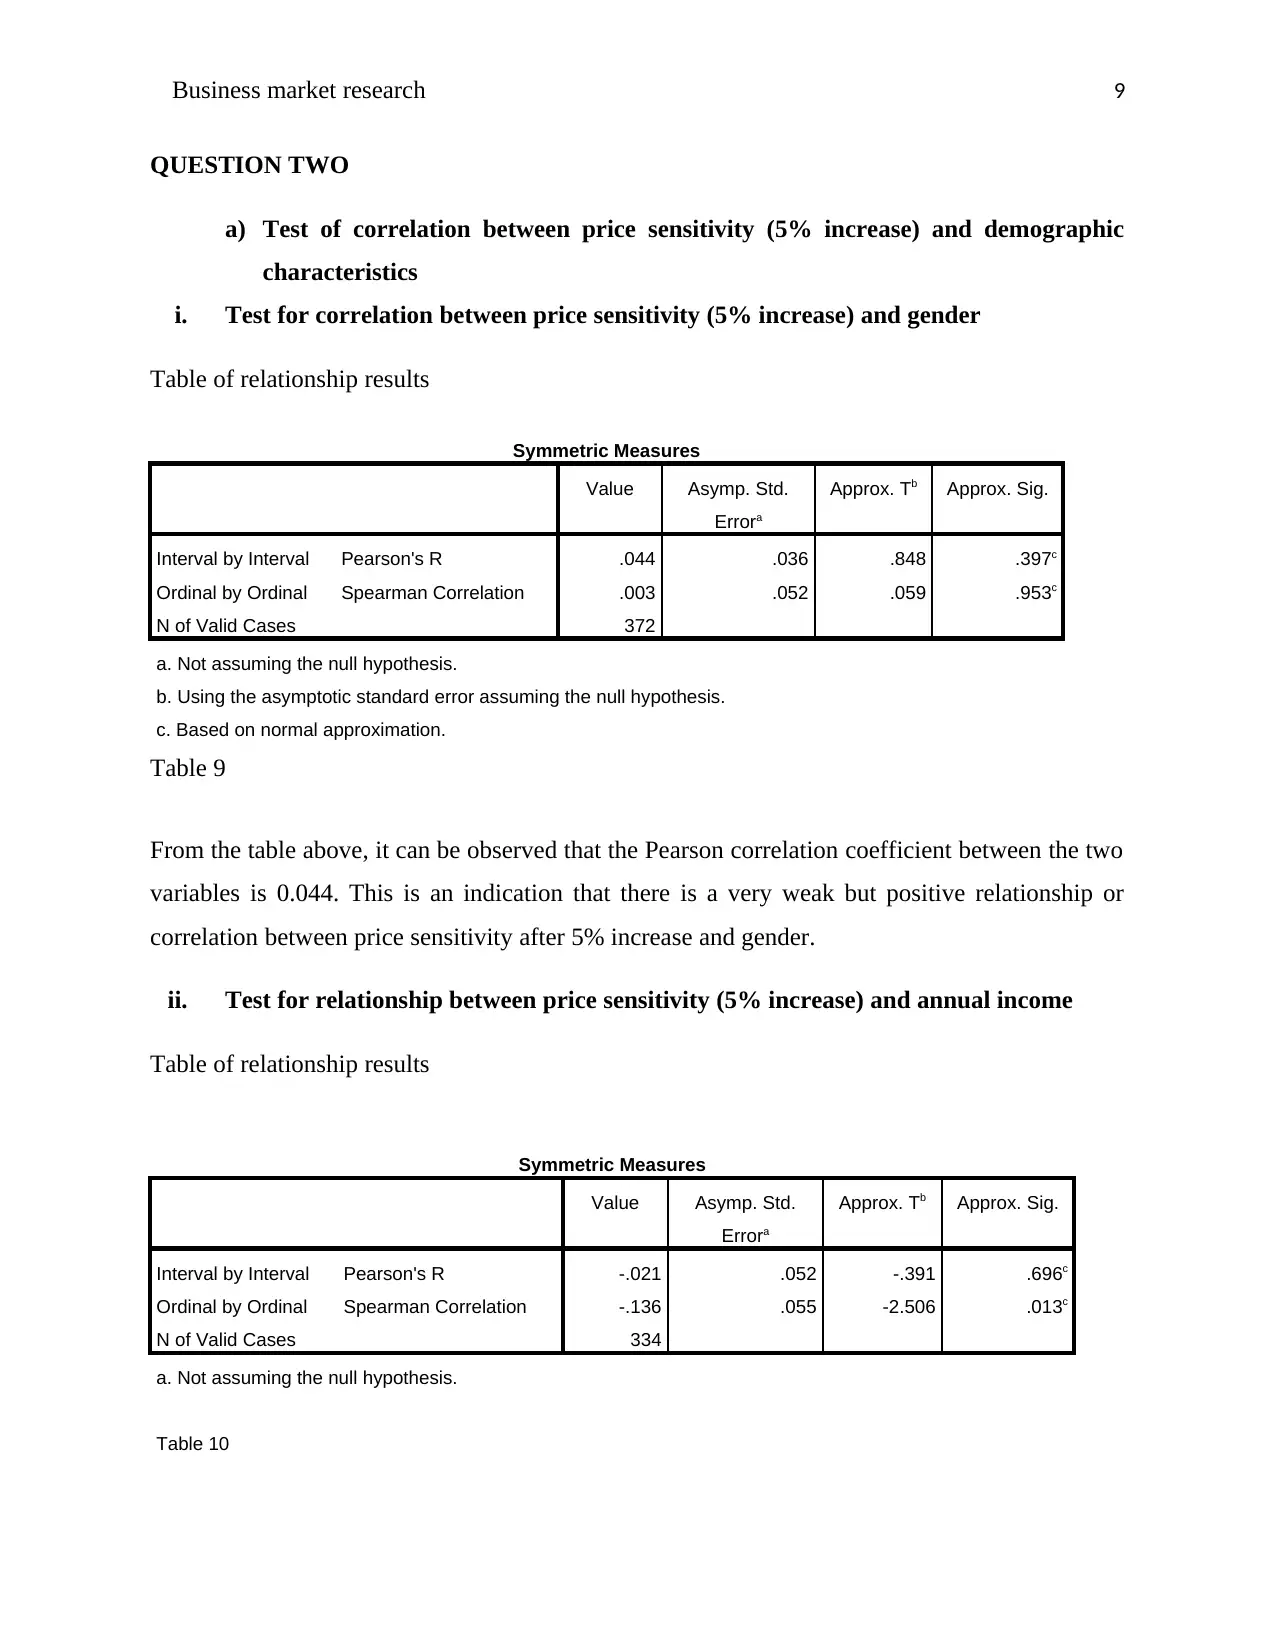
QUESTION TWO
a) Test of correlation between price sensitivity (5% increase) and demographic
characteristics
i. Test for correlation between price sensitivity (5% increase) and gender
Table of relationship results
Symmetric Measures
Value Asymp. Std.
Errora
Approx. Tb Approx. Sig.
Interval by Interval Pearson's R .044 .036 .848 .397c
Ordinal by Ordinal Spearman Correlation .003 .052 .059 .953c
N of Valid Cases 372
a. Not assuming the null hypothesis.
b. Using the asymptotic standard error assuming the null hypothesis.
c. Based on normal approximation.
Table 9
From the table above, it can be observed that the Pearson correlation coefficient between the two
variables is 0.044. This is an indication that there is a very weak but positive relationship or
correlation between price sensitivity after 5% increase and gender.
ii. Test for relationship between price sensitivity (5% increase) and annual income
Table of relationship results
Symmetric Measures
Value Asymp. Std.
Errora
Approx. Tb Approx. Sig.
Interval by Interval Pearson's R -.021 .052 -.391 .696c
Ordinal by Ordinal Spearman Correlation -.136 .055 -2.506 .013c
N of Valid Cases 334
a. Not assuming the null hypothesis.
Table 10
⊘ This is a preview!⊘
Do you want full access?
Subscribe today to unlock all pages.
Trusted by 1+ million students worldwide
Business market research 10
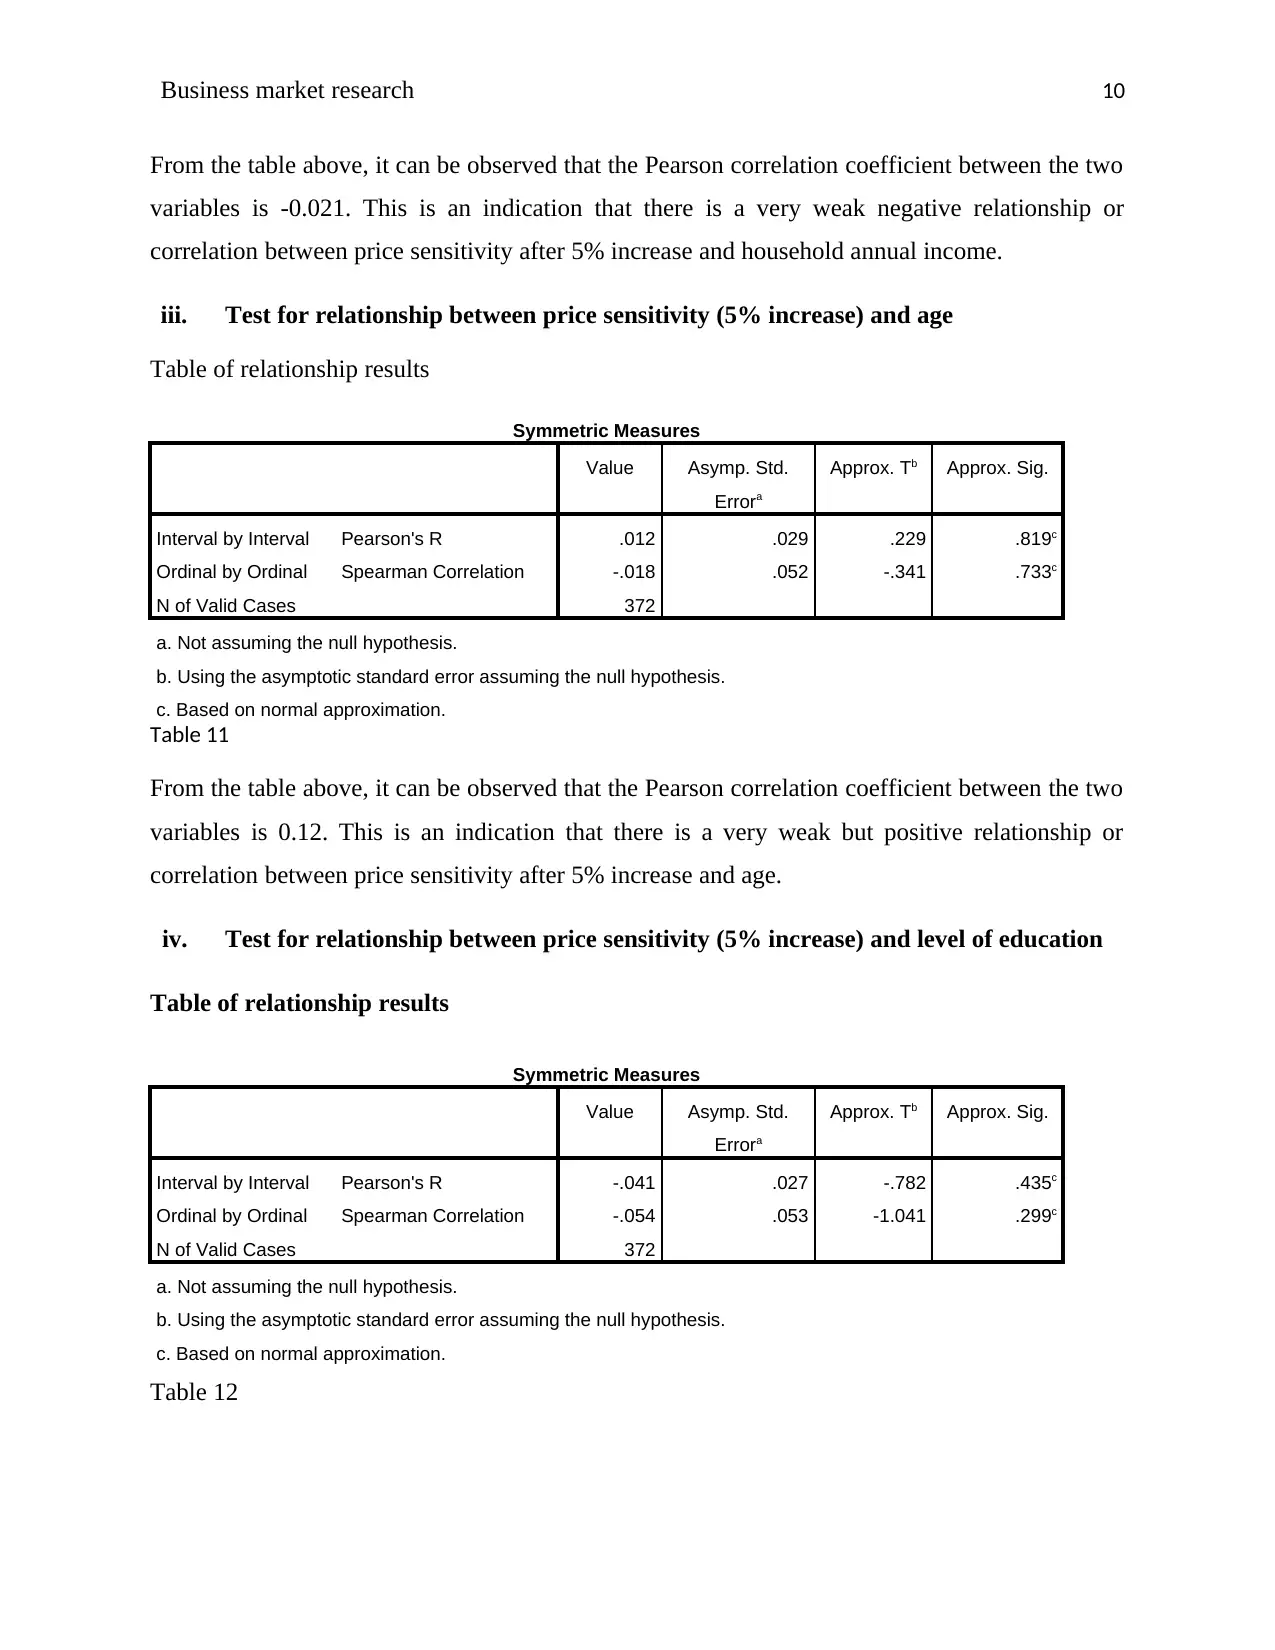
From the table above, it can be observed that the Pearson correlation coefficient between the two
variables is -0.021. This is an indication that there is a very weak negative relationship or
correlation between price sensitivity after 5% increase and household annual income.
iii. Test for relationship between price sensitivity (5% increase) and age
Table of relationship results
Symmetric Measures
Value Asymp. Std.
Errora
Approx. Tb Approx. Sig.
Interval by Interval Pearson's R .012 .029 .229 .819c
Ordinal by Ordinal Spearman Correlation -.018 .052 -.341 .733c
N of Valid Cases 372
a. Not assuming the null hypothesis.
b. Using the asymptotic standard error assuming the null hypothesis.
c. Based on normal approximation.
Table 11
From the table above, it can be observed that the Pearson correlation coefficient between the two
variables is 0.12. This is an indication that there is a very weak but positive relationship or
correlation between price sensitivity after 5% increase and age.
iv. Test for relationship between price sensitivity (5% increase) and level of education
Table of relationship results
Symmetric Measures
Value Asymp. Std.
Errora
Approx. Tb Approx. Sig.
Interval by Interval Pearson's R -.041 .027 -.782 .435c
Ordinal by Ordinal Spearman Correlation -.054 .053 -1.041 .299c
N of Valid Cases 372
a. Not assuming the null hypothesis.
b. Using the asymptotic standard error assuming the null hypothesis.
c. Based on normal approximation.
Table 12
From the table above, it can be observed that the Pearson correlation coefficient between the two
variables is -0.021. This is an indication that there is a very weak negative relationship or
correlation between price sensitivity after 5% increase and household annual income.
iii. Test for relationship between price sensitivity (5% increase) and age
Table of relationship results
Symmetric Measures
Value Asymp. Std.
Errora
Approx. Tb Approx. Sig.
Interval by Interval Pearson's R .012 .029 .229 .819c
Ordinal by Ordinal Spearman Correlation -.018 .052 -.341 .733c
N of Valid Cases 372
a. Not assuming the null hypothesis.
b. Using the asymptotic standard error assuming the null hypothesis.
c. Based on normal approximation.
Table 11
From the table above, it can be observed that the Pearson correlation coefficient between the two
variables is 0.12. This is an indication that there is a very weak but positive relationship or
correlation between price sensitivity after 5% increase and age.
iv. Test for relationship between price sensitivity (5% increase) and level of education
Table of relationship results
Symmetric Measures
Value Asymp. Std.
Errora
Approx. Tb Approx. Sig.
Interval by Interval Pearson's R -.041 .027 -.782 .435c
Ordinal by Ordinal Spearman Correlation -.054 .053 -1.041 .299c
N of Valid Cases 372
a. Not assuming the null hypothesis.
b. Using the asymptotic standard error assuming the null hypothesis.
c. Based on normal approximation.
Table 12
Paraphrase This Document
Need a fresh take? Get an instant paraphrase of this document with our AI Paraphraser
Business market research 11
From the table above, it can be observed that the Pearson correlation coefficient between the two
variables is -0.041. This is an indication that there is a very weak and negative relationship or
correlation between price sensitivity after 5% increase and level of education.
b) Test of correlation between price sensitivity (10% increase) and demographic
characteristics
i. Test for correlation between price sensitivity (10% increase) and gender
Symmetric Measures
Value Asymp. Std.
Errora
Approx. Tb Approx. Sig.
Interval by Interval Pearson's R -.032 .052 -.612 .541c
Ordinal by Ordinal Spearman Correlation -.028 .052 -.546 .585c
N of Valid Cases 372
a. Not assuming the null hypothesis.
b. Using the asymptotic standard error assuming the null hypothesis.
c. Based on normal approximation.
Table 13
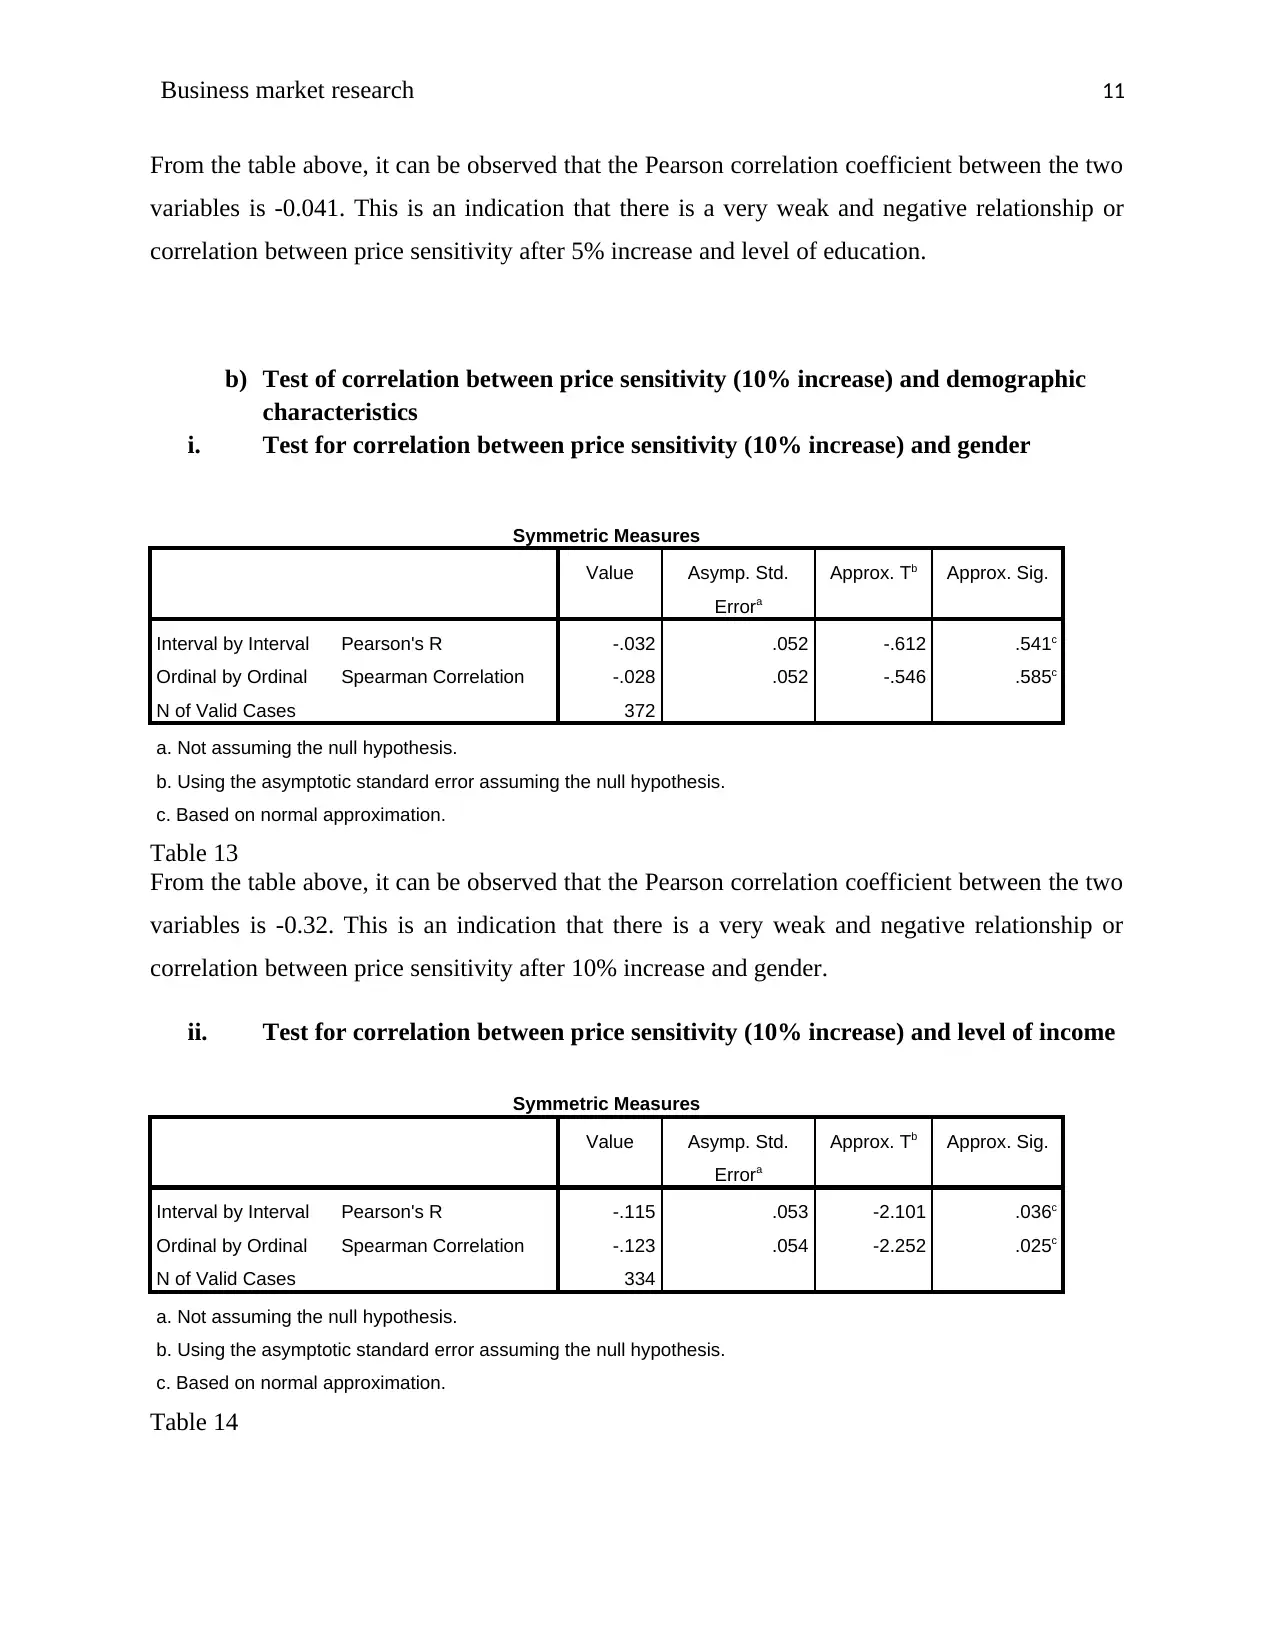
From the table above, it can be observed that the Pearson correlation coefficient between the two
variables is -0.32. This is an indication that there is a very weak and negative relationship or
correlation between price sensitivity after 10% increase and gender.
ii. Test for correlation between price sensitivity (10% increase) and level of income
Symmetric Measures
Value Asymp. Std.
Errora
Approx. Tb Approx. Sig.
Interval by Interval Pearson's R -.115 .053 -2.101 .036c
Ordinal by Ordinal Spearman Correlation -.123 .054 -2.252 .025c
N of Valid Cases 334
a. Not assuming the null hypothesis.
b. Using the asymptotic standard error assuming the null hypothesis.
c. Based on normal approximation.
Table 14
From the table above, it can be observed that the Pearson correlation coefficient between the two
variables is -0.041. This is an indication that there is a very weak and negative relationship or
correlation between price sensitivity after 5% increase and level of education.
b) Test of correlation between price sensitivity (10% increase) and demographic
characteristics
i. Test for correlation between price sensitivity (10% increase) and gender
Symmetric Measures
Value Asymp. Std.
Errora
Approx. Tb Approx. Sig.
Interval by Interval Pearson's R -.032 .052 -.612 .541c
Ordinal by Ordinal Spearman Correlation -.028 .052 -.546 .585c
N of Valid Cases 372
a. Not assuming the null hypothesis.
b. Using the asymptotic standard error assuming the null hypothesis.
c. Based on normal approximation.
Table 13
From the table above, it can be observed that the Pearson correlation coefficient between the two
variables is -0.32. This is an indication that there is a very weak and negative relationship or
correlation between price sensitivity after 10% increase and gender.
ii. Test for correlation between price sensitivity (10% increase) and level of income
Symmetric Measures
Value Asymp. Std.
Errora
Approx. Tb Approx. Sig.
Interval by Interval Pearson's R -.115 .053 -2.101 .036c
Ordinal by Ordinal Spearman Correlation -.123 .054 -2.252 .025c
N of Valid Cases 334
a. Not assuming the null hypothesis.
b. Using the asymptotic standard error assuming the null hypothesis.
c. Based on normal approximation.
Table 14

Business market research 12
From the table above, it can be observed that the Pearson correlation coefficient between the two
variables is -0.115. This is an indication that there is a very weak and negative relationship or
correlation between price sensitivity after 10% increase and level of income.
iii. Test for correlation between sensitivity (10% increase) and age
Symmetric Measures
Value Asymp. Std.
Errora
Approx. Tb Approx. Sig.
Interval by Interval Pearson's R -.019 .054 -.361 .718c
Ordinal by Ordinal Spearman Correlation .008 .053 .159 .874c
N of Valid Cases 372
a. Not assuming the null hypothesis.
b. Using the asymptotic standard error assuming the null hypothesis.
c. Based on normal approximation.
Table 15
From the table above, it can be observed that the Pearson correlation coefficient between the two
variables is -0.019. This is an indication that there is a very weak and negative relationship or
correlation between price sensitivity after 10% increase and age.
iv. Test for correlation between sensitivity (10% increase) and level of education
Results table
Symmetric Measures
Value Asymp. Std.
Errora
Approx. Tb Approx. Sig.
Interval by Interval Pearson's R -.064 .056 -1.240 .216c
Ordinal by Ordinal Spearman Correlation -.062 .052 -1.198 .232c
N of Valid Cases 372
a. Not assuming the null hypothesis.
b. Using the asymptotic standard error assuming the null hypothesis.
c. Based on normal approximation.
Table 16
From the table above, it can be observed that the Pearson correlation coefficient between the two
variables is -0.115. This is an indication that there is a very weak and negative relationship or
correlation between price sensitivity after 10% increase and level of income.
iii. Test for correlation between sensitivity (10% increase) and age
Symmetric Measures
Value Asymp. Std.
Errora
Approx. Tb Approx. Sig.
Interval by Interval Pearson's R -.019 .054 -.361 .718c
Ordinal by Ordinal Spearman Correlation .008 .053 .159 .874c
N of Valid Cases 372
a. Not assuming the null hypothesis.
b. Using the asymptotic standard error assuming the null hypothesis.
c. Based on normal approximation.
Table 15
From the table above, it can be observed that the Pearson correlation coefficient between the two
variables is -0.019. This is an indication that there is a very weak and negative relationship or
correlation between price sensitivity after 10% increase and age.
iv. Test for correlation between sensitivity (10% increase) and level of education
Results table
Symmetric Measures
Value Asymp. Std.
Errora
Approx. Tb Approx. Sig.
Interval by Interval Pearson's R -.064 .056 -1.240 .216c
Ordinal by Ordinal Spearman Correlation -.062 .052 -1.198 .232c
N of Valid Cases 372
a. Not assuming the null hypothesis.
b. Using the asymptotic standard error assuming the null hypothesis.
c. Based on normal approximation.
Table 16
⊘ This is a preview!⊘
Do you want full access?
Subscribe today to unlock all pages.
Trusted by 1+ million students worldwide
1 out of 26
Related Documents


Your All-in-One AI-Powered Toolkit for Academic Success.
+13062052269
info@desklib.com
Available 24*7 on WhatsApp / Email
![[object Object]](/_next/static/media/star-bottom.7253800d.svg)
Unlock your academic potential
Copyright © 2020–2026 A2Z Services. All Rights Reserved. Developed and managed by ZUCOL.