ACC511 Managerial Finance: Dell Inc. Plant Investment Project Report
VerifiedAdded on 2022/11/14
|10
|1566
|318
Report
AI Summary
This report evaluates a proposed investment project by Dell Inc. to establish a new laptop manufacturing plant. The analysis utilizes capital investment appraisal techniques such as Net Present Value (NPV), Internal Rate of Return (IRR), and payback period to determine the project's financial viability. The report includes calculations for yearly depreciation, cash flows, and project-specific risk assessments. It also addresses whether the project meets the requirements of annual bank installments. The conclusion recommends investment in the project based on positive NPV, a higher IRR than the cost of capital, and a payback period under four years, along with the project's capacity to meet annual financial obligations. The report provides a detailed breakdown of cash flows and assesses project-specific risks, offering a comprehensive financial analysis of the proposed investment.

ACC511- Managerial Finance
Paraphrase This Document
Need a fresh take? Get an instant paraphrase of this document with our AI Paraphraser
Executive Summary
The aim of this report is to evaluate the investment project considered by Dell Inc
through using capital appraisal techniques. Dell Inc wants to establish the manufacturing plant
for laptops in new region and wants to know whether project will successful or not. Results
gathered through applying the capital investment techniques has shown that it is good to make
investment in new project as it has positive NPV and higher IRR as compared to cost of capital.
The cash flows generated by the project are enough to pay for the annual loan installments.
Contents
Executive Summary.........................................................................................................................2
Introduction......................................................................................................................................4
Solutions to question 1: Application of capital investment techniques...........................................4
A) Yearly Depreciation Expense.................................................................................................4
B) Yearly cash flows associated with the plant from year 1 to 9.................................................4
C) Cash flows associated with year 0..........................................................................................5
D) Cash flows in year 10..............................................................................................................6
E) NPV of the project...................................................................................................................6
F) IRR and Payback Period..........................................................................................................6
G) Discussion on project specific risk.........................................................................................7
Solutions to question 2: Project evaluation on whether it meets the requirement of annual bank
installments......................................................................................................................................8
2. A: Answer to memo question...................................................................................................8
2. B: Feedback..............................................................................................................................8
Conclusion and recommendation....................................................................................................8
References........................................................................................................................................9
⊘ This is a preview!⊘
Do you want full access?
Subscribe today to unlock all pages.
Trusted by 1+ million students worldwide
Introduction
The purpose of the report is to evaluate the Dell Inc. project of establishing the new
manufacturing plant for producing Laptops. Project has been evaluated through using capital
investment appraisal techniques such payback period, internal rate of return (IRR) and net
present value (NPV). In addition to this project has evaluated on ground that cash flows
generated by project every year is enough to pay for annual loan repayments.
Solutions to question 1: Application of capital investment techniques
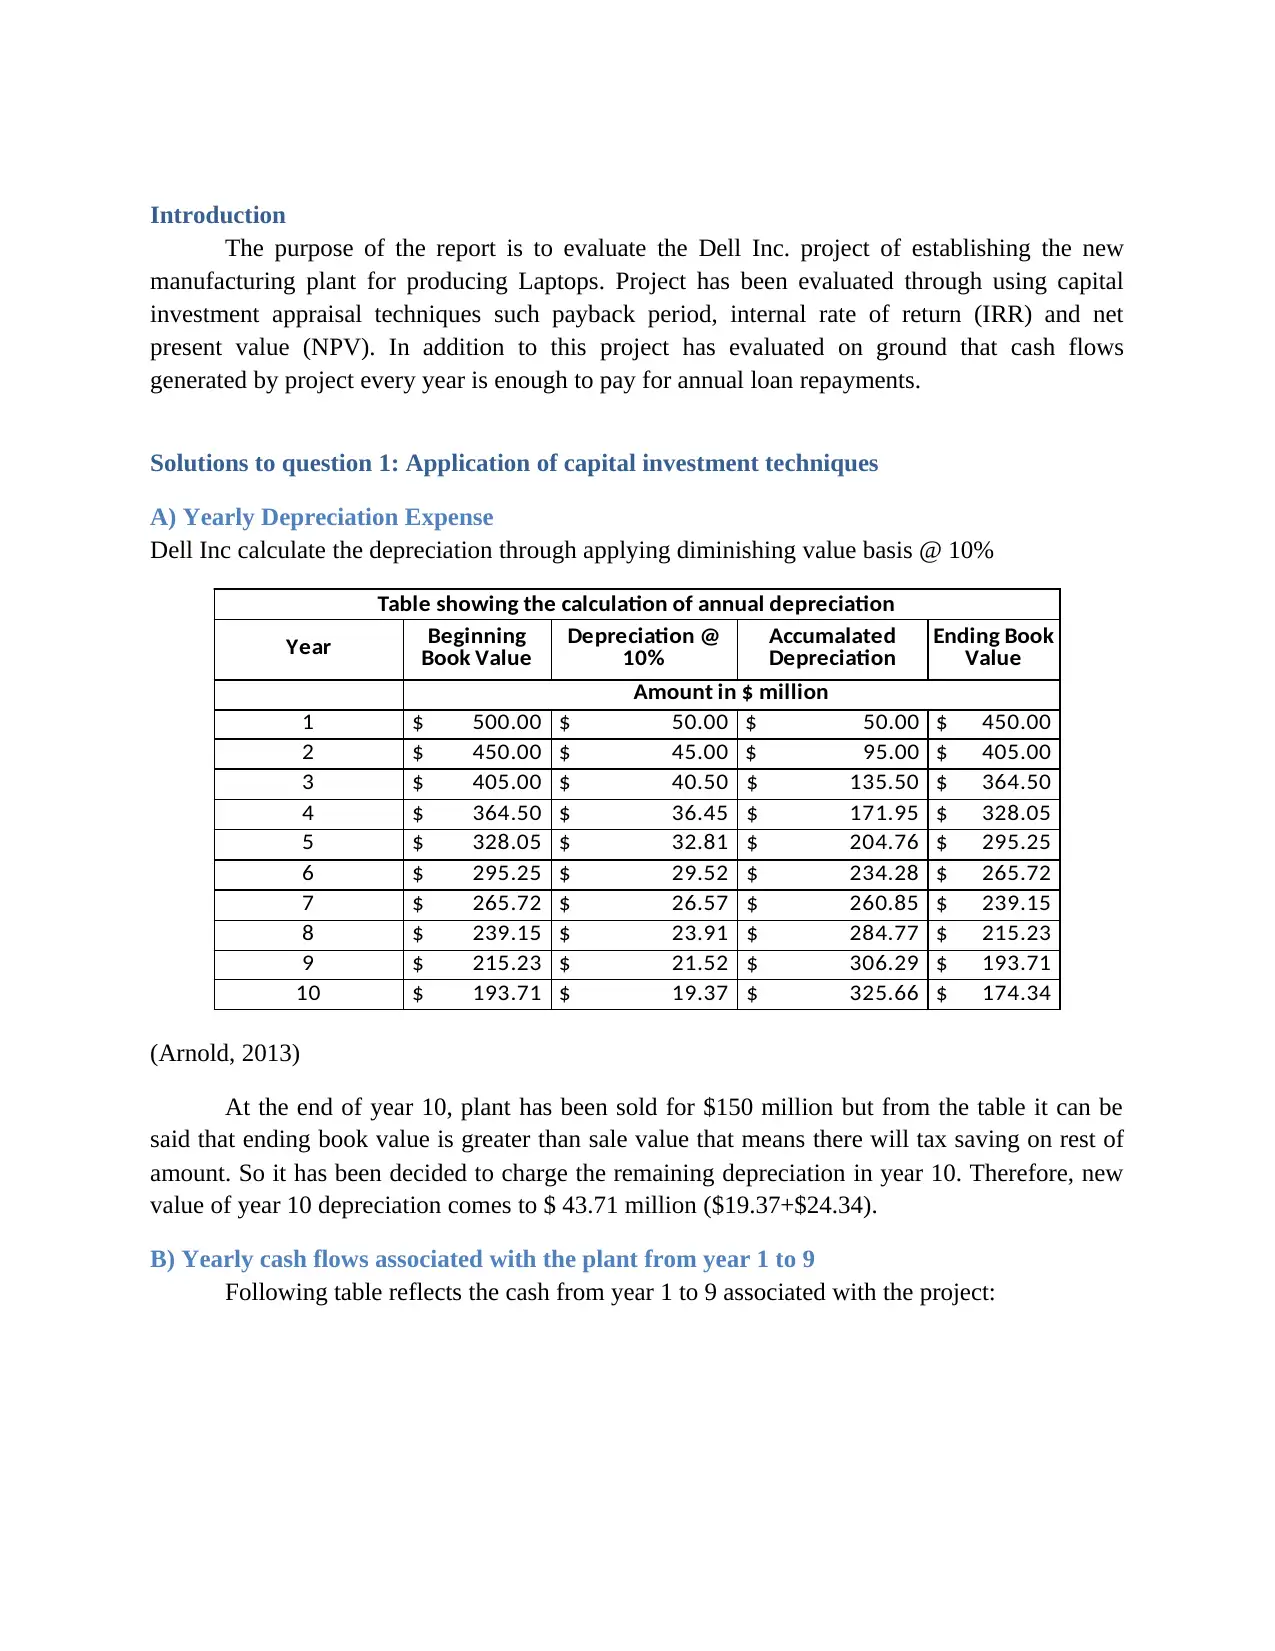
A) Yearly Depreciation Expense
Dell Inc calculate the depreciation through applying diminishing value basis @ 10%
Table showing the calculation of annual depreciation
Year
Amount in $ million
1 $ 500.00 $ 50.00 $ 50.00 $ 450.00
2 $ 450.00 $ 45.00 $ 95.00 $ 405.00
3 $ 405.00 $ 40.50 $ 135.50 $ 364.50
4 $ 364.50 $ 36.45 $ 171.95 $ 328.05
5 $ 328.05 $ 32.81 $ 204.76 $ 295.25
6 $ 295.25 $ 29.52 $ 234.28 $ 265.72
7 $ 265.72 $ 26.57 $ 260.85 $ 239.15
8 $ 239.15 $ 23.91 $ 284.77 $ 215.23
9 $ 215.23 $ 21.52 $ 306.29 $ 193.71
10 $ 193.71 $ 19.37 $ 325.66 $ 174.34
Beginning
Book Value
Depreciation @
10%
Accumalated
Depreciation
Ending Book
Value
(Arnold, 2013)
At the end of year 10, plant has been sold for $150 million but from the table it can be
said that ending book value is greater than sale value that means there will tax saving on rest of
amount. So it has been decided to charge the remaining depreciation in year 10. Therefore, new
value of year 10 depreciation comes to $ 43.71 million ($19.37+$24.34).
B) Yearly cash flows associated with the plant from year 1 to 9
Following table reflects the cash from year 1 to 9 associated with the project:
The purpose of the report is to evaluate the Dell Inc. project of establishing the new
manufacturing plant for producing Laptops. Project has been evaluated through using capital
investment appraisal techniques such payback period, internal rate of return (IRR) and net
present value (NPV). In addition to this project has evaluated on ground that cash flows
generated by project every year is enough to pay for annual loan repayments.
Solutions to question 1: Application of capital investment techniques
A) Yearly Depreciation Expense
Dell Inc calculate the depreciation through applying diminishing value basis @ 10%
Table showing the calculation of annual depreciation
Year
Amount in $ million
1 $ 500.00 $ 50.00 $ 50.00 $ 450.00
2 $ 450.00 $ 45.00 $ 95.00 $ 405.00
3 $ 405.00 $ 40.50 $ 135.50 $ 364.50
4 $ 364.50 $ 36.45 $ 171.95 $ 328.05
5 $ 328.05 $ 32.81 $ 204.76 $ 295.25
6 $ 295.25 $ 29.52 $ 234.28 $ 265.72
7 $ 265.72 $ 26.57 $ 260.85 $ 239.15
8 $ 239.15 $ 23.91 $ 284.77 $ 215.23
9 $ 215.23 $ 21.52 $ 306.29 $ 193.71
10 $ 193.71 $ 19.37 $ 325.66 $ 174.34
Beginning
Book Value
Depreciation @
10%
Accumalated
Depreciation
Ending Book
Value
(Arnold, 2013)
At the end of year 10, plant has been sold for $150 million but from the table it can be
said that ending book value is greater than sale value that means there will tax saving on rest of
amount. So it has been decided to charge the remaining depreciation in year 10. Therefore, new
value of year 10 depreciation comes to $ 43.71 million ($19.37+$24.34).
B) Yearly cash flows associated with the plant from year 1 to 9
Following table reflects the cash from year 1 to 9 associated with the project:
Paraphrase This Document
Need a fresh take? Get an instant paraphrase of this document with our AI Paraphraser
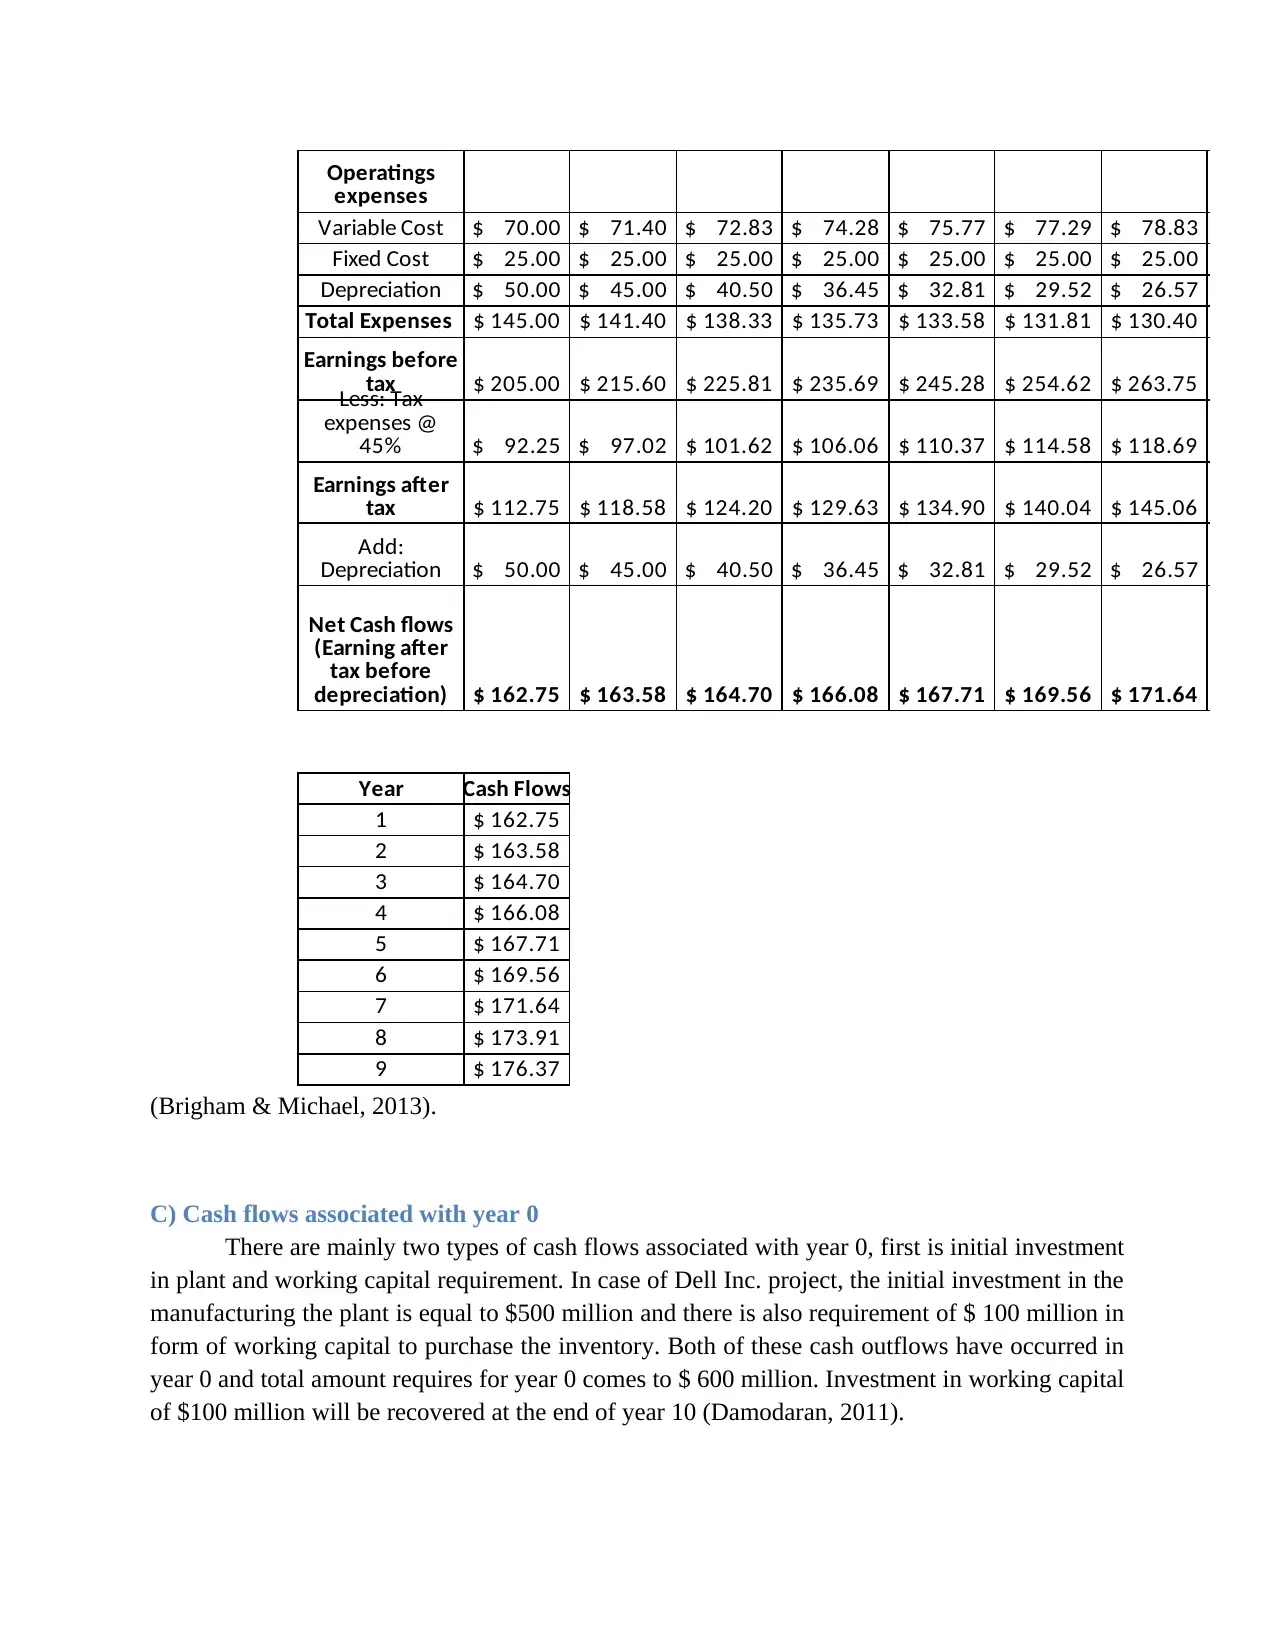
Variable Cost $ 70.00 $ 71.40 $ 72.83 $ 74.28 $ 75.77 $ 77.29 $ 78.83
Fixed Cost $ 25.00 $ 25.00 $ 25.00 $ 25.00 $ 25.00 $ 25.00 $ 25.00
Depreciation $ 50.00 $ 45.00 $ 40.50 $ 36.45 $ 32.81 $ 29.52 $ 26.57
Total Expenses $ 145.00 $ 141.40 $ 138.33 $ 135.73 $ 133.58 $ 131.81 $ 130.40
$ 205.00 $ 215.60 $ 225.81 $ 235.69 $ 245.28 $ 254.62 $ 263.75
$ 92.25 $ 97.02 $ 101.62 $ 106.06 $ 110.37 $ 114.58 $ 118.69
$ 112.75 $ 118.58 $ 124.20 $ 129.63 $ 134.90 $ 140.04 $ 145.06
$ 50.00 $ 45.00 $ 40.50 $ 36.45 $ 32.81 $ 29.52 $ 26.57
$ 162.75 $ 163.58 $ 164.70 $ 166.08 $ 167.71 $ 169.56 $ 171.64
Year Cash Flows
1 $ 162.75
2 $ 163.58
3 $ 164.70
4 $ 166.08
5 $ 167.71
6 $ 169.56
7 $ 171.64
8 $ 173.91
9 $ 176.37
Operatings
expenses
Earnings before
tax
Less: Tax
expenses @
45%
Earnings after
tax
Add:
Depreciation
Net Cash flows
(Earning after
tax before
depreciation)
(Brigham & Michael, 2013).
C) Cash flows associated with year 0
There are mainly two types of cash flows associated with year 0, first is initial investment
in plant and working capital requirement. In case of Dell Inc. project, the initial investment in the
manufacturing the plant is equal to $500 million and there is also requirement of $ 100 million in
form of working capital to purchase the inventory. Both of these cash outflows have occurred in
year 0 and total amount requires for year 0 comes to $ 600 million. Investment in working capital
of $100 million will be recovered at the end of year 10 (Damodaran, 2011).
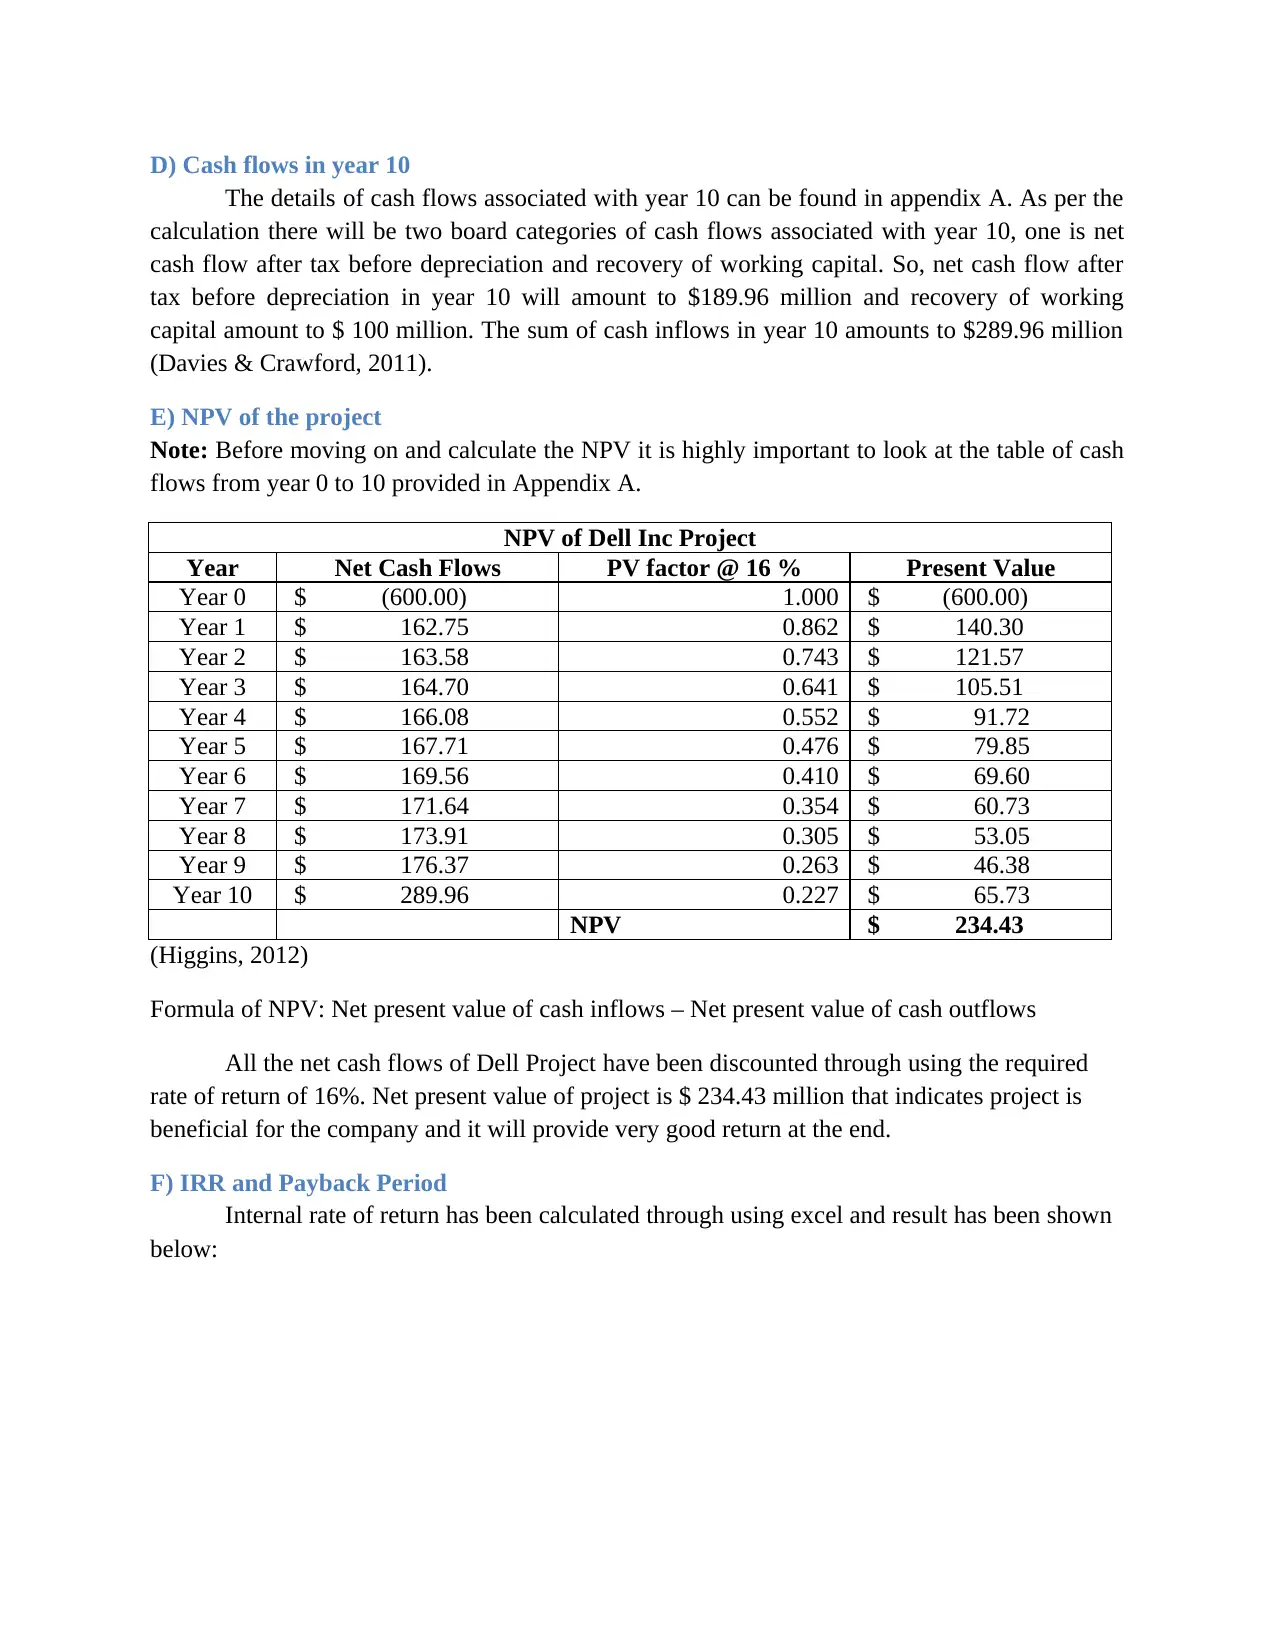
D) Cash flows in year 10
The details of cash flows associated with year 10 can be found in appendix A. As per the
calculation there will be two board categories of cash flows associated with year 10, one is net
cash flow after tax before depreciation and recovery of working capital. So, net cash flow after
tax before depreciation in year 10 will amount to $189.96 million and recovery of working
capital amount to $ 100 million. The sum of cash inflows in year 10 amounts to $289.96 million
(Davies & Crawford, 2011).
E) NPV of the project
Note: Before moving on and calculate the NPV it is highly important to look at the table of cash
flows from year 0 to 10 provided in Appendix A.
NPV of Dell Inc Project
Year Net Cash Flows PV factor @ 16 % Present Value
Year 0 $ (600.00) 1.000 $ (600.00)
Year 1 $ 162.75 0.862 $ 140.30
Year 2 $ 163.58 0.743 $ 121.57
Year 3 $ 164.70 0.641 $ 105.51
Year 4 $ 166.08 0.552 $ 91.72
Year 5 $ 167.71 0.476 $ 79.85
Year 6 $ 169.56 0.410 $ 69.60
Year 7 $ 171.64 0.354 $ 60.73
Year 8 $ 173.91 0.305 $ 53.05
Year 9 $ 176.37 0.263 $ 46.38
Year 10 $ 289.96 0.227 $ 65.73
NPV $ 234.43
(Higgins, 2012)
Formula of NPV: Net present value of cash inflows – Net present value of cash outflows
All the net cash flows of Dell Project have been discounted through using the required
rate of return of 16%. Net present value of project is $ 234.43 million that indicates project is
beneficial for the company and it will provide very good return at the end.
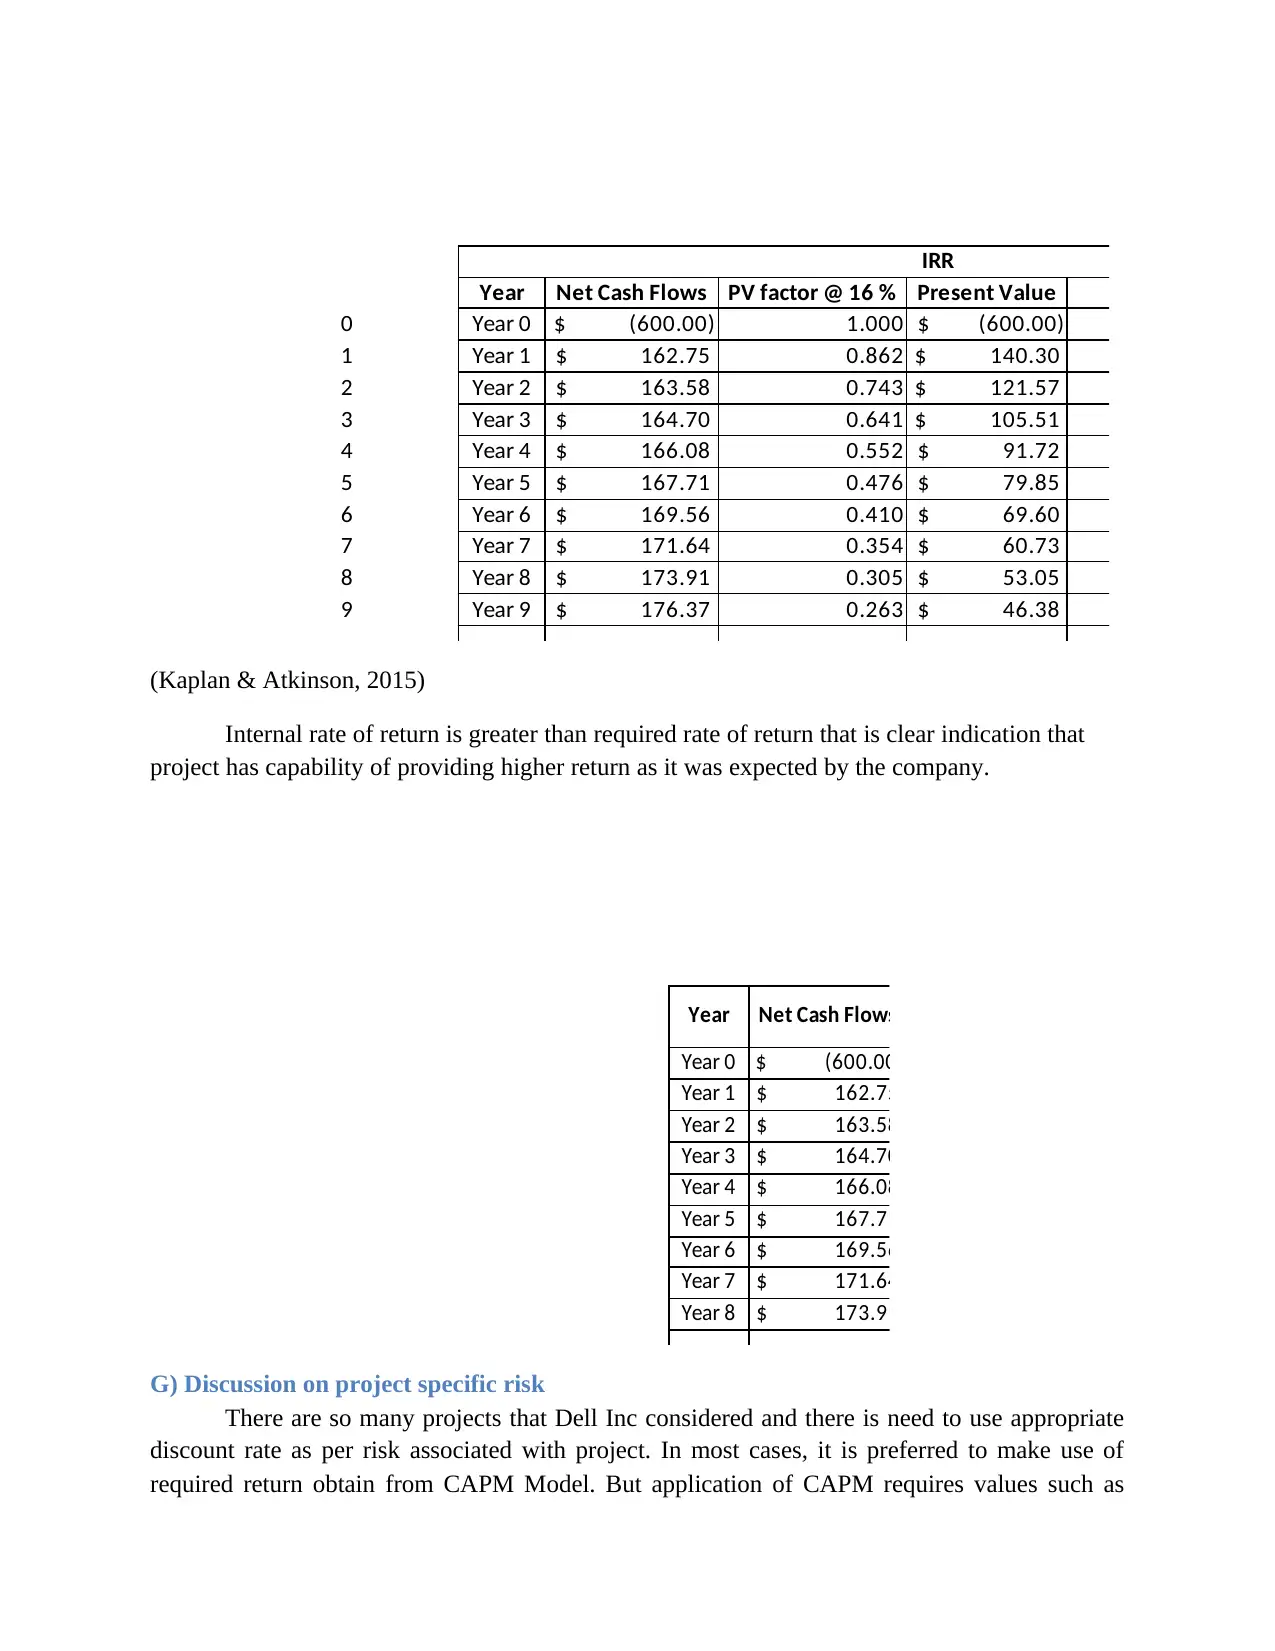
F) IRR and Payback Period
Internal rate of return has been calculated through using excel and result has been shown
below:
The details of cash flows associated with year 10 can be found in appendix A. As per the
calculation there will be two board categories of cash flows associated with year 10, one is net
cash flow after tax before depreciation and recovery of working capital. So, net cash flow after
tax before depreciation in year 10 will amount to $189.96 million and recovery of working
capital amount to $ 100 million. The sum of cash inflows in year 10 amounts to $289.96 million
(Davies & Crawford, 2011).
E) NPV of the project
Note: Before moving on and calculate the NPV it is highly important to look at the table of cash
flows from year 0 to 10 provided in Appendix A.
NPV of Dell Inc Project
Year Net Cash Flows PV factor @ 16 % Present Value
Year 0 $ (600.00) 1.000 $ (600.00)
Year 1 $ 162.75 0.862 $ 140.30
Year 2 $ 163.58 0.743 $ 121.57
Year 3 $ 164.70 0.641 $ 105.51
Year 4 $ 166.08 0.552 $ 91.72
Year 5 $ 167.71 0.476 $ 79.85
Year 6 $ 169.56 0.410 $ 69.60
Year 7 $ 171.64 0.354 $ 60.73
Year 8 $ 173.91 0.305 $ 53.05
Year 9 $ 176.37 0.263 $ 46.38
Year 10 $ 289.96 0.227 $ 65.73
NPV $ 234.43
(Higgins, 2012)
Formula of NPV: Net present value of cash inflows – Net present value of cash outflows
All the net cash flows of Dell Project have been discounted through using the required
rate of return of 16%. Net present value of project is $ 234.43 million that indicates project is
beneficial for the company and it will provide very good return at the end.
F) IRR and Payback Period
Internal rate of return has been calculated through using excel and result has been shown
below:
⊘ This is a preview!⊘
Do you want full access?
Subscribe today to unlock all pages.
Trusted by 1+ million students worldwide
IRR
Year Net Cash Flows PV factor @ 16 % Present Value
0 Year 0 $ (600.00) 1.000 $ (600.00)
1 Year 1 $ 162.75 0.862 $ 140.30
2 Year 2 $ 163.58 0.743 $ 121.57
3 Year 3 $ 164.70 0.641 $ 105.51
4 Year 4 $ 166.08 0.552 $ 91.72
5 Year 5 $ 167.71 0.476 $ 79.85
6 Year 6 $ 169.56 0.410 $ 69.60
7 Year 7 $ 171.64 0.354 $ 60.73
8 Year 8 $ 173.91 0.305 $ 53.05
9 Year 9 $ 176.37 0.263 $ 46.38
(Kaplan & Atkinson, 2015)
Internal rate of return is greater than required rate of return that is clear indication that
project has capability of providing higher return as it was expected by the company.
Year Net Cash Flows
Year 0 $ (600.00)
Year 1 $ 162.75
Year 2 $ 163.58
Year 3 $ 164.70
Year 4 $ 166.08
Year 5 $ 167.71
Year 6 $ 169.56
Year 7 $ 171.64
Year 8 $ 173.91
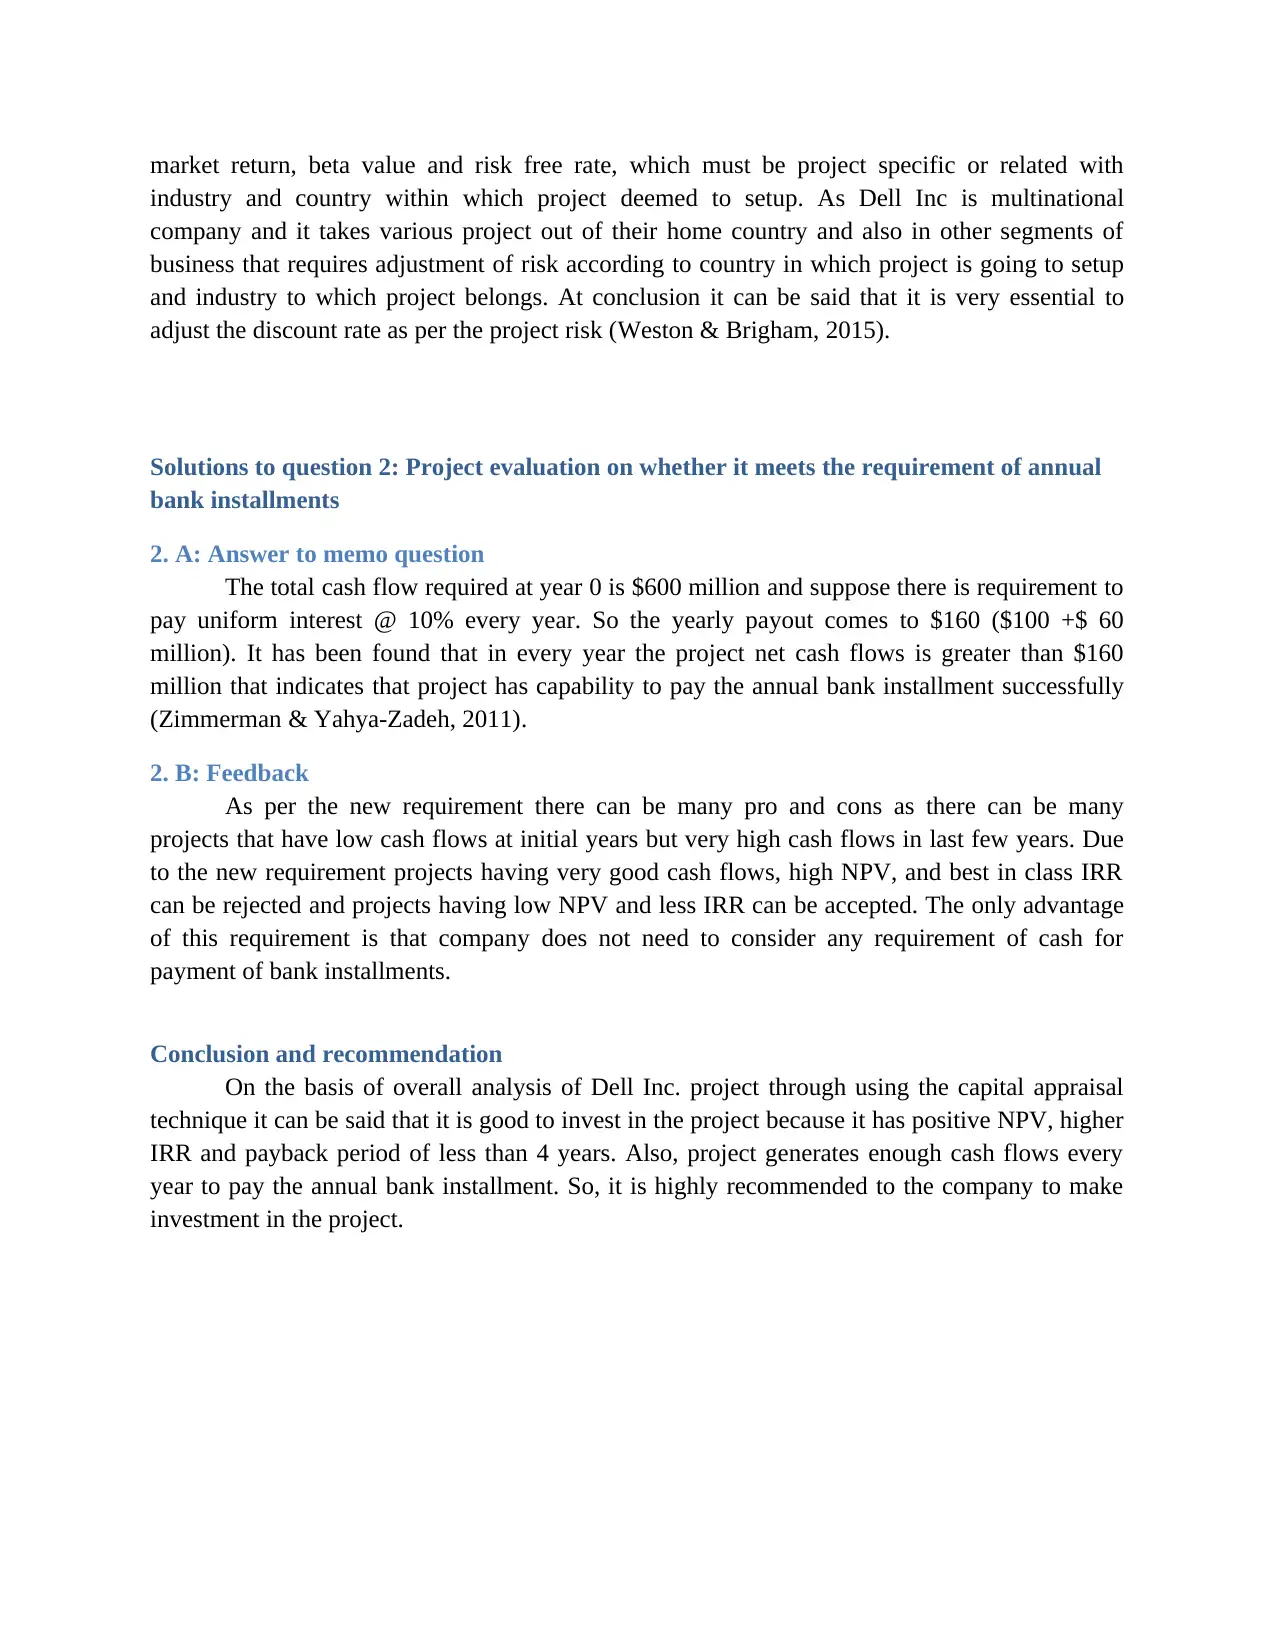
G) Discussion on project specific risk
There are so many projects that Dell Inc considered and there is need to use appropriate
discount rate as per risk associated with project. In most cases, it is preferred to make use of
required return obtain from CAPM Model. But application of CAPM requires values such as
Year Net Cash Flows PV factor @ 16 % Present Value
0 Year 0 $ (600.00) 1.000 $ (600.00)
1 Year 1 $ 162.75 0.862 $ 140.30
2 Year 2 $ 163.58 0.743 $ 121.57
3 Year 3 $ 164.70 0.641 $ 105.51
4 Year 4 $ 166.08 0.552 $ 91.72
5 Year 5 $ 167.71 0.476 $ 79.85
6 Year 6 $ 169.56 0.410 $ 69.60
7 Year 7 $ 171.64 0.354 $ 60.73
8 Year 8 $ 173.91 0.305 $ 53.05
9 Year 9 $ 176.37 0.263 $ 46.38
(Kaplan & Atkinson, 2015)
Internal rate of return is greater than required rate of return that is clear indication that
project has capability of providing higher return as it was expected by the company.
Year Net Cash Flows
Year 0 $ (600.00)
Year 1 $ 162.75
Year 2 $ 163.58
Year 3 $ 164.70
Year 4 $ 166.08
Year 5 $ 167.71
Year 6 $ 169.56
Year 7 $ 171.64
Year 8 $ 173.91
G) Discussion on project specific risk
There are so many projects that Dell Inc considered and there is need to use appropriate
discount rate as per risk associated with project. In most cases, it is preferred to make use of
required return obtain from CAPM Model. But application of CAPM requires values such as
Paraphrase This Document
Need a fresh take? Get an instant paraphrase of this document with our AI Paraphraser
market return, beta value and risk free rate, which must be project specific or related with
industry and country within which project deemed to setup. As Dell Inc is multinational
company and it takes various project out of their home country and also in other segments of
business that requires adjustment of risk according to country in which project is going to setup
and industry to which project belongs. At conclusion it can be said that it is very essential to
adjust the discount rate as per the project risk (Weston & Brigham, 2015).
Solutions to question 2: Project evaluation on whether it meets the requirement of annual
bank installments
2. A: Answer to memo question
The total cash flow required at year 0 is $600 million and suppose there is requirement to
pay uniform interest @ 10% every year. So the yearly payout comes to $160 ($100 +$ 60
million). It has been found that in every year the project net cash flows is greater than $160
million that indicates that project has capability to pay the annual bank installment successfully
(Zimmerman & Yahya-Zadeh, 2011).
2. B: Feedback
As per the new requirement there can be many pro and cons as there can be many
projects that have low cash flows at initial years but very high cash flows in last few years. Due
to the new requirement projects having very good cash flows, high NPV, and best in class IRR
can be rejected and projects having low NPV and less IRR can be accepted. The only advantage
of this requirement is that company does not need to consider any requirement of cash for
payment of bank installments.
Conclusion and recommendation
On the basis of overall analysis of Dell Inc. project through using the capital appraisal
technique it can be said that it is good to invest in the project because it has positive NPV, higher
IRR and payback period of less than 4 years. Also, project generates enough cash flows every
year to pay the annual bank installment. So, it is highly recommended to the company to make
investment in the project.
References
Arnold, G., (2013). Corporate financial management. USA: Pearson Higher Ed.
Brigham, F., & Michael C. (2013). Financial management: Theory & practice. Canada: Cengage
Learning.
Damodaran, A, (2011). Applied corporate finance. USA: John Wiley & sons.
Davies, T. & Crawford, I., (2011). Business accounting and finance. USA: Pearson.
Higgins, R. C., (2012). Analysis for financial management. McGraw-Hill/Irwin.
Kaplan, R.S. & Atkinson, A.A., (2015). Advanced management accounting. PHI Learning.
Weston, J.F. & Brigham, E.F., (2015). Managerial finance. Hinsdale, IL: Dryden Press.
Zimmerman, J.L. & Yahya-Zadeh, M., (2011). Accounting for decision making and
control. Issues in Accounting Education, 26(1), pp.258-259.
⊘ This is a preview!⊘
Do you want full access?
Subscribe today to unlock all pages.
Trusted by 1+ million students worldwide
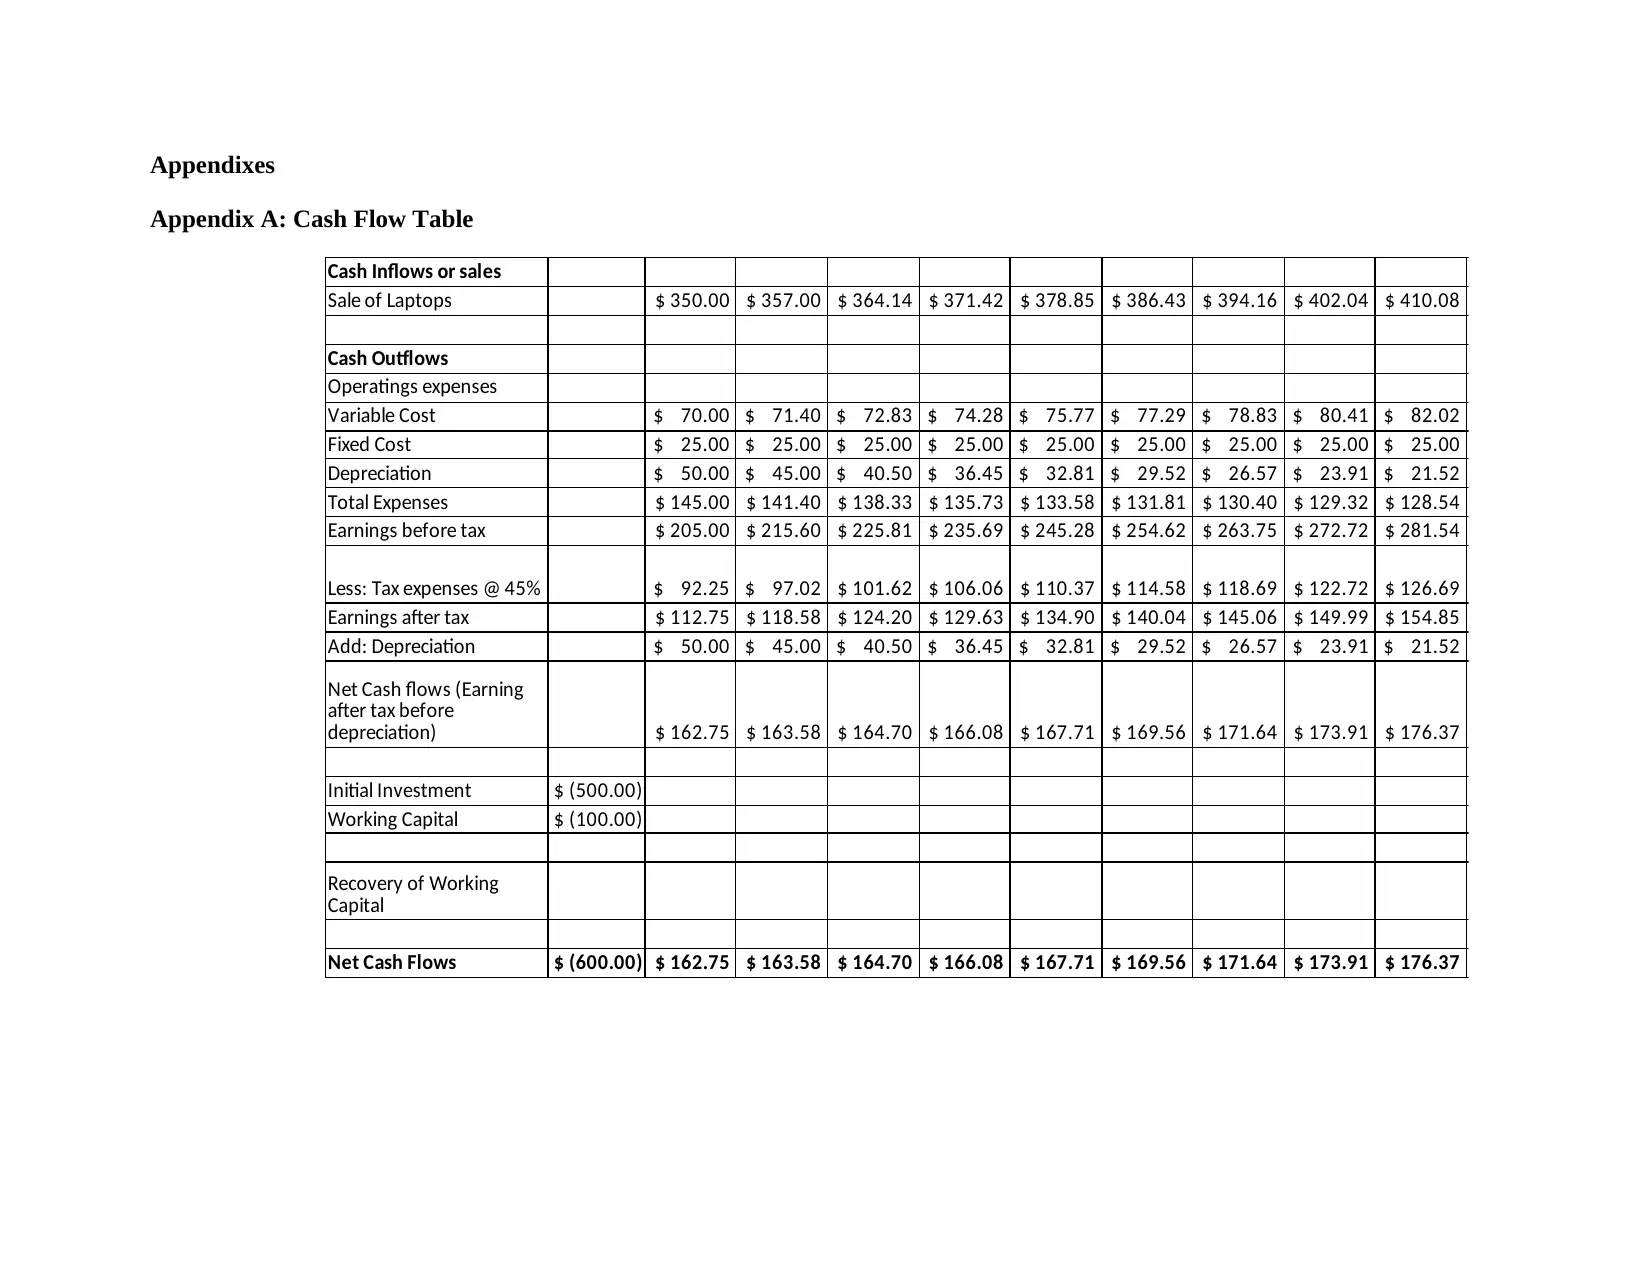
Appendixes
Appendix A: Cash Flow Table
Cash Inflows or sales
Sale of Laptops $ 350.00 $ 357.00 $ 364.14 $ 371.42 $ 378.85 $ 386.43 $ 394.16 $ 402.04 $ 410.08
Cash Outflows
Operatings expenses
Variable Cost $ 70.00 $ 71.40 $ 72.83 $ 74.28 $ 75.77 $ 77.29 $ 78.83 $ 80.41 $ 82.02
Fixed Cost $ 25.00 $ 25.00 $ 25.00 $ 25.00 $ 25.00 $ 25.00 $ 25.00 $ 25.00 $ 25.00
Depreciation $ 50.00 $ 45.00 $ 40.50 $ 36.45 $ 32.81 $ 29.52 $ 26.57 $ 23.91 $ 21.52
Total Expenses $ 145.00 $ 141.40 $ 138.33 $ 135.73 $ 133.58 $ 131.81 $ 130.40 $ 129.32 $ 128.54
Earnings before tax $ 205.00 $ 215.60 $ 225.81 $ 235.69 $ 245.28 $ 254.62 $ 263.75 $ 272.72 $ 281.54
Less: Tax expenses @ 45% $ 92.25 $ 97.02 $ 101.62 $ 106.06 $ 110.37 $ 114.58 $ 118.69 $ 122.72 $ 126.69
Earnings after tax $ 112.75 $ 118.58 $ 124.20 $ 129.63 $ 134.90 $ 140.04 $ 145.06 $ 149.99 $ 154.85
Add: Depreciation $ 50.00 $ 45.00 $ 40.50 $ 36.45 $ 32.81 $ 29.52 $ 26.57 $ 23.91 $ 21.52
$ 162.75 $ 163.58 $ 164.70 $ 166.08 $ 167.71 $ 169.56 $ 171.64 $ 173.91 $ 176.37
Initial Investment $ (500.00)
Working Capital $ (100.00)
Net Cash Flows $ (600.00) $ 162.75 $ 163.58 $ 164.70 $ 166.08 $ 167.71 $ 169.56 $ 171.64 $ 173.91 $ 176.37
Net Cash flows (Earning
after tax before
depreciation)
Recovery of Working
Capital
1 out of 10
Related Documents


Your All-in-One AI-Powered Toolkit for Academic Success.
+13062052269
info@desklib.com
Available 24*7 on WhatsApp / Email
![[object Object]](/_next/static/media/star-bottom.7253800d.svg)
Unlock your academic potential
Copyright © 2020–2026 A2Z Services. All Rights Reserved. Developed and managed by ZUCOL.