ECON6000 - Economic Report: Demand Analysis of Schmeckt Gut in Atollia
VerifiedAdded on 2023/03/23
|20
|4346
|31
Report
AI Summary
This report provides a comprehensive demand analysis of Schmeckt Gut in Atollia, focusing on the impact of inflation, income growth, and tariff rates. It examines demand and supply dynamics, aggregate supply and demand, the Phillips curve, and the Laffer curve. A regression analysis explores the relationship between these economic variables and Schmeckt Gut's demand. The report finds that while income growth can increase demand, tariffs and inflation can create economic challenges, including supply shocks and stagflation. The nature of the goods being sold by Schmeckt Gut (necessities, luxuries or inferior) will have a strong effect on the impact of income level changes. The report concludes with recommendations for Schmeckt Gut to navigate these economic factors effectively and improve the overall level of product demand.
Running head: ECONOMICS ASSIGNMENT
Economics Assignment
Name of the Student
Name of the University
Author Note
Economics Assignment
Name of the Student
Name of the University
Author Note
Paraphrase This Document
Need a fresh take? Get an instant paraphrase of this document with our AI Paraphraser
1ECONOMICS ASSIGNMENT
Executive Summary
The main focus of this paper is to provide a comprehensive
explanation and analysis of the demand of Schmeckt Gut. The paper will
majorly focus on the growth of inflation rate, income growth and tariff rate
growth. Inflation poses a number of economic consequences to
Government, firms and households. There are a number of causes and
forms of inflation. Tariffs and income levels play an important role in
facilitating the demand of goods and services. Also, a regression analysis
will be undertaken to examine the existing relationship among the
dependent and independent variables. The paper will provide
recommendations and draw a conclusion on the main aspects discussed.
2ECONOMICS ASSIGNMENT
Table of Contents
Introduction................................................................................................................................3
Demand and Supply...................................................................................................................3
Demand and Supply and supply curve.......................................................................................4
The aggregate supply/aggregate demand...................................................................................4
Aggregate supply shocks............................................................................................................6
Aggregate supply shocks curve..................................................................................................6
The Phillips curve......................................................................................................................7
The Laffercurve..........................................................................................................................7
SECTION 2................................................................................................................................8
Impacts of Tariff rate growth, Inflation and Yon Schmeckt Gut demand.................................8
Part B........................................................................................................................................10
Regression Analysis.................................................................................................................10
Recommendations....................................................................................................................13
References................................................................................................................................14
Appendix…………………………………………………………………………………….15
⊘ This is a preview!⊘
Do you want full access?
Subscribe today to unlock all pages.
Trusted by 1+ million students worldwide
3ECONOMICS ASSIGNMENT
Introduction
A number of factors need to be given prudent attention by Schmeck Gut if the launch is to
be very successful and they include; the economic levels of Growth, inflation and import
tariffs. There is need for much focus to be put on the various projections and their overall
influence in the market for schmeck Gut to succeed in the market. Afonso and Kazemi
(2017), defines a tarrif as a tax which is put on goods that have been imported. In most cases
taxes are imposed for purposes of achieving particular objectives like consumer protection
and growth of the domestic industries. Akimaya and Dahl (2018), defines inflation as the
general persistent rise in the goods and services prices. There various negative effects brought
about by inflation such as exchange rate depreciation. Alan & Stuart (2011), defines income
increase as the general consumer disposable income improvement. Basing on whether the
good is a necessity, inferior, given or normal, as income increase there is an improvement on
the overall levels of purchasing power. Thus the level of inflation, income growth and tariff
levels affect or determine the overall movement of the supply curve, aggregate demand
curves, Phillip’s curve and Laffer curve. In other words where there non cases of inflation or
tariffs, demand increases as the level of income rises. Additionally, tariffs increase is usually
brought about by increases in the levels of income depending on whether they are high or
marginal. Also, Bolshaw (2012), states that tariffs and incomes are affected by an increase in
the level of inflation.
Demand and supply
A five percent (5%) increase in the level of income may lead to shortages due to the increase
levels of demand of a particular product, Hence for Schmeck Gut to ensure that it can supply
enough in the area of operation; it has to ensure that more factors of production such as
Paraphrase This Document
Need a fresh take? Get an instant paraphrase of this document with our AI Paraphraser
4ECONOMICS ASSIGNMENT
capital and labor are employed. Also, there has to be an improvement in the incentive levels
like wages for purposes of enhancing or boosting the overall level of production. It is
important to note that supply shocks arise in the market when an increase in demand is not
accompanied by enhanced levels of production. Hence one can assert that inflation increases
by a level of 2% when the level of income increases by 5% (percent). Baumol (2016)
explains that when tariffs increase by ten percent (10%), also income rises by (5%) as result
of high prices for the goods imported. Burke & Abayasekara (2018), believes that there is a
fall in the demand of the overall imported products or goods when tariffs are raised by (10%).
Also rises in the levels of tariffs lead to an increase in the total demand of domestically
produced items or products.
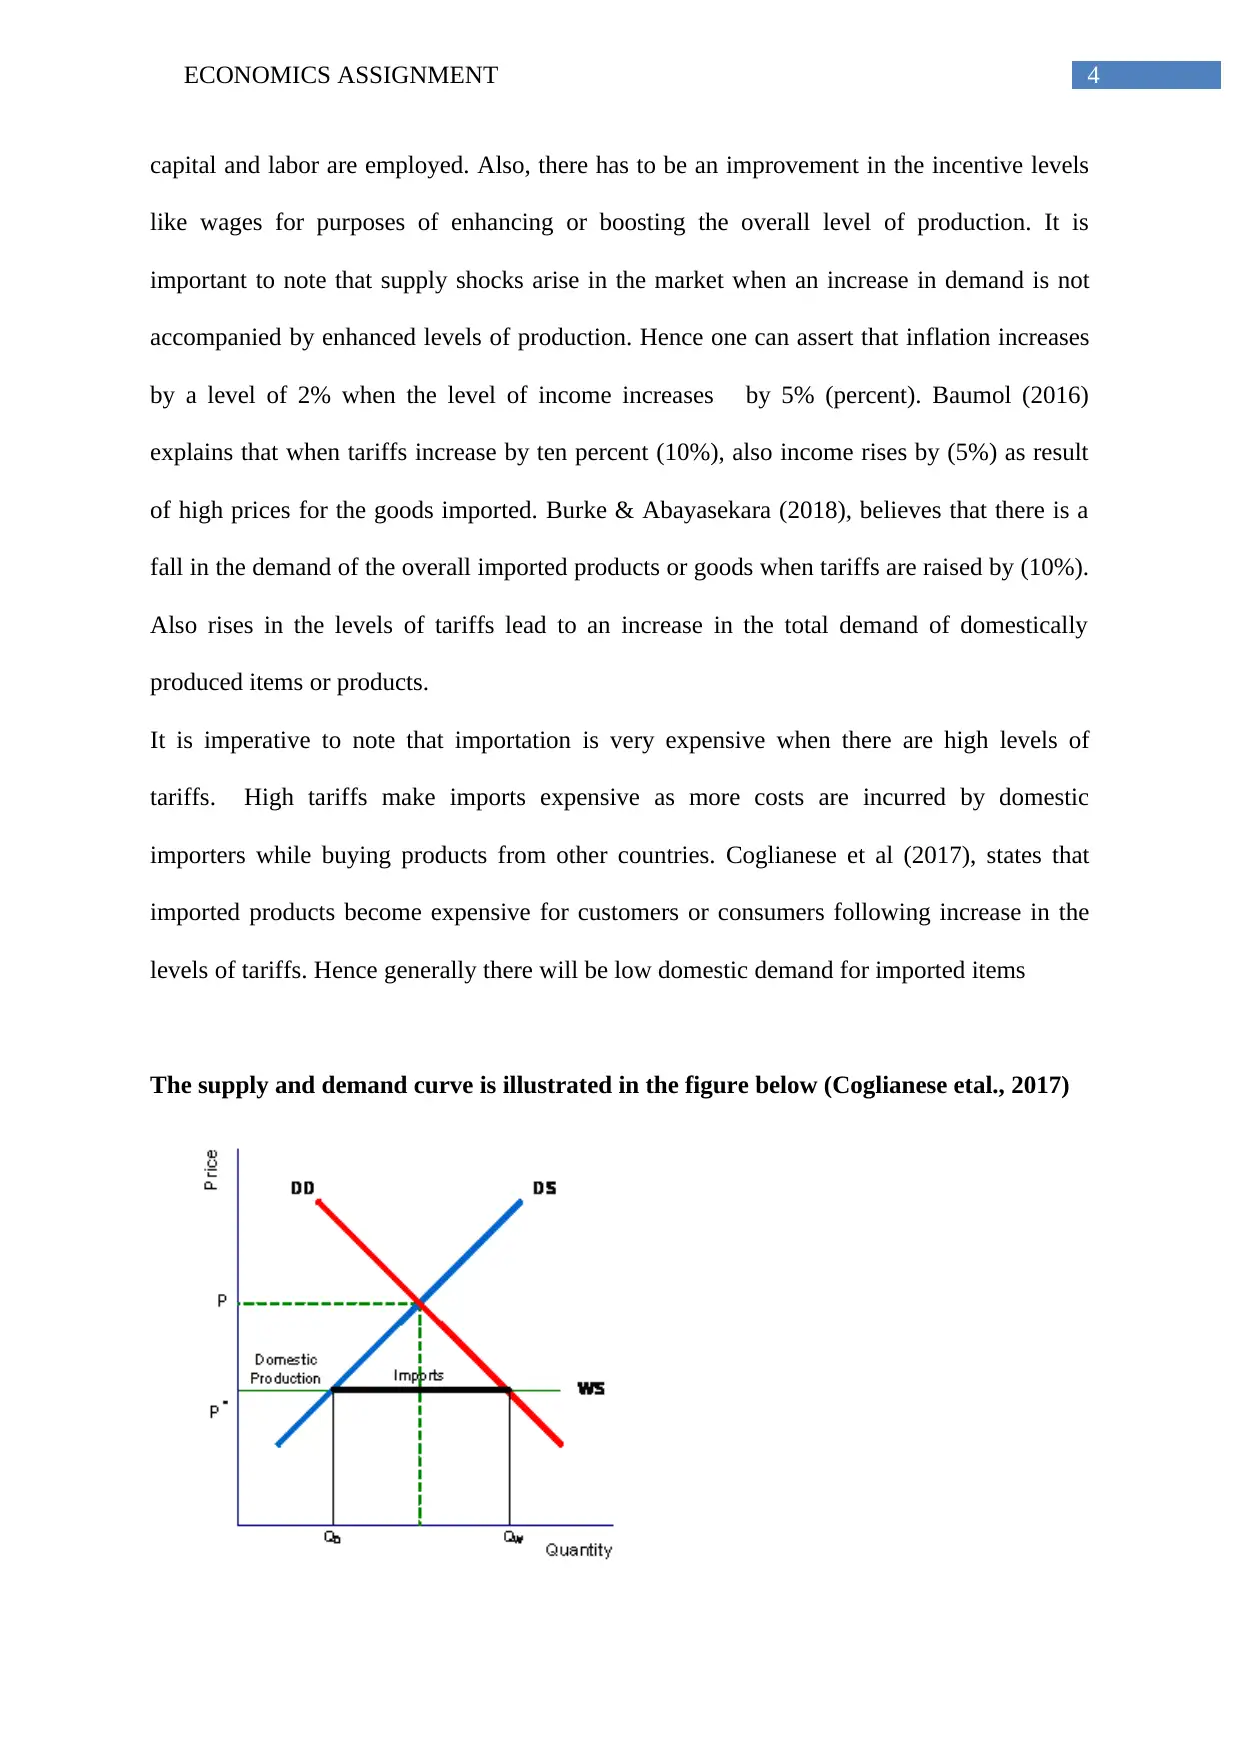
It is imperative to note that importation is very expensive when there are high levels of
tariffs. High tariffs make imports expensive as more costs are incurred by domestic
importers while buying products from other countries. Coglianese et al (2017), states that
imported products become expensive for customers or consumers following increase in the
levels of tariffs. Hence generally there will be low domestic demand for imported items
The supply and demand curve is illustrated in the figure below (Coglianese etal., 2017)
capital and labor are employed. Also, there has to be an improvement in the incentive levels
like wages for purposes of enhancing or boosting the overall level of production. It is
important to note that supply shocks arise in the market when an increase in demand is not
accompanied by enhanced levels of production. Hence one can assert that inflation increases
by a level of 2% when the level of income increases by 5% (percent). Baumol (2016)
explains that when tariffs increase by ten percent (10%), also income rises by (5%) as result
of high prices for the goods imported. Burke & Abayasekara (2018), believes that there is a
fall in the demand of the overall imported products or goods when tariffs are raised by (10%).
Also rises in the levels of tariffs lead to an increase in the total demand of domestically
produced items or products.
It is imperative to note that importation is very expensive when there are high levels of
tariffs. High tariffs make imports expensive as more costs are incurred by domestic
importers while buying products from other countries. Coglianese et al (2017), states that
imported products become expensive for customers or consumers following increase in the
levels of tariffs. Hence generally there will be low domestic demand for imported items
The supply and demand curve is illustrated in the figure below (Coglianese etal., 2017)
5ECONOMICS ASSIGNMENT
From the figure above it is clear, a ten percent (10%) increase or rise in rates of tariffs leads
lower levels of demand due to an increase in the price of imported goods
Agg dd/Aggss
There comprises of two forms of equilibrium and they include the long and short run
equilibrium. The short run situation is evident in situations where wages and prices and the
overall economic standing or situation cannot effectively match. When there variations or
changes in the current economic conditions, the equilibrium levels are difficult to be achieved
effectively. This is due to the fact that market stability cannot be maintained as there is a slow
price increase. Diaz (2012), states that in the long run, there is flexibility in both wages and
prices regardless of the current economic situation. The demand and supply shows the overall
aggregate supply and demand of the economy
Dimopoulos and Sacchetto (2017), states that the aggregate supply curve shifts or moves
right words, when there is a general increase in the levels of productivity. This leads to a
decline in the inflation level and high growth income levels (Jungherr et al., 2018).Therefore,
rises in the tariffs and inflation together with high prices in this case will make the aggregate
supply curve to move towards the left due to limited importation levels. Thus a five percent
increase income (5%) results from a ten percent (10%) increase in the level of tariffs. This
leads to economic recessions or stagnation as a result of inflation increase by two percent
(2%). Income increases will ultimately results into more sales and profits being enjoyed by
the company. Incomes increase forces firms to effectively enhance their overall capacities in
production. Thus the desire by the company to enhance or expands her production capacity
results into a 2% inflation rate after an increase of income by 5 percent and tariff by ten
percent (10%) (Hayn et al, 2018).
⊘ This is a preview!⊘
Do you want full access?
Subscribe today to unlock all pages.
Trusted by 1+ million students worldwide
6ECONOMICS ASSIGNMENT
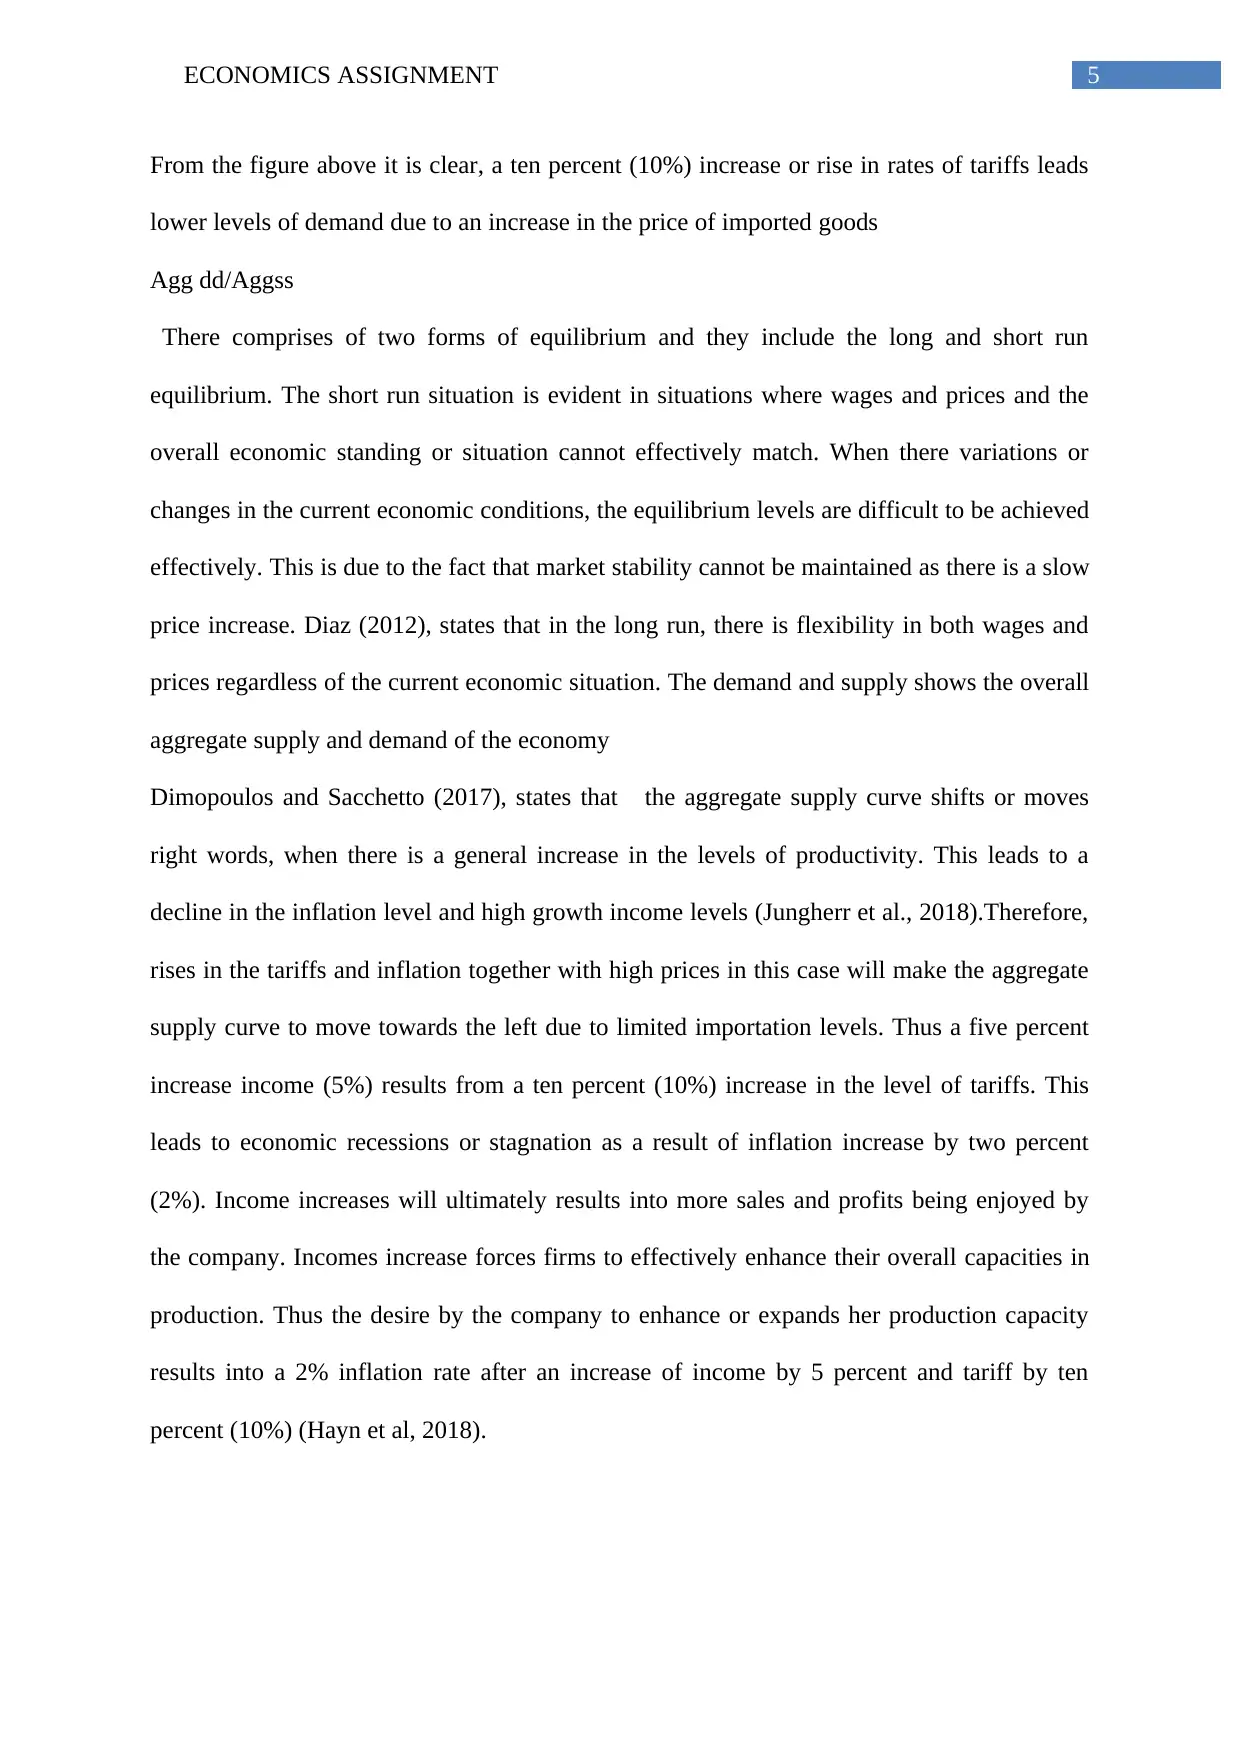
Domestic firms increase their overall production capacities following a 10% increase in the
tariff levels. Rising production capacity or levels by domestic firms is created by reduction in
the level of imports as a result of high tariffs. Demand pull inflation arises in the long run as a
result of a high tariff rate. Moreover, monopoly powers in the economy arises when there a
10 % increase level of tariffs (Labandeira et al., 2017). The overall aggregate demand of
services and goods increases when there an income increase by 5%. This makes the price
levels to increase by 2%
Figure 2 showing the aggregate supply and aggregate demand curve (Labandeira et al.,
2017).
In the figure below, there is an increase in the overall product prices as there the aggregate
demand of services and goods increase. Importation is discouraged or reduced, when there is
an increase in the level of tariffs making imports expensive for domestic producers. Also,
shortages in the economy arise due to high tariffs making the prices of services and goods
unaffordable.
Aggregate supply shocks
Stagflation in the economy arises from a 10% rise in the tariffs levels. It is important to note
that a ten percent rise in tariffs makes imported products expensive for domestic consumers
Paraphrase This Document
Need a fresh take? Get an instant paraphrase of this document with our AI Paraphraser
7ECONOMICS ASSIGNMENT
and importers hence limiting the level of competition in the economy. Disturbances in the
economy mostly on the supply side arise as a tariff increases which makes certain products
unavailable in the market. Labandeira et al (2017), states that there a rise in monopoly powers
as imported goods are driven out of the market due to high tariffs. Hence inflation arises due
to the scarcity of goods and services in the economy. The overall Growth domestic product
levels falls, as cost push inflation increases hence affecting the overall general economic
standing or performance
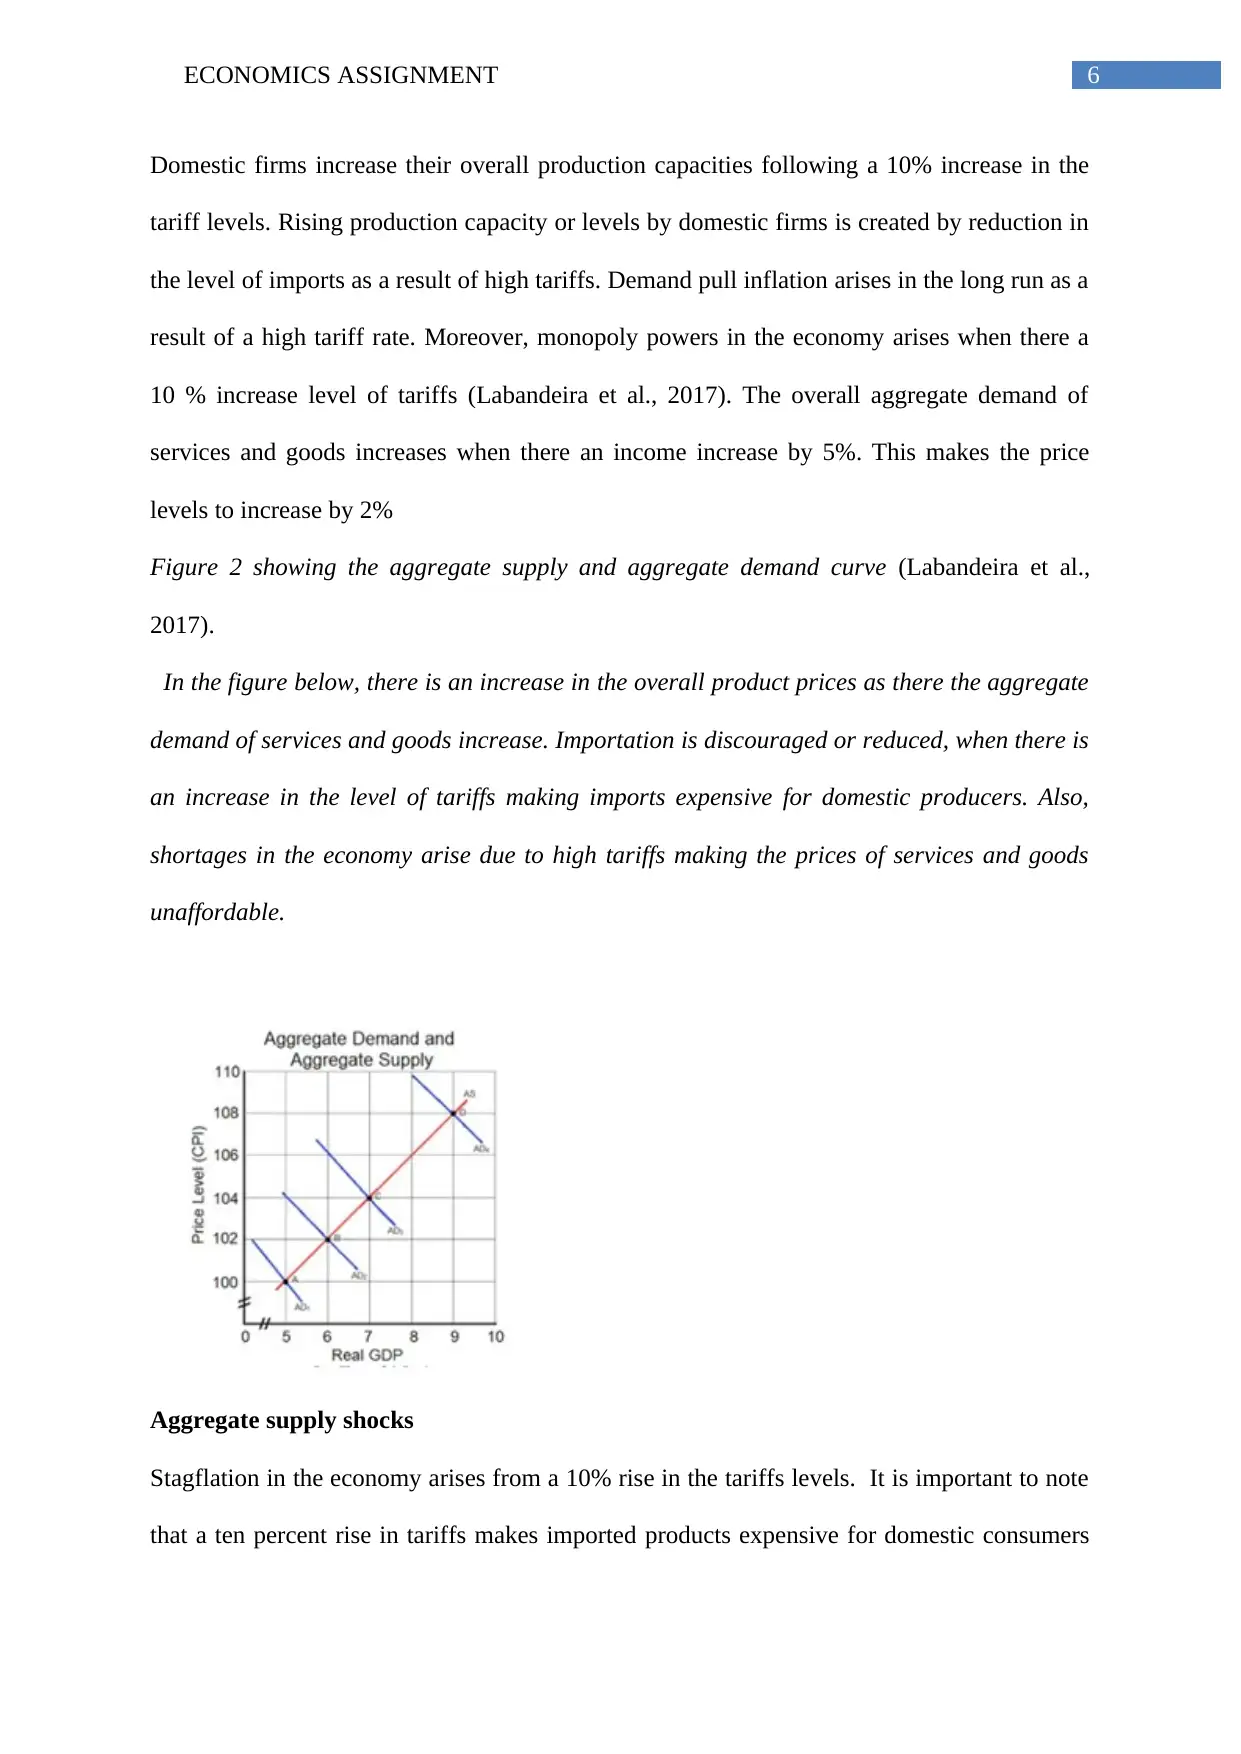
Figures 4 and 3 showing Supply shocks from a high tariff
Figure 3
Figure 4
and importers hence limiting the level of competition in the economy. Disturbances in the
economy mostly on the supply side arise as a tariff increases which makes certain products
unavailable in the market. Labandeira et al (2017), states that there a rise in monopoly powers
as imported goods are driven out of the market due to high tariffs. Hence inflation arises due
to the scarcity of goods and services in the economy. The overall Growth domestic product
levels falls, as cost push inflation increases hence affecting the overall general economic
standing or performance
Figures 4 and 3 showing Supply shocks from a high tariff
Figure 3
Figure 4
8ECONOMICS ASSIGNMENT
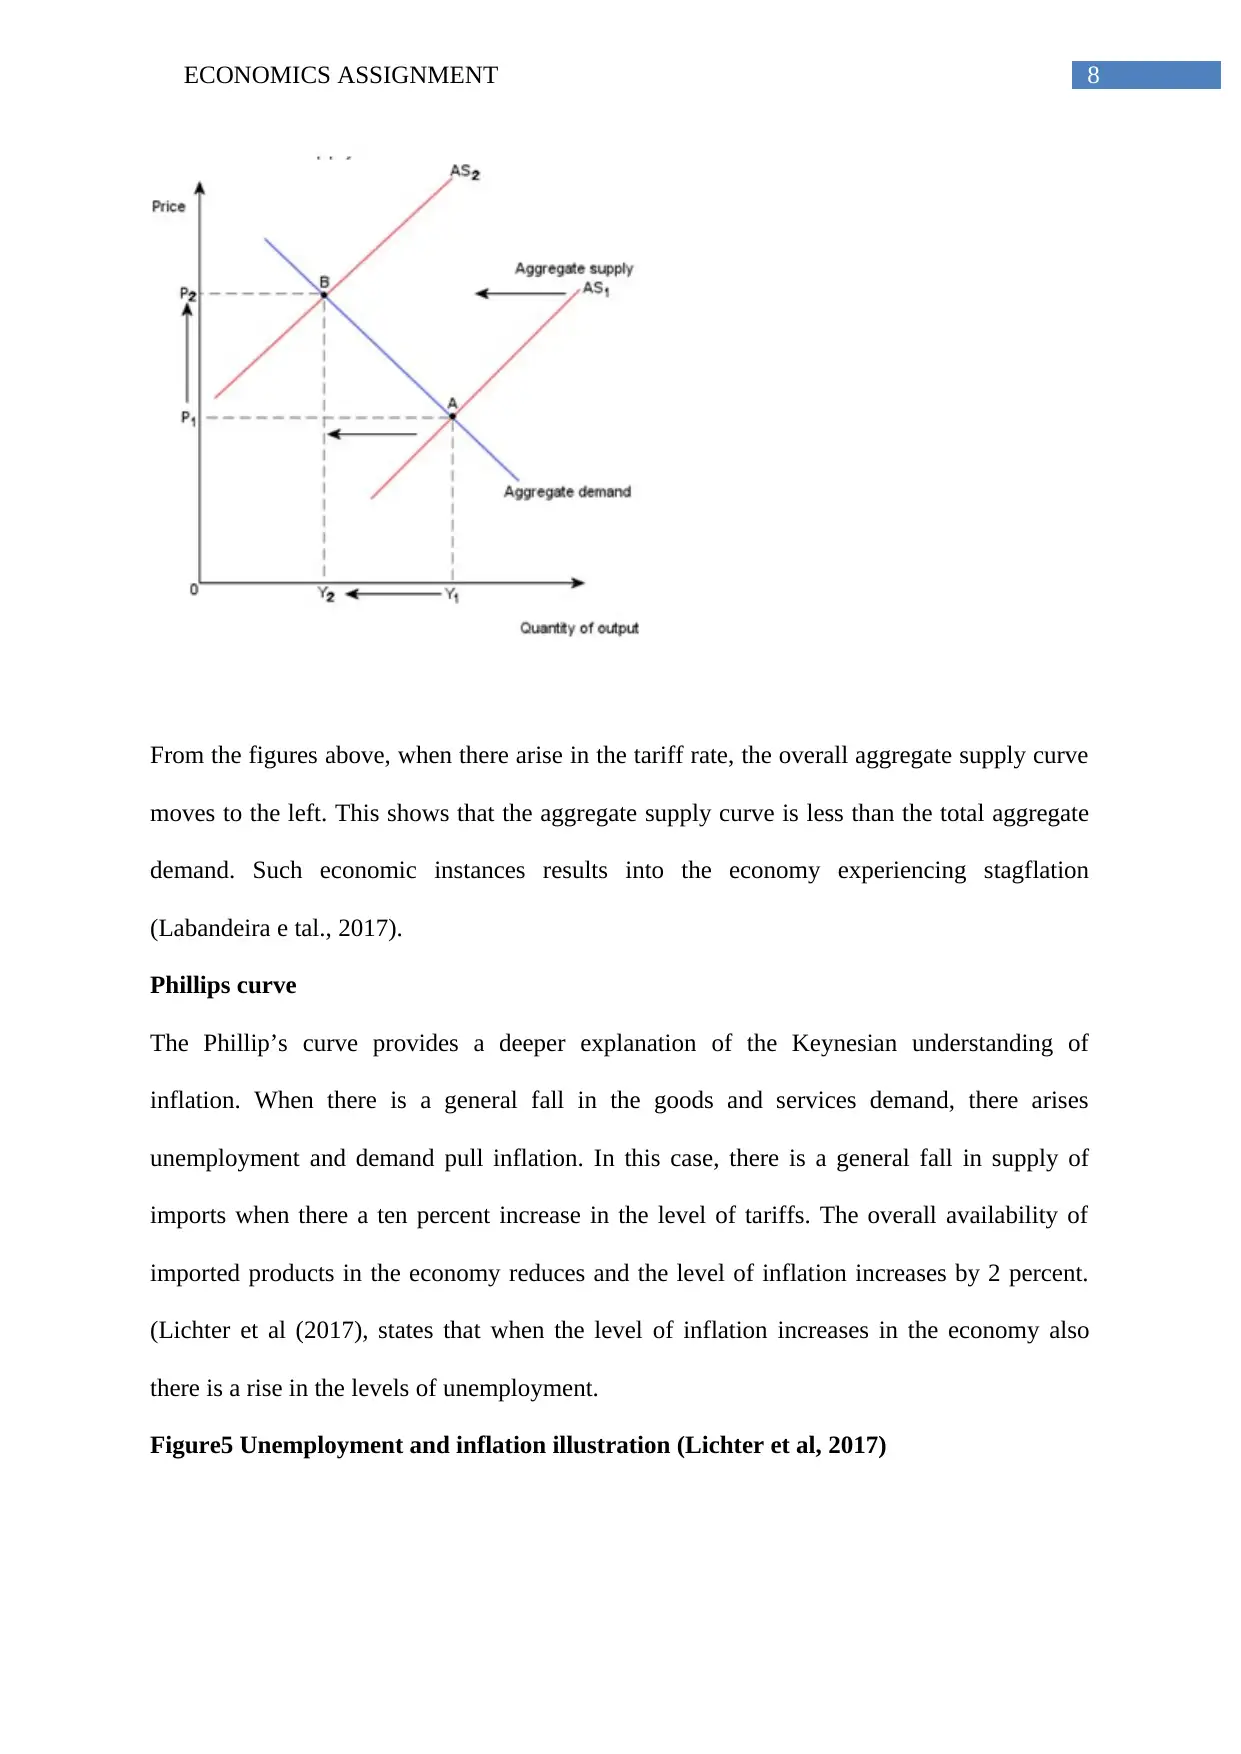
From the figures above, when there arise in the tariff rate, the overall aggregate supply curve
moves to the left. This shows that the aggregate supply curve is less than the total aggregate
demand. Such economic instances results into the economy experiencing stagflation
(Labandeira e tal., 2017).
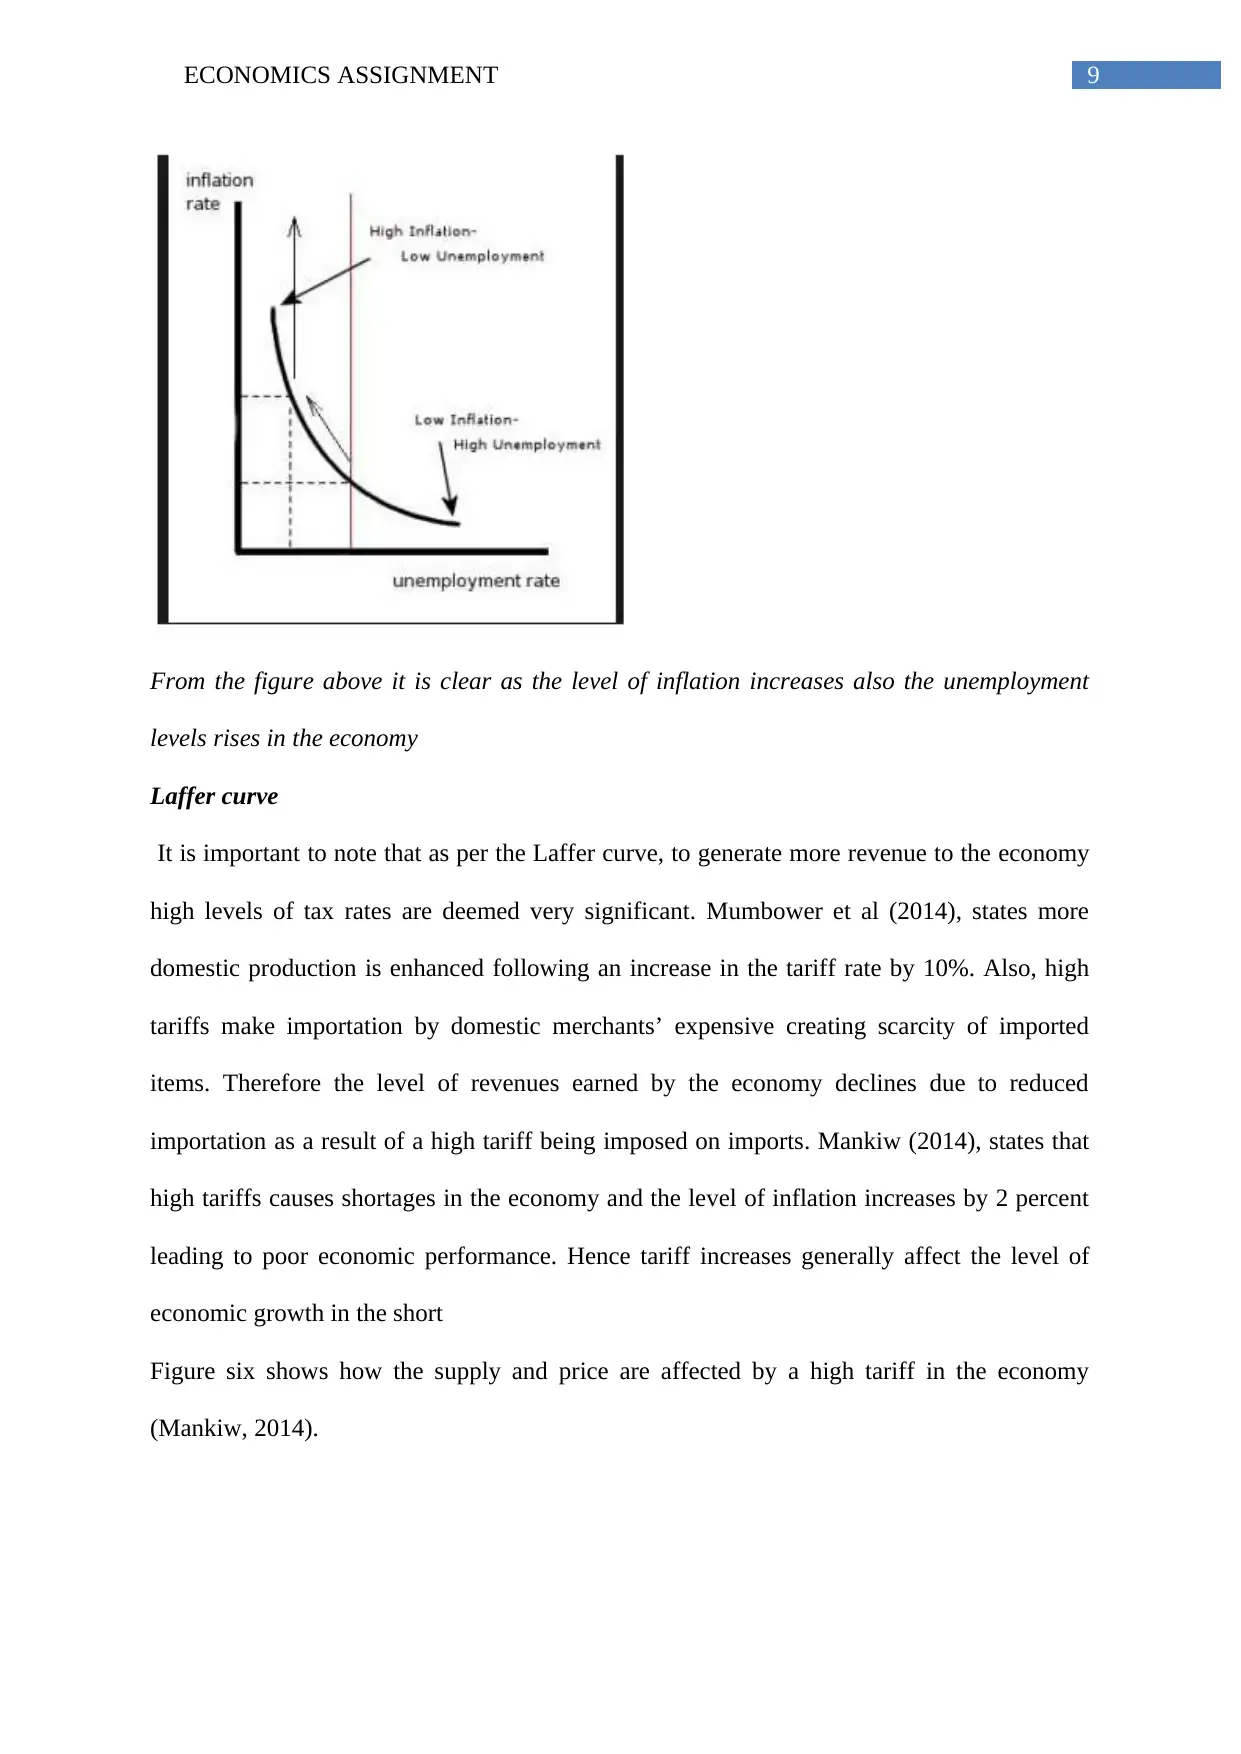
Phillips curve
The Phillip’s curve provides a deeper explanation of the Keynesian understanding of
inflation. When there is a general fall in the goods and services demand, there arises
unemployment and demand pull inflation. In this case, there is a general fall in supply of
imports when there a ten percent increase in the level of tariffs. The overall availability of
imported products in the economy reduces and the level of inflation increases by 2 percent.
(Lichter et al (2017), states that when the level of inflation increases in the economy also
there is a rise in the levels of unemployment.
Figure5 Unemployment and inflation illustration (Lichter et al, 2017)
From the figures above, when there arise in the tariff rate, the overall aggregate supply curve
moves to the left. This shows that the aggregate supply curve is less than the total aggregate
demand. Such economic instances results into the economy experiencing stagflation
(Labandeira e tal., 2017).
Phillips curve
The Phillip’s curve provides a deeper explanation of the Keynesian understanding of
inflation. When there is a general fall in the goods and services demand, there arises
unemployment and demand pull inflation. In this case, there is a general fall in supply of
imports when there a ten percent increase in the level of tariffs. The overall availability of
imported products in the economy reduces and the level of inflation increases by 2 percent.
(Lichter et al (2017), states that when the level of inflation increases in the economy also
there is a rise in the levels of unemployment.
Figure5 Unemployment and inflation illustration (Lichter et al, 2017)
⊘ This is a preview!⊘
Do you want full access?
Subscribe today to unlock all pages.
Trusted by 1+ million students worldwide
9ECONOMICS ASSIGNMENT
From the figure above it is clear as the level of inflation increases also the unemployment
levels rises in the economy
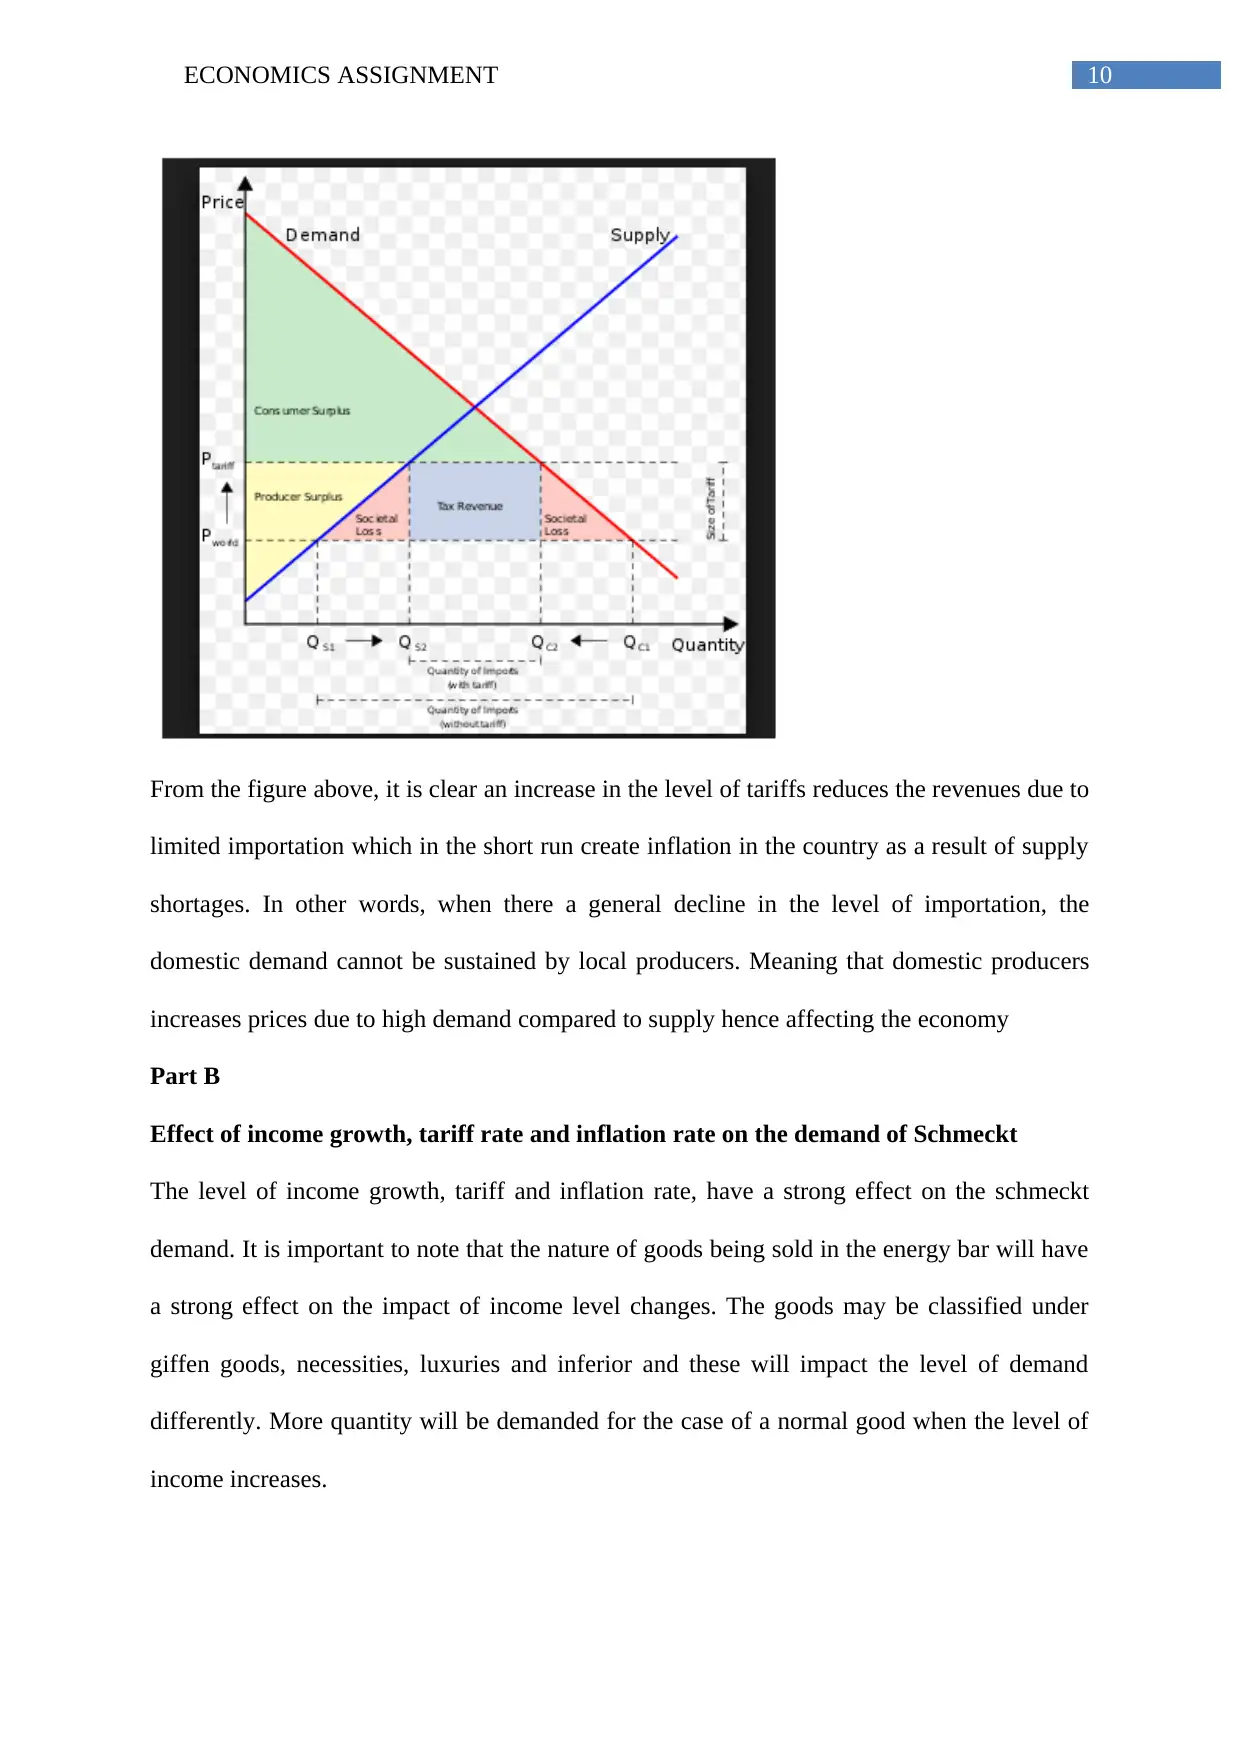
Laffer curve
It is important to note that as per the Laffer curve, to generate more revenue to the economy
high levels of tax rates are deemed very significant. Mumbower et al (2014), states more
domestic production is enhanced following an increase in the tariff rate by 10%. Also, high
tariffs make importation by domestic merchants’ expensive creating scarcity of imported
items. Therefore the level of revenues earned by the economy declines due to reduced
importation as a result of a high tariff being imposed on imports. Mankiw (2014), states that
high tariffs causes shortages in the economy and the level of inflation increases by 2 percent
leading to poor economic performance. Hence tariff increases generally affect the level of
economic growth in the short
Figure six shows how the supply and price are affected by a high tariff in the economy
(Mankiw, 2014).
From the figure above it is clear as the level of inflation increases also the unemployment
levels rises in the economy
Laffer curve
It is important to note that as per the Laffer curve, to generate more revenue to the economy
high levels of tax rates are deemed very significant. Mumbower et al (2014), states more
domestic production is enhanced following an increase in the tariff rate by 10%. Also, high
tariffs make importation by domestic merchants’ expensive creating scarcity of imported
items. Therefore the level of revenues earned by the economy declines due to reduced
importation as a result of a high tariff being imposed on imports. Mankiw (2014), states that
high tariffs causes shortages in the economy and the level of inflation increases by 2 percent
leading to poor economic performance. Hence tariff increases generally affect the level of
economic growth in the short
Figure six shows how the supply and price are affected by a high tariff in the economy
(Mankiw, 2014).
Paraphrase This Document
Need a fresh take? Get an instant paraphrase of this document with our AI Paraphraser
10ECONOMICS ASSIGNMENT
From the figure above, it is clear an increase in the level of tariffs reduces the revenues due to
limited importation which in the short run create inflation in the country as a result of supply
shortages. In other words, when there a general decline in the level of importation, the
domestic demand cannot be sustained by local producers. Meaning that domestic producers
increases prices due to high demand compared to supply hence affecting the economy
Part B
Effect of income growth, tariff rate and inflation rate on the demand of Schmeckt
The level of income growth, tariff and inflation rate, have a strong effect on the schmeckt
demand. It is important to note that the nature of goods being sold in the energy bar will have
a strong effect on the impact of income level changes. The goods may be classified under
giffen goods, necessities, luxuries and inferior and these will impact the level of demand
differently. More quantity will be demanded for the case of a normal good when the level of
income increases.
11ECONOMICS ASSIGNMENT
Meaning that the nature of the product will be key in determining the overall level of product
demand. Also, the demand of energy products may not necessary increase with an increase of
income for the case of inferior goods. In other words an inferior good is demanded high when
income is less and little when an income is high. Superior products may be demanded more
when income increases. Thus it can’t be concluded that an increase in income with ultimately
result into more energy bar products being demanded in the area of Atollia. Additionally, for
a normal good, no strong impact will be felt on the demand for the company’s product when
the level of income increases (McConnell, 2009).
Zhao e t al (2018) asserts that the overall tariff impact varies depending on if the tariff is low
or high. In this case, a low tariff level will mean that schemeckt gut products will be sold at
low prices due to open competition from outside products or items. Tariffs main aim is to
promote local or domestic industries through discouraging importation from outside
economies. It is clear that tariffs will have a strong impact on the demand of schemeckt gut
products. Also, the overall level of profit margins of the company may reduce when low
tariffs are charged. Low tariffs will affect the overall sustainability levels of the company
given that it will be a new venture trying to establish its self in a market place.
It is important to note that the imposition of high tariffs will limit the level of importation of
products making the energy bars competitive in the market. The company will increase her
level of revenues, sales and market share as the level of imports reduces.
Similarly, the demand of the bar services and products will be affected by high inflation
levels. In most cases inflation arises from the supply shocks or disturbances as per the
analysis of the Great economist JB Keynes. In this case, demand pull inflation will emanate
from high levels of tariffs resulting into relatively lower levels of production. It is imperative
to note that as the prices of services and goods increases, the overall company product prices
will raise. Hence to cut the overall production costs, unemployment may arise (Free, 2010).
⊘ This is a preview!⊘
Do you want full access?
Subscribe today to unlock all pages.
Trusted by 1+ million students worldwide
1 out of 20
Related Documents


Your All-in-One AI-Powered Toolkit for Academic Success.
+13062052269
info@desklib.com
Available 24*7 on WhatsApp / Email
![[object Object]](/_next/static/media/star-bottom.7253800d.svg)
Unlock your academic potential
Copyright © 2020–2026 A2Z Services. All Rights Reserved. Developed and managed by ZUCOL.