Macroeconomics Assignment B: Demand-Pull, Cost-Push Inflation Analysis
VerifiedAdded on 2023/03/20
|16
|3283
|85
Homework Assignment
AI Summary
This macroeconomics assignment analyzes inflation, differentiating between demand-pull and cost-push inflation with diagrams and explanations of their causes. It examines the effects of various economic factors, such as improved marketing skills, changes in personal income tax, increased exports, and destruction of capital stock, using graphical representations to illustrate their impact on aggregate demand and supply. The assignment also discusses the advantages and disadvantages of using the Consumer Price Index (CPI) to measure inflation and explores the winners and losers in an inflationary environment, considering the time value of money and the impact on borrowers, lenders, and fixed-income earners. The student provides a comprehensive overview of macroeconomic principles related to inflation and its economic consequences.
Running head: ASSIGNMENT B 1
MACROECONOMICS ASSIGNMENT B
Student Name
Institutional Affiliation
Facilitator
Course
Date
MACROECONOMICS ASSIGNMENT B
Student Name
Institutional Affiliation
Facilitator
Course
Date
Paraphrase This Document
Need a fresh take? Get an instant paraphrase of this document with our AI Paraphraser
ASSIGNMENT B 2
Question3
(10 marks total - 2.5 marks each part)
a. Illustrate and explain with diagrams the difference between demand-pull and cost-push
inflation; (2.5 marks for the diagram and 2.5 marks for the explanation)
Demand-pull Inflation
In an economy, when the market total supply (aggregate supply) is outpaced by the
market total demand (aggregate demand), demand-pull inflation occurs (Dmitrieva & Ushakov,
2011). This means that the economy actually experiences too much money which chases after
only a few available goods and services in the economy which can meet the needs of consumers
satisfactorily. The occurrence of this inflation type is coupled with economic growth whereby the
real gross domestic product increases whilst on the other hand the unemployment level
decreases. Demand-pull inflation usually tends to occur when the economy attains the full
employment level whereby consumers have enough income which leads to an increase in their
consumption rate which increases the overall demand in the economy. Producers increase their
production volume in order to meet the economy’s increasing demand. In this process, they hire
more workers to produce more quantity hence decreasing the unemployment rate. The rate at
which production increases eventually declines as compared to the rate at which demand
increases as optimum production level is reached which means further production leads to lesser
profits and this leads to a price increase as indicated in the below graph.
ASSIGNMENT B 3
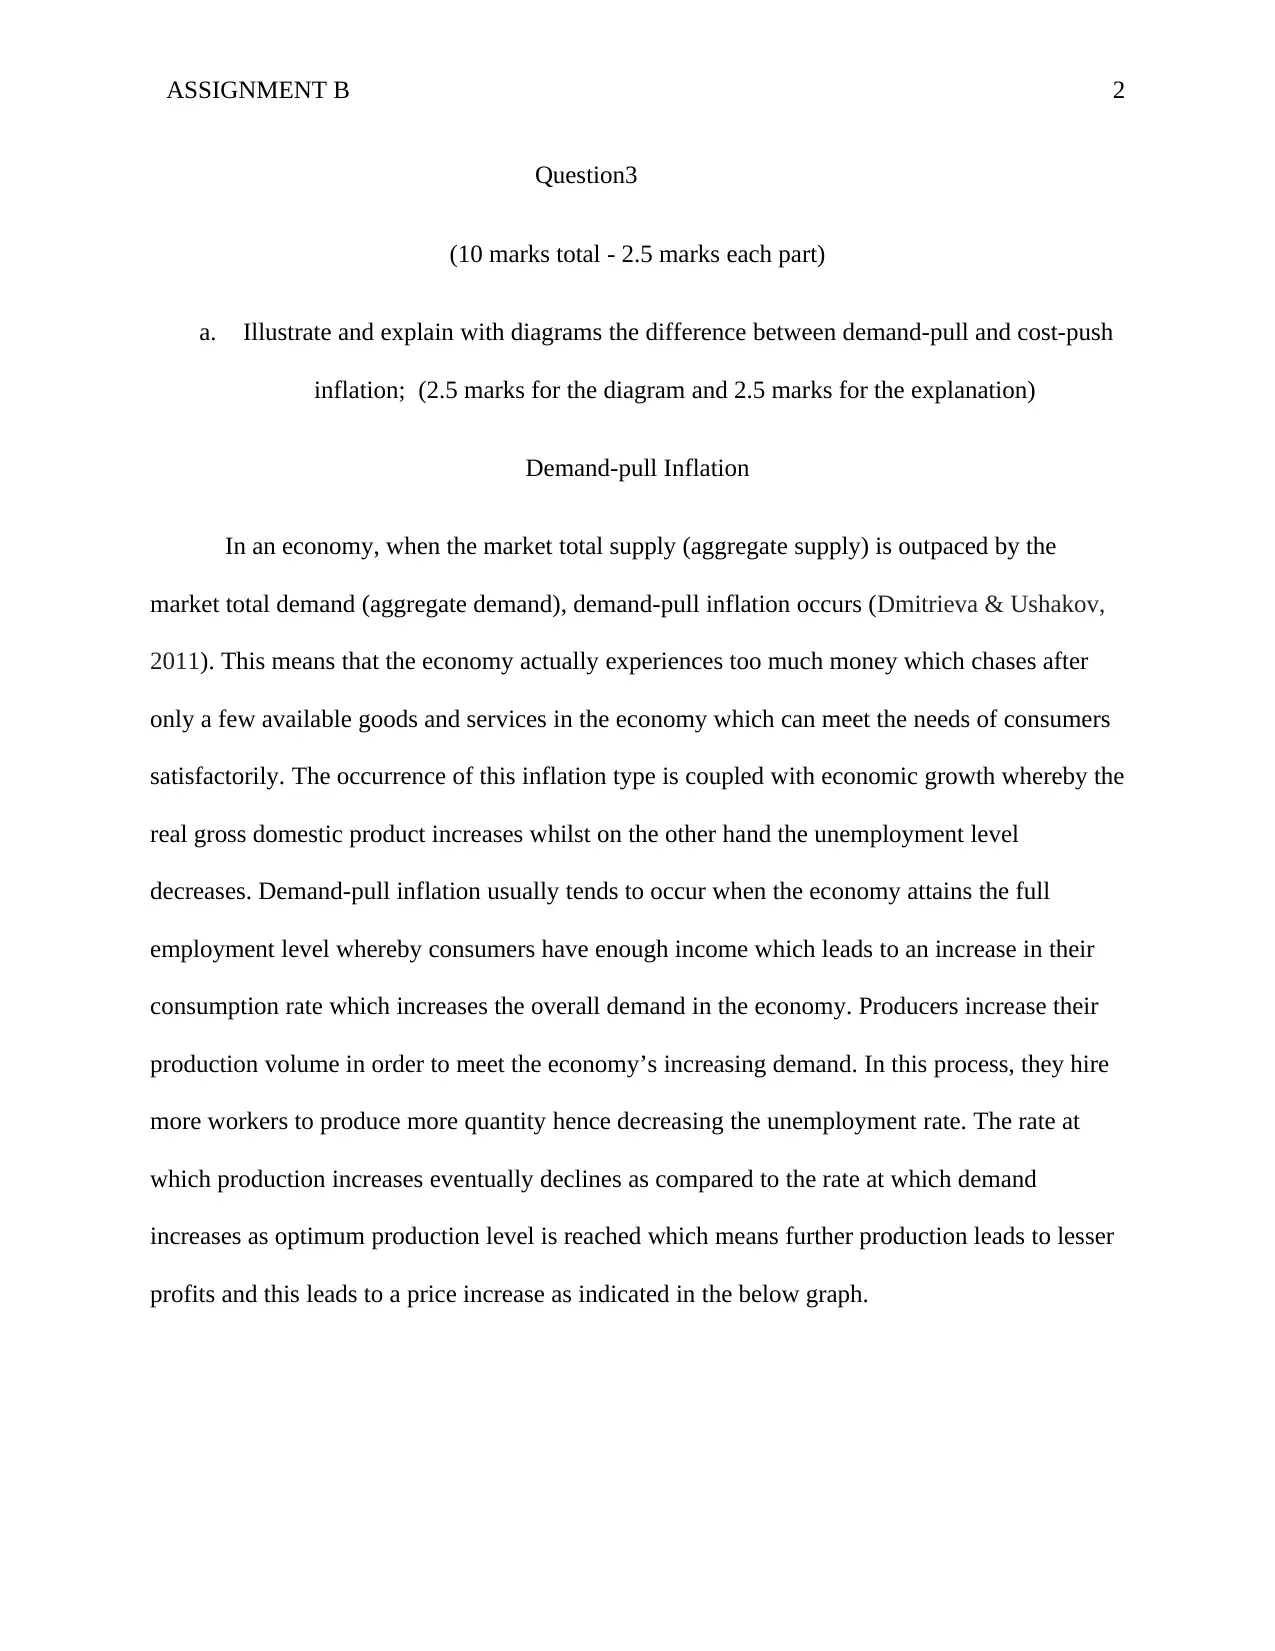
From the graph, the increase in aggregate demand shifts the aggregate demand curve
towards the right direction from point AD to AD’. This leads to an increase in the economy’s
total output measured by the real gross domestic product from point Y1 to Y2. As a result, the
prevailing market prices rise from P1 to P2 and this causes demand-pull inflation.
Cost-push Inflation
Cost-push inflation occurs in an economy when the market total supply (aggregate
supply) decreases (Godin & Lane, 2013). This results as firms undergo an increase in their costs
of production. Production costs occur due to various reasons such as the rise in factor inputs’
costs and government regulations such as the increase in taxes such as excise duties and VAT.
An increase in costs of production decreases the firms’ profitability. This means that firms
experience lesser profits at their current level of production and hence cut their production rate to
⊘ This is a preview!⊘
Do you want full access?
Subscribe today to unlock all pages.
Trusted by 1+ million students worldwide
ASSIGNMENT B 4
avoid a further decrease in profits due to increased productivity. As a result, the overall supply in
the economy decreases causing cost-push inflation. Cost-push inflation is controversial to
demand-pull inflation in that it is coupled by a decline in a nation’s economic growth as the
nation’s total output which is indicated by the real gross domestic product level decreases. Also,
unemployment increases since workers are laid off as production level is decreased and only a
few employees would be required to produce the lesser output. This is explained well by the use
of the graph below.
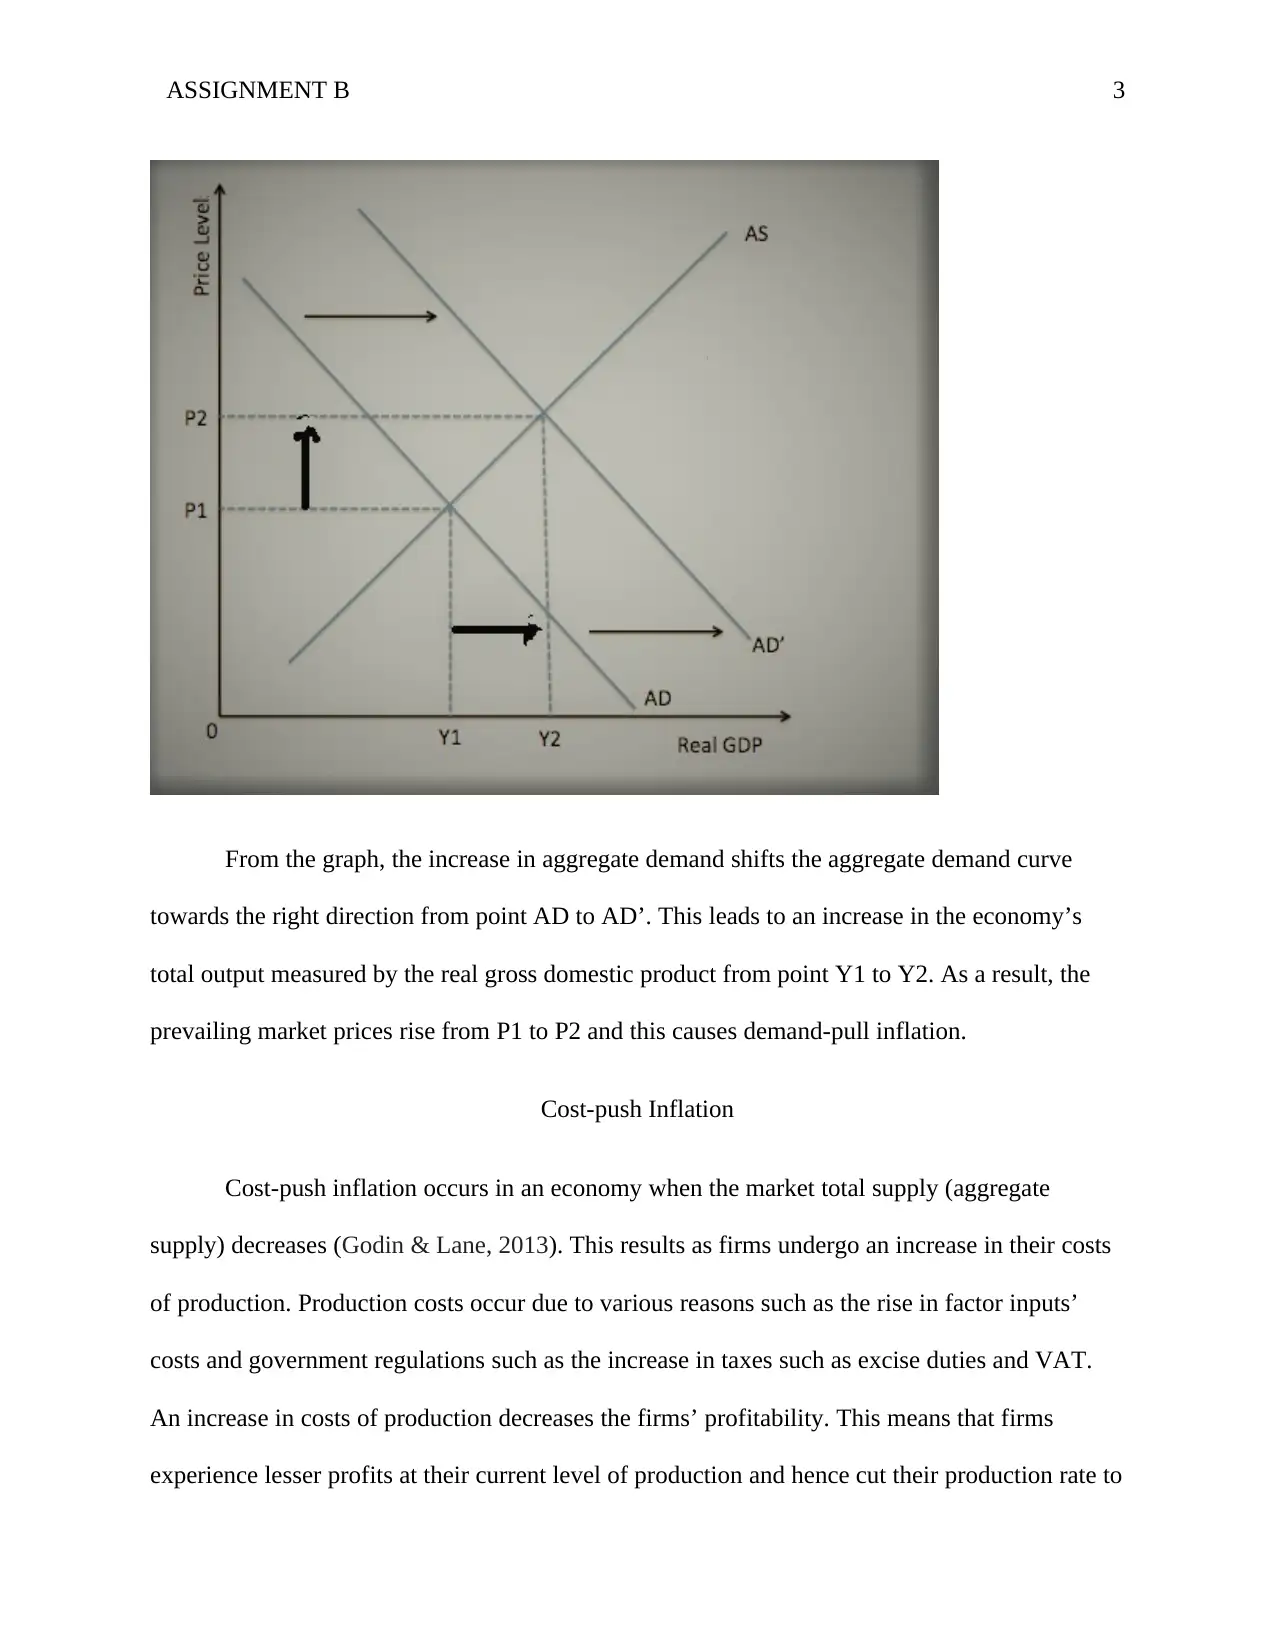
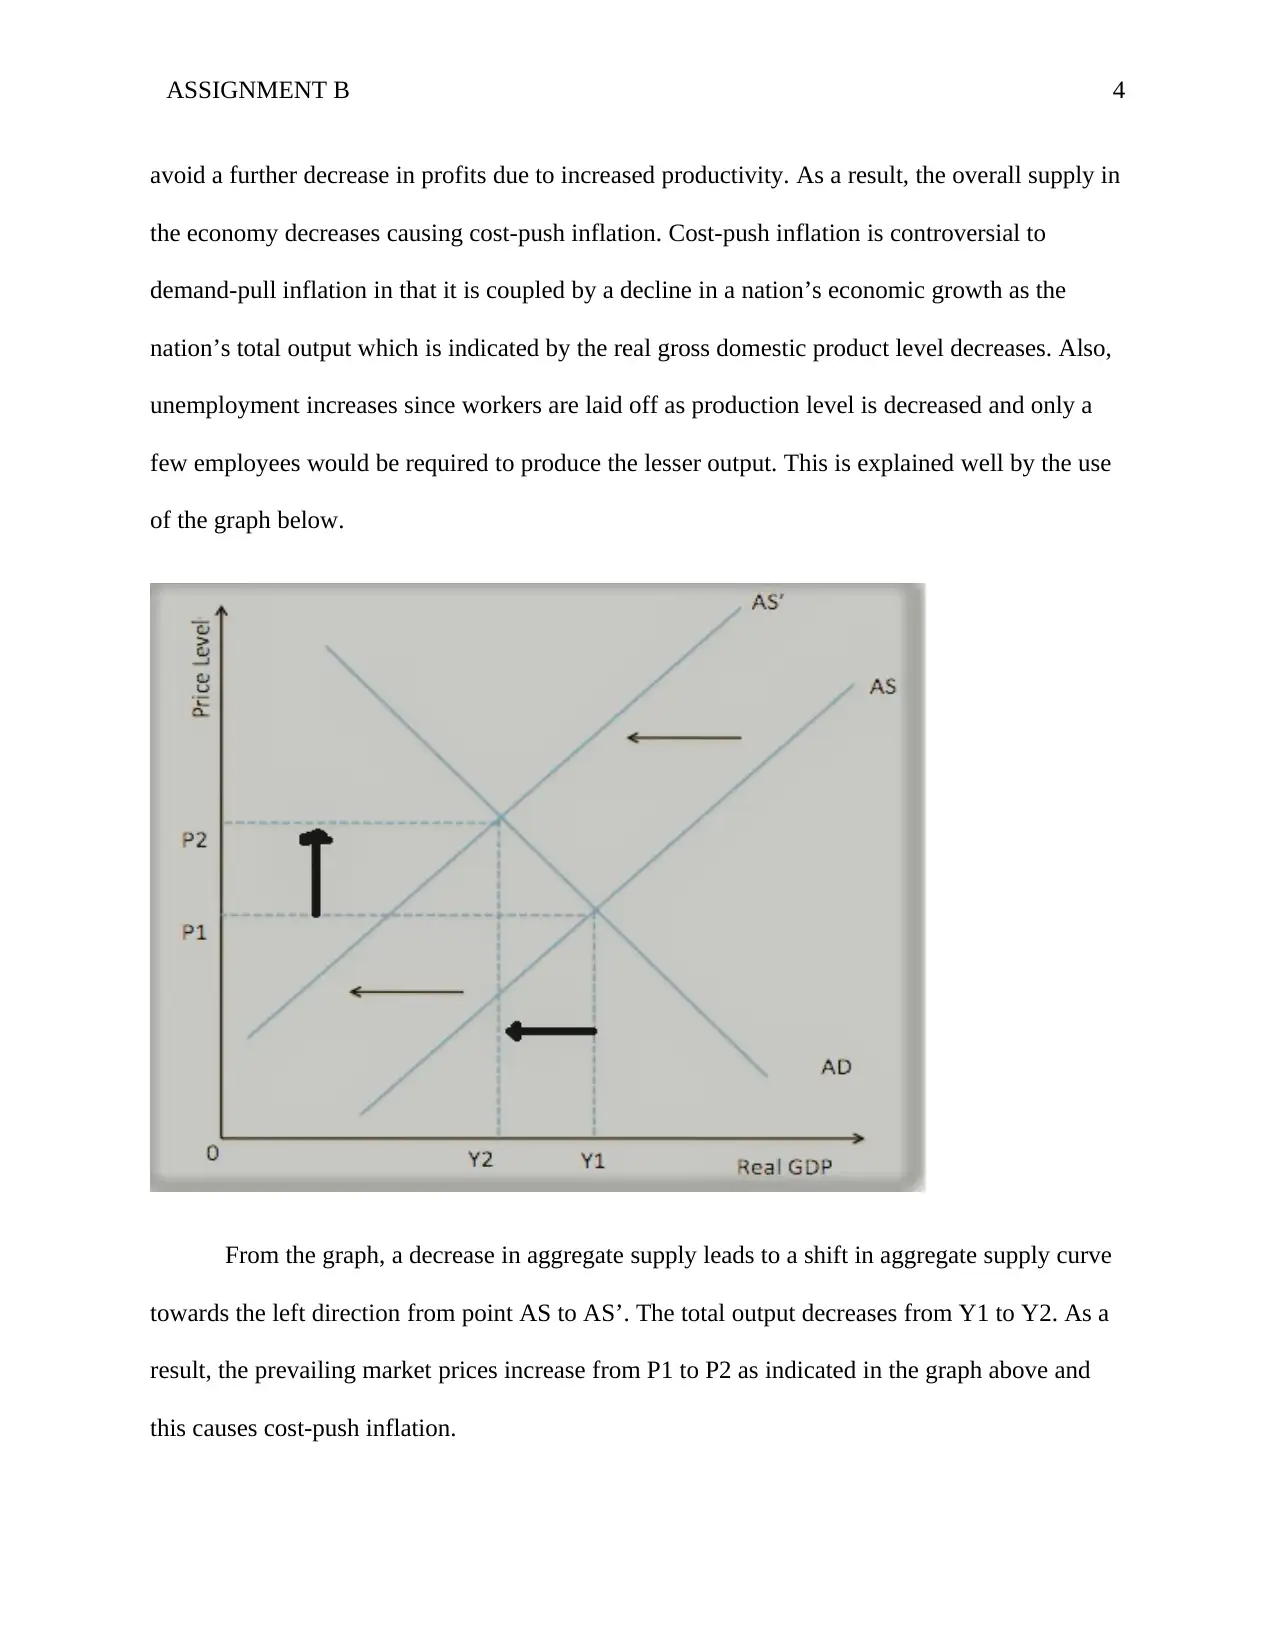
From the graph, a decrease in aggregate supply leads to a shift in aggregate supply curve
towards the left direction from point AS to AS’. The total output decreases from Y1 to Y2. As a
result, the prevailing market prices increase from P1 to P2 as indicated in the graph above and
this causes cost-push inflation.
avoid a further decrease in profits due to increased productivity. As a result, the overall supply in
the economy decreases causing cost-push inflation. Cost-push inflation is controversial to
demand-pull inflation in that it is coupled by a decline in a nation’s economic growth as the
nation’s total output which is indicated by the real gross domestic product level decreases. Also,
unemployment increases since workers are laid off as production level is decreased and only a
few employees would be required to produce the lesser output. This is explained well by the use
of the graph below.
From the graph, a decrease in aggregate supply leads to a shift in aggregate supply curve
towards the left direction from point AS to AS’. The total output decreases from Y1 to Y2. As a
result, the prevailing market prices increase from P1 to P2 as indicated in the graph above and
this causes cost-push inflation.
Paraphrase This Document
Need a fresh take? Get an instant paraphrase of this document with our AI Paraphraser
ASSIGNMENT B 5
b. Provide (describe) two (2) causes of each type of inflation (2.5 marks for 2 demand-pull
causes and 2.5 marks for 2 cost-push causes)
Causes of Demand-pull Inflation
Economic growth causes demand-pull inflation. When a nation’s economy is performing
well or rather thriving, consumers and business gain confidence in their expenditure. Consumers
expect to remain in employment and even earn higher wages in the future. They, therefore, tend
to save less and borrow much for expenditure. As a result aggregate demand increases at a pace
which suppliers cannot counter and hence demand-pull inflation occurs.
Future forecast of an occurrence of inflation causes demand-pull inflation. When inflation
is anticipated in the future, consumers purchase more commodities to avoid higher prices in the
future which may result due to inflation occurrence. This increases the aggregate demand in the
economy more than the aggregate supply and hence causes demand-pull inflation.
Causes of cost-push Inflation
Cost-push inflation results from an increase in firms’ profit margin. Firms may set higher
profit targets especially when they have significant power in the economy which may allow them
to be the price makers. For higher profit set target to be reached, consumers have to suffer from
higher prices which are set by firms for final commodities. This price increase with the aim of
attaining the set higher profits causes cost-push inflation as it is classified under increased
production costs incurred by firms.
When the cost of factor inputs increases, this causes cost-push inflation. An increase in
cost for factors of production such as an increase in wages for the labor force and a general
ASSIGNMENT B 6
increase in price for raw materials increases the firms’ costs of production. This makes firms’
profitability to decrease at their current production volume and hence may cut it to avoid further
decrease. This reduces aggregate supply in the economy causing cost-push inflation. Also, the
higher costs of production are passed on to final consumers in the form of higher prices for
commodities. This increment in prices causes cost-push inflation.
Question5
(2.5 marks each part)
a. An improvement in the marketing and selling skills of firm managers
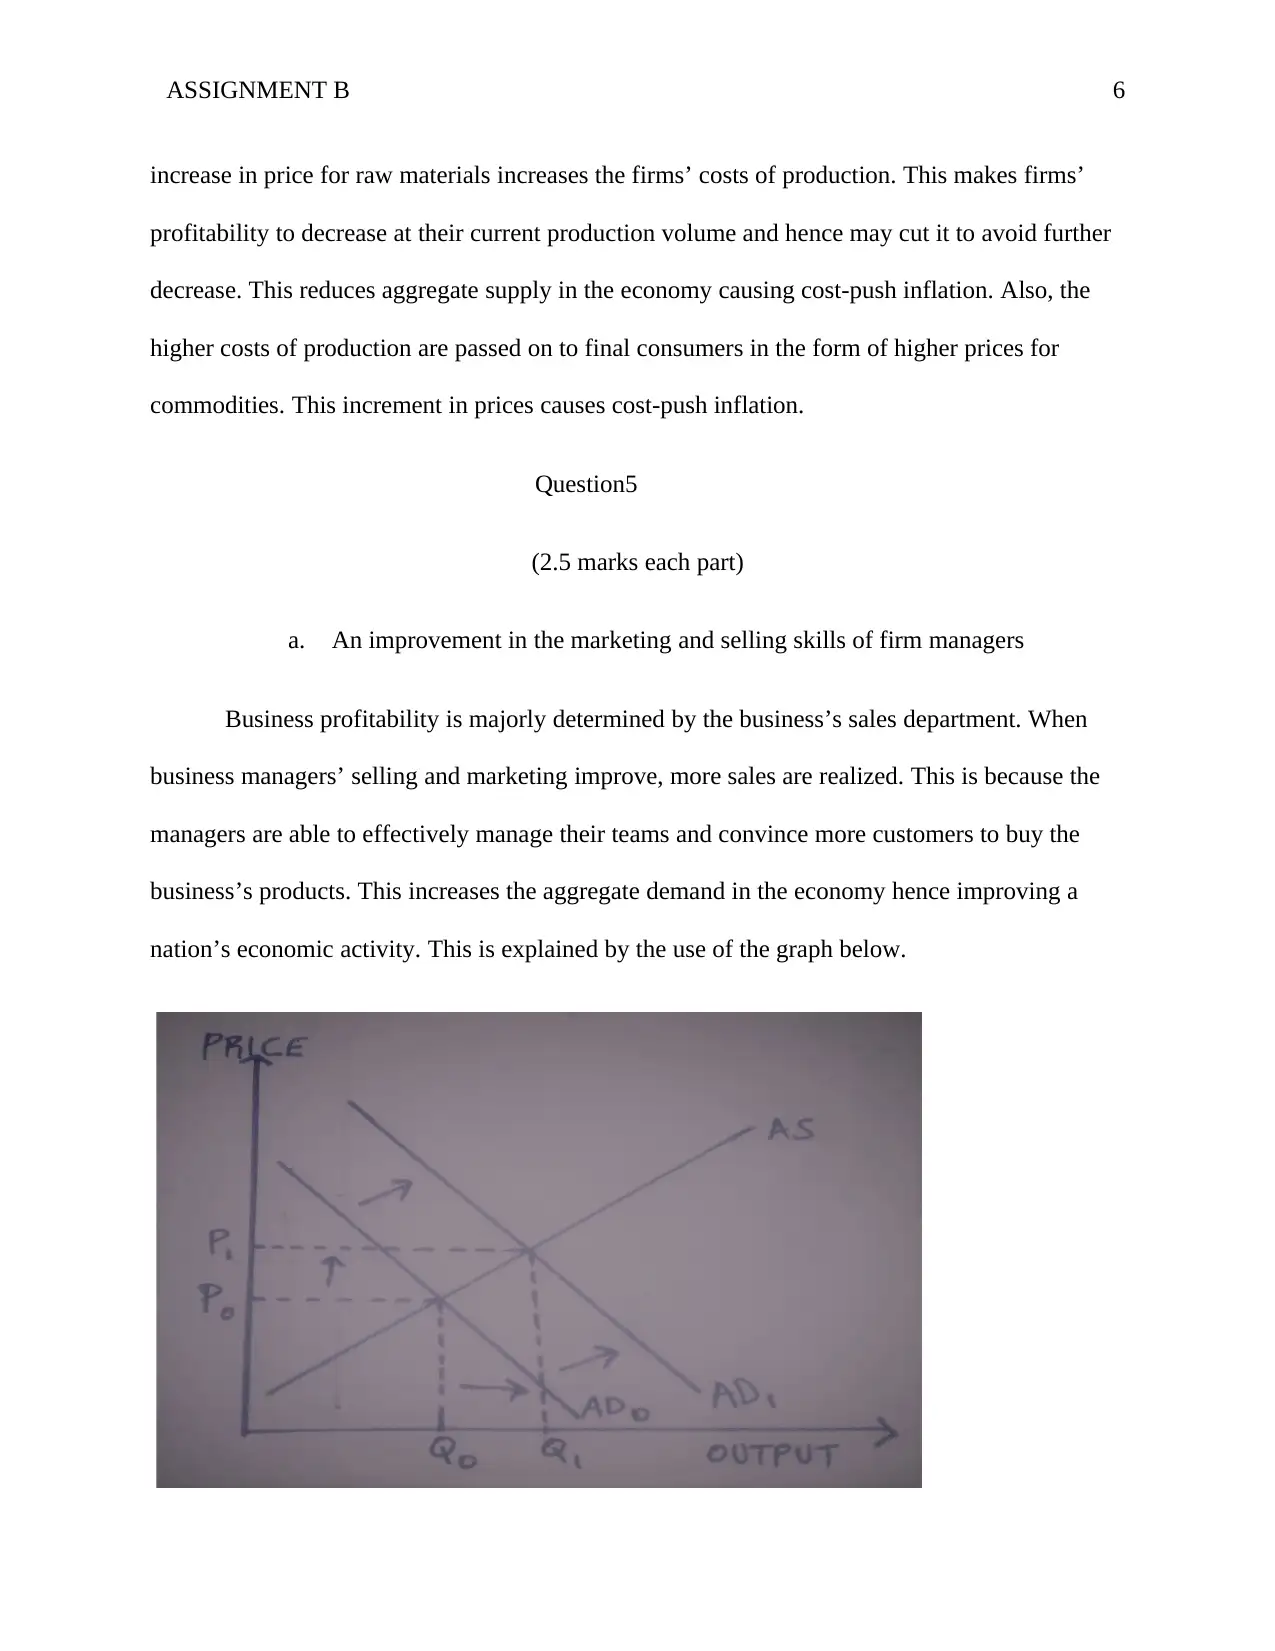
Business profitability is majorly determined by the business’s sales department. When
business managers’ selling and marketing improve, more sales are realized. This is because the
managers are able to effectively manage their teams and convince more customers to buy the
business’s products. This increases the aggregate demand in the economy hence improving a
nation’s economic activity. This is explained by the use of the graph below.
increase in price for raw materials increases the firms’ costs of production. This makes firms’
profitability to decrease at their current production volume and hence may cut it to avoid further
decrease. This reduces aggregate supply in the economy causing cost-push inflation. Also, the
higher costs of production are passed on to final consumers in the form of higher prices for
commodities. This increment in prices causes cost-push inflation.
Question5
(2.5 marks each part)
a. An improvement in the marketing and selling skills of firm managers
Business profitability is majorly determined by the business’s sales department. When
business managers’ selling and marketing improve, more sales are realized. This is because the
managers are able to effectively manage their teams and convince more customers to buy the
business’s products. This increases the aggregate demand in the economy hence improving a
nation’s economic activity. This is explained by the use of the graph below.
⊘ This is a preview!⊘
Do you want full access?
Subscribe today to unlock all pages.
Trusted by 1+ million students worldwide
ASSIGNMENT B 7
From the graph, the increase in aggregate demand shifts the economy’s aggregate
demand curve in the right direction from AD0 to AD1. The nation’s economic activity improves
as the total output increases from Q0 to Q1. As a result, the prevailing market prices in the
economy increase from P0 to P1 as shown above.
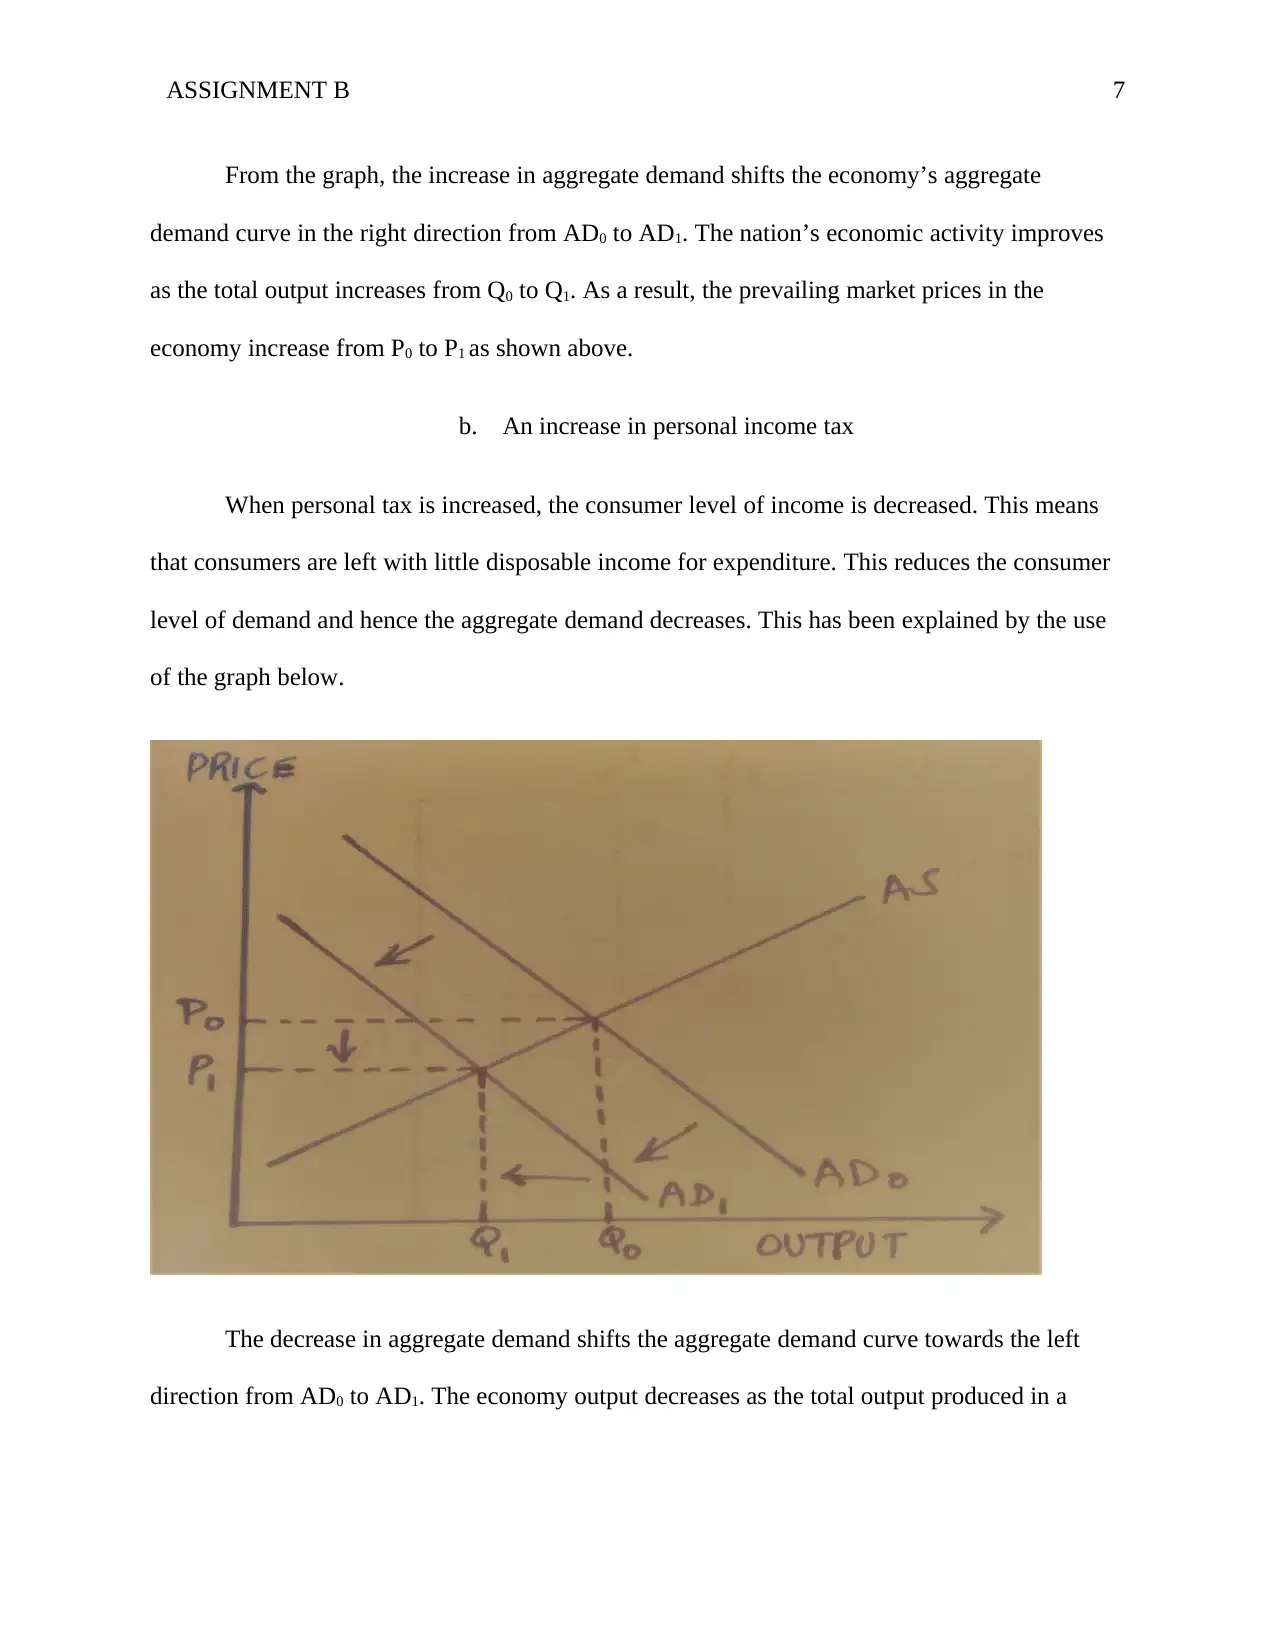
b. An increase in personal income tax
When personal tax is increased, the consumer level of income is decreased. This means
that consumers are left with little disposable income for expenditure. This reduces the consumer
level of demand and hence the aggregate demand decreases. This has been explained by the use
of the graph below.
The decrease in aggregate demand shifts the aggregate demand curve towards the left
direction from AD0 to AD1. The economy output decreases as the total output produced in a
From the graph, the increase in aggregate demand shifts the economy’s aggregate
demand curve in the right direction from AD0 to AD1. The nation’s economic activity improves
as the total output increases from Q0 to Q1. As a result, the prevailing market prices in the
economy increase from P0 to P1 as shown above.
b. An increase in personal income tax
When personal tax is increased, the consumer level of income is decreased. This means
that consumers are left with little disposable income for expenditure. This reduces the consumer
level of demand and hence the aggregate demand decreases. This has been explained by the use
of the graph below.
The decrease in aggregate demand shifts the aggregate demand curve towards the left
direction from AD0 to AD1. The economy output decreases as the total output produced in a
Paraphrase This Document
Need a fresh take? Get an instant paraphrase of this document with our AI Paraphraser
ASSIGNMENT B 8
nation decrease from Q0 to Q1 and hence the nation’s economic activity declines. On the other
hand, the market prices in the economy decrease from P0 to P1 as illustrated in the above graph.
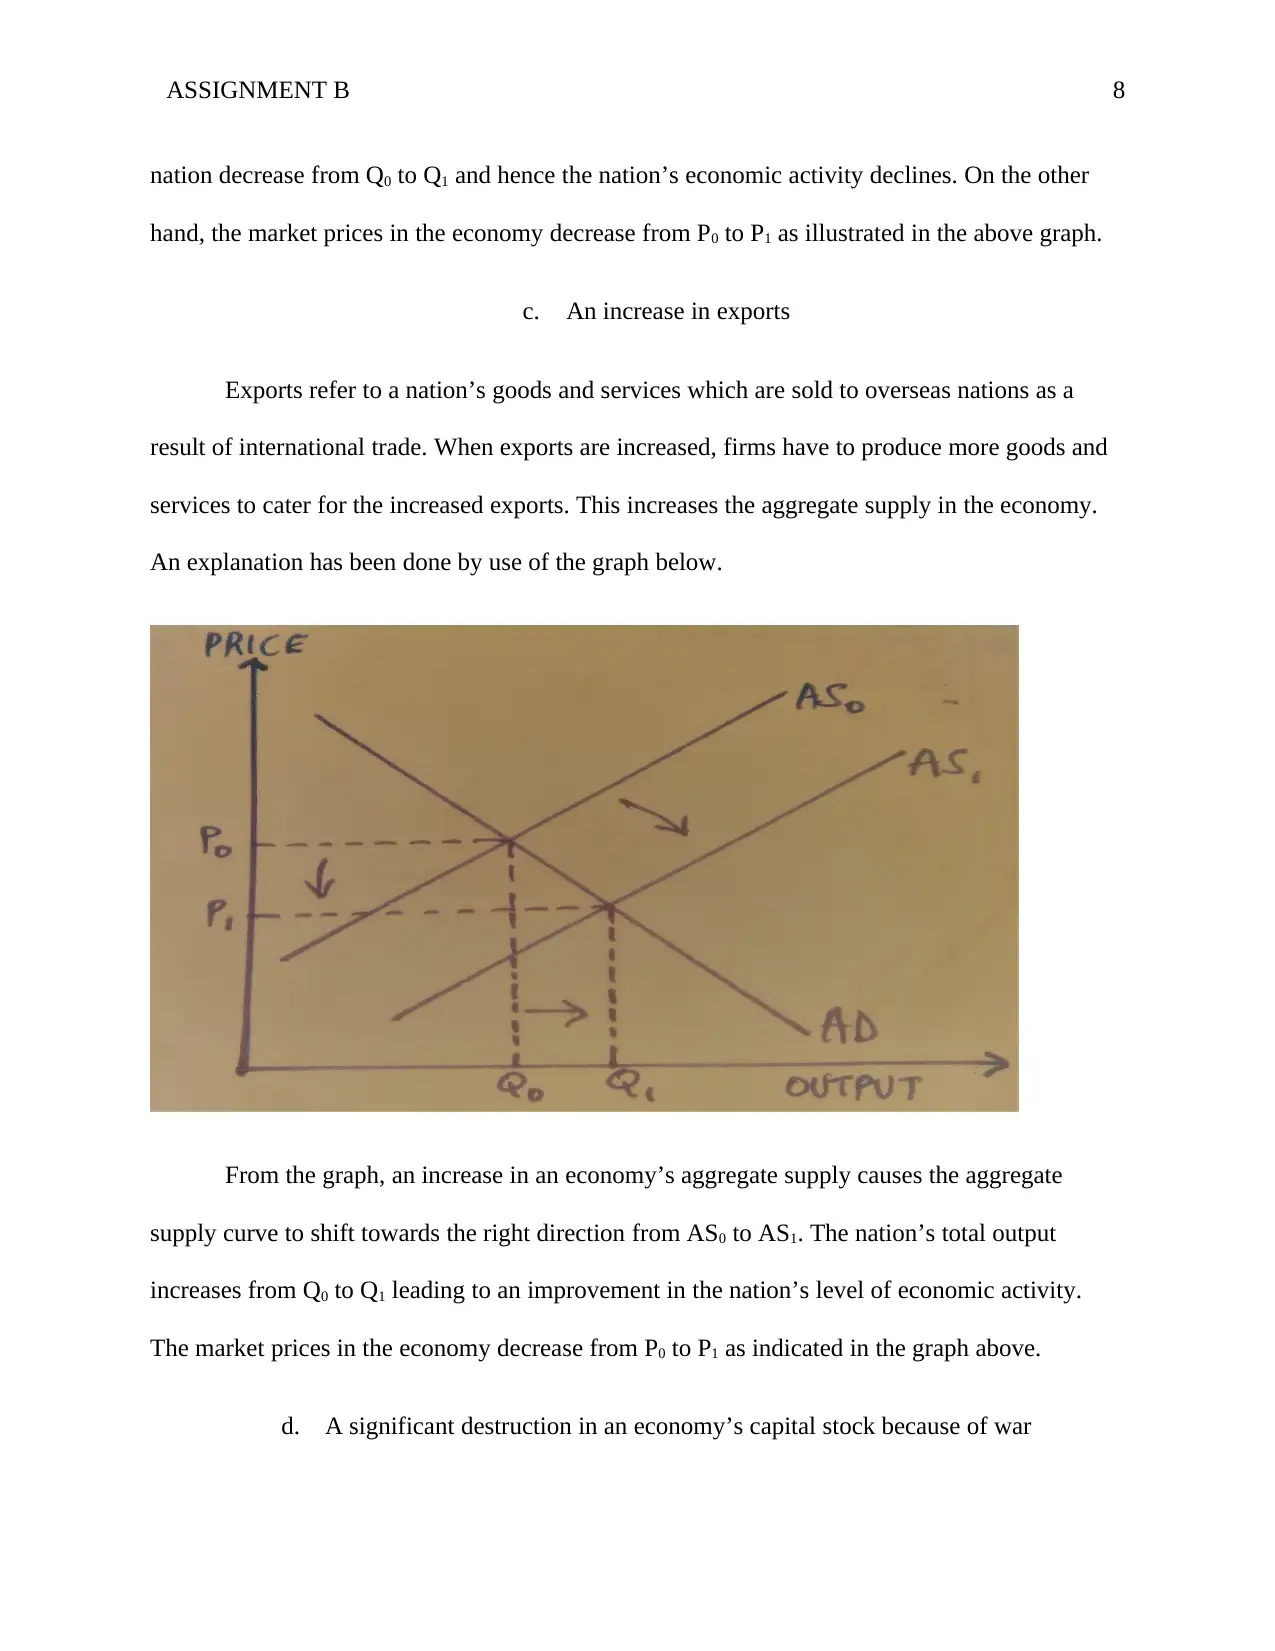
c. An increase in exports
Exports refer to a nation’s goods and services which are sold to overseas nations as a
result of international trade. When exports are increased, firms have to produce more goods and
services to cater for the increased exports. This increases the aggregate supply in the economy.
An explanation has been done by use of the graph below.
From the graph, an increase in an economy’s aggregate supply causes the aggregate
supply curve to shift towards the right direction from AS0 to AS1. The nation’s total output
increases from Q0 to Q1 leading to an improvement in the nation’s level of economic activity.
The market prices in the economy decrease from P0 to P1 as indicated in the graph above.
d. A significant destruction in an economy’s capital stock because of war
nation decrease from Q0 to Q1 and hence the nation’s economic activity declines. On the other
hand, the market prices in the economy decrease from P0 to P1 as illustrated in the above graph.
c. An increase in exports
Exports refer to a nation’s goods and services which are sold to overseas nations as a
result of international trade. When exports are increased, firms have to produce more goods and
services to cater for the increased exports. This increases the aggregate supply in the economy.
An explanation has been done by use of the graph below.
From the graph, an increase in an economy’s aggregate supply causes the aggregate
supply curve to shift towards the right direction from AS0 to AS1. The nation’s total output
increases from Q0 to Q1 leading to an improvement in the nation’s level of economic activity.
The market prices in the economy decrease from P0 to P1 as indicated in the graph above.
d. A significant destruction in an economy’s capital stock because of war
ASSIGNMENT B 9
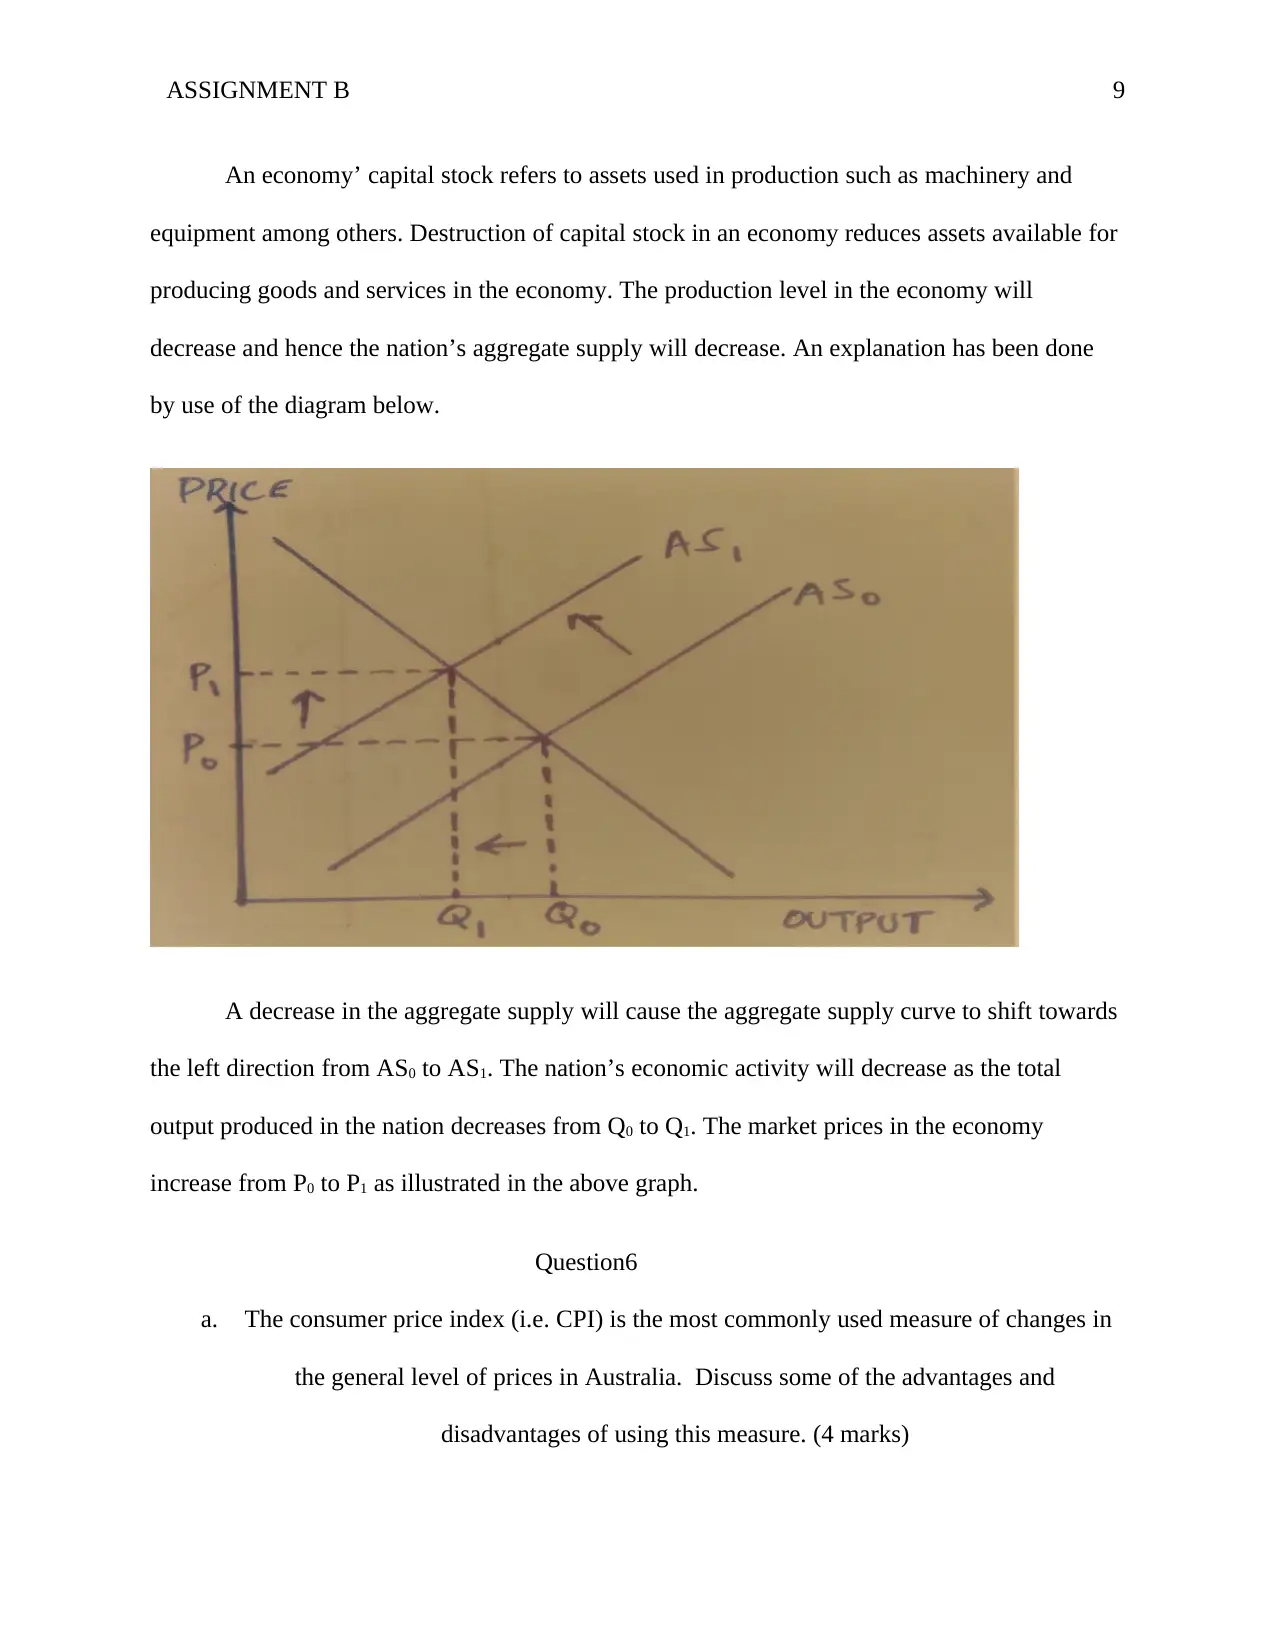
An economy’ capital stock refers to assets used in production such as machinery and
equipment among others. Destruction of capital stock in an economy reduces assets available for
producing goods and services in the economy. The production level in the economy will
decrease and hence the nation’s aggregate supply will decrease. An explanation has been done
by use of the diagram below.
A decrease in the aggregate supply will cause the aggregate supply curve to shift towards
the left direction from AS0 to AS1. The nation’s economic activity will decrease as the total
output produced in the nation decreases from Q0 to Q1. The market prices in the economy
increase from P0 to P1 as illustrated in the above graph.
Question6
a. The consumer price index (i.e. CPI) is the most commonly used measure of changes in
the general level of prices in Australia. Discuss some of the advantages and
disadvantages of using this measure. (4 marks)
⊘ This is a preview!⊘
Do you want full access?
Subscribe today to unlock all pages.
Trusted by 1+ million students worldwide
ASSIGNMENT B 10
Advantages of Using the Consumer Price Index in Price Measurement
Consumer price index indicates the level of inflation in an economy (Andersson, 2011).
By comparing the prices for different years and their trends, inflation can be obtained from the
consumer price index. This enables the government to take necessary actions towards adjusting
its policies to control inflation towards the planned target.
Consumer price index shows the level of income for consumers in the economy
(Statistics, 2013). By use of consumer price index in price measurement, the consumer income
level is indicated and hence the government can budget on how to allocate its budgeted funds
towards funding programs in the economy geared towards assisting citizens. Consumers in the
economy are assisted proportionately in accordance with their income level as indicated by the
consumer price index.
Disadvantages of Using the Consumer Price Index in Price Measurement
Consumer price index may give an inaccurate rate of inflation in an economy. As the
economy grows, various factors constituting its growth may change and these changes are not
considered by the consumer price index. For instance, the level of technology in the economy
may advance leading to the production of goods and services which are of high quality. Such
high-quality commodities will have to be sold at higher prices than before and hence consumer
price index will account for this price increase as inflation when it is actually not as the
commodities price match their improved quality.
The general price level indicated by the consumer price index may be inaccurate. This is
due to the fact consumer price index may inaccurately consider the goods and services quality or
Paraphrase This Document
Need a fresh take? Get an instant paraphrase of this document with our AI Paraphraser
ASSIGNMENT B 11
ignore it (Öner, 2012). It is difficult to correctly account for the quality of commodities when
measuring prices using the consumer price index and this may lead to inaccurate price
measurement. Goods may improve in quality and be sold at higher prices which match their
quality. The consumer price index will definitely consider this a price increase when it is actually
not as goods and services higher prices match their quality.
b. Explain why some people ‘lose’ from inflation and why do some people ‘win’ from
inflation? (6 marks)
An occurrence of inflation is coupled with two outcomes whereby people may win (gain)
or lose from it. This is due to the time value of money whereby a given amount of money today
may not be valuable as it was during the previous period before inflation.
Some people win from inflation such as the money borrowers and those who repay fixed
amounts as part of their debt settlement. This is because they repay the borrowed funds at fixed
amounts such as fixed previous interest rates which are not considered for adjustment to meet the
current level of inflation. They hence end up repaying lesser amounts of money when as the
amount of money repaid is of less value as compared to its previous value before inflation.
On the other hand, some people lose from inflation such as fixed income earners and
money lenders. For instance, those who earn fixed income such as pensioners continue earning
the same amount of money they were earning before inflation. This lowers their living standards
as the number of commodities they could purchase with the same amount of money previously
before inflation decreases and hence are forced to reduce their consumption rate. The money
lenders receive their lent money from borrowers at fixed previous interest rates set before
inflation which do not match the current inflation level. They, therefore, receive less in the real
ASSIGNMENT B 12
sense as the amount of money they receive is of less value as compared to its value previously
before inflation.
Question7
Which of the following would cause a growth in the money supply? Answer yes, no, or possibly
and explain your answer (i.e. please provide reasons). (2 marks each)
a. The selling of government securities to banks
No. when government securities are sold to banks, they use the amount of money
available for lending to pay the securities. This decreases the amount available for lending in
banks and hence banks reduce their lending activities and this reduces the supply of money in the
economy (Filardo, Mohanty & Moreno, 2012).
b. A fall in interest rates
Yes. When interest rates in the economy fall, businesses and individuals borrow more
money for investment and expenditure in various activities as money borrowing cost decreases.
This increases the money supply in the economy.
c. An increase in government expenditure, financed by borrowing from the banking sector
Yes. When the government borrows money from the banking sector to increase its
expenditure, the supply of money in the economy grows. This is because the borrowed money is
used in financing projects in the economy with the aim of fostering economic growth. The
expenditure increase in various economic sectors increases the money supply in the economy.
d. The purchase of government securities by the Central Bank from the banking sector
⊘ This is a preview!⊘
Do you want full access?
Subscribe today to unlock all pages.
Trusted by 1+ million students worldwide
1 out of 16
Related Documents


Your All-in-One AI-Powered Toolkit for Academic Success.
+13062052269
info@desklib.com
Available 24*7 on WhatsApp / Email
![[object Object]](/_next/static/media/star-bottom.7253800d.svg)
Unlock your academic potential
Copyright © 2020–2026 A2Z Services. All Rights Reserved. Developed and managed by ZUCOL.