Data Analysis: Forecasting Demand Using Trend and Regression

Verified

Added on  2023/01/05

|6
|798
|54
Homework Assignment
AI Summary
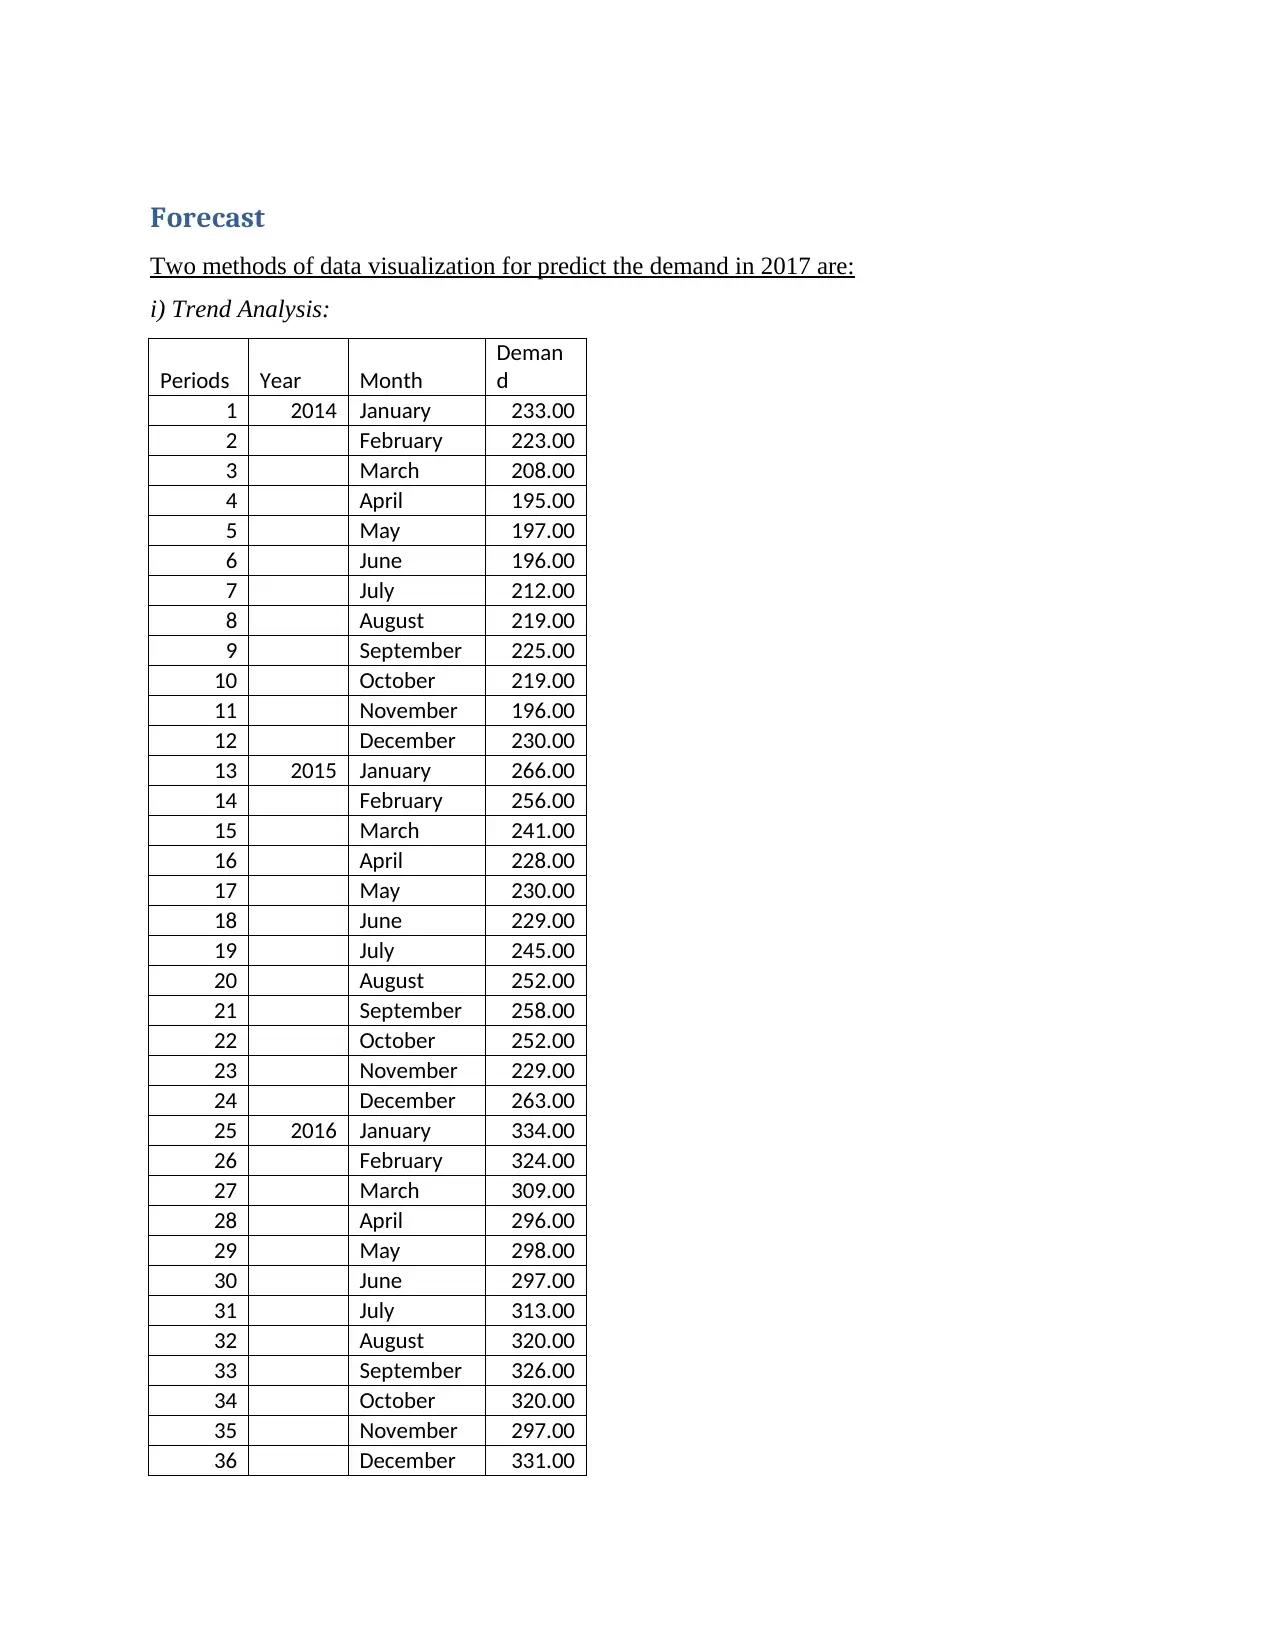
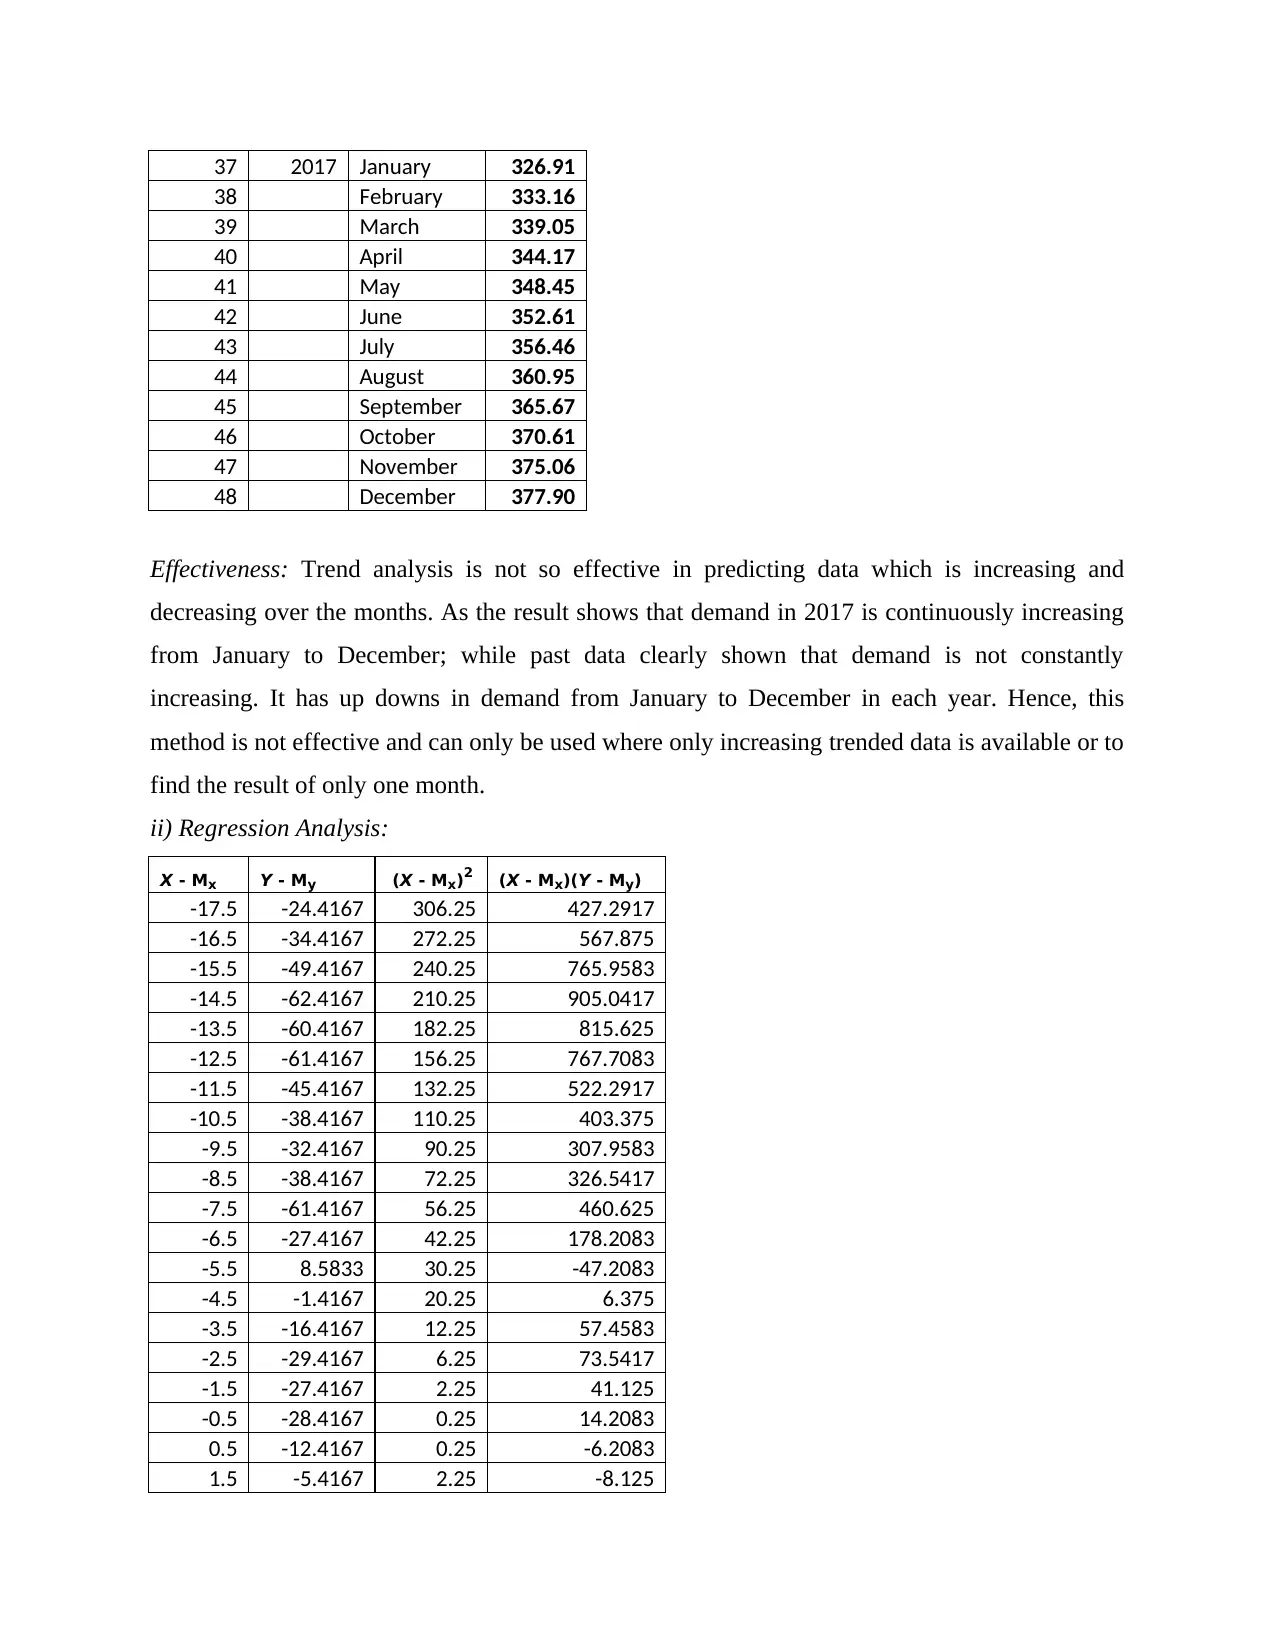
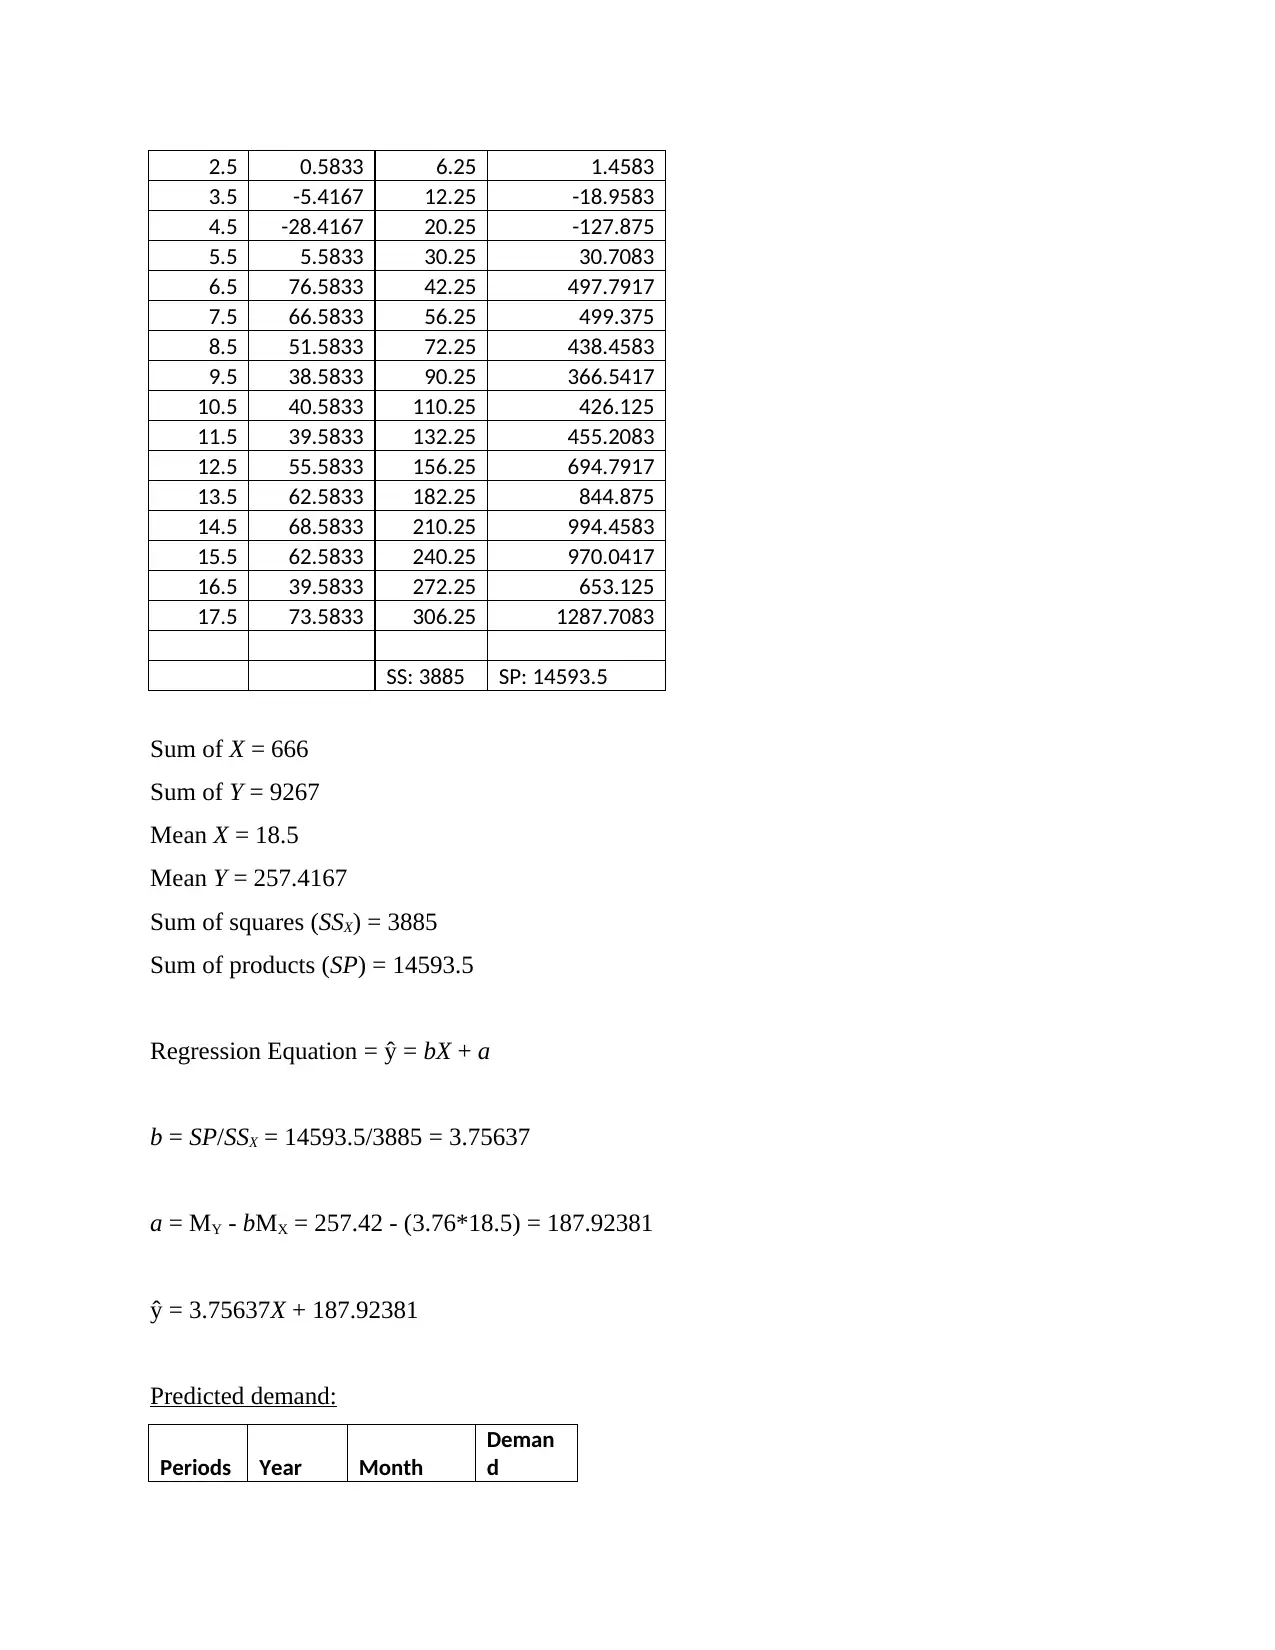
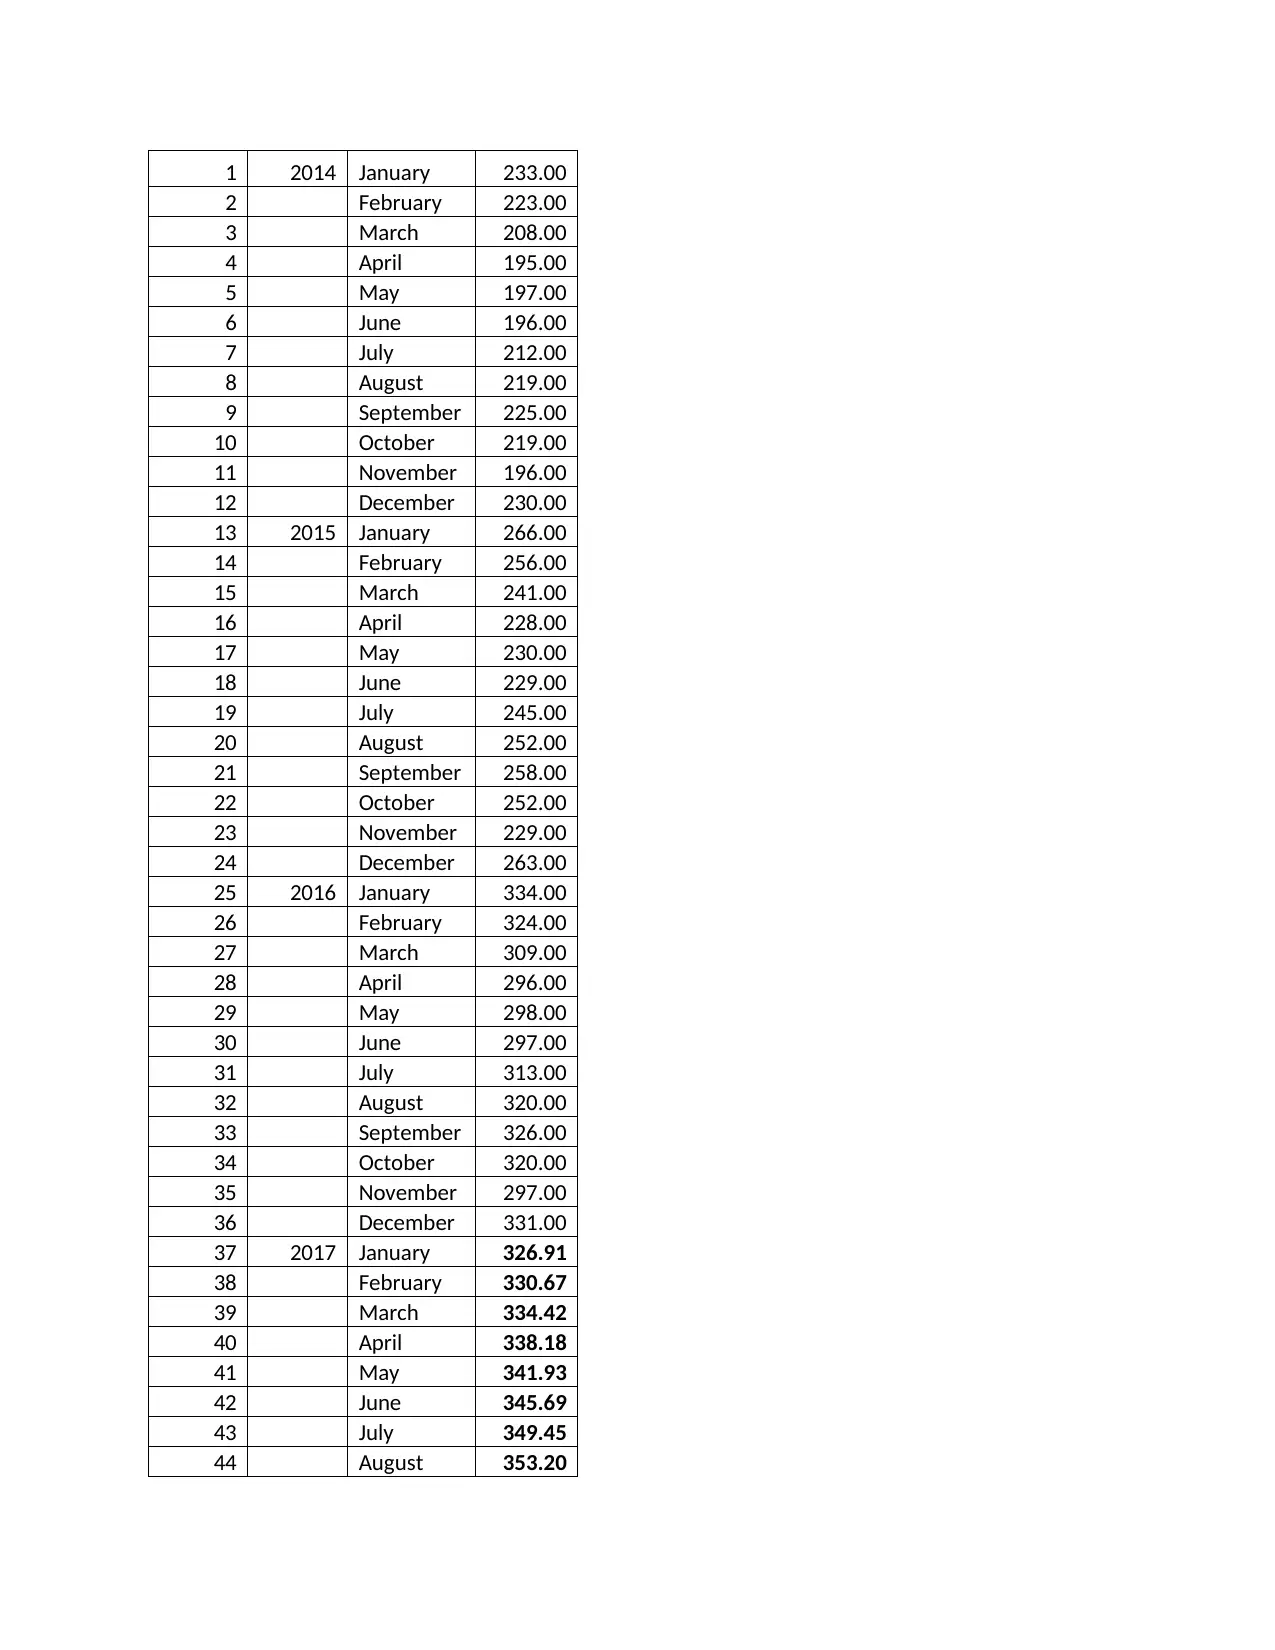
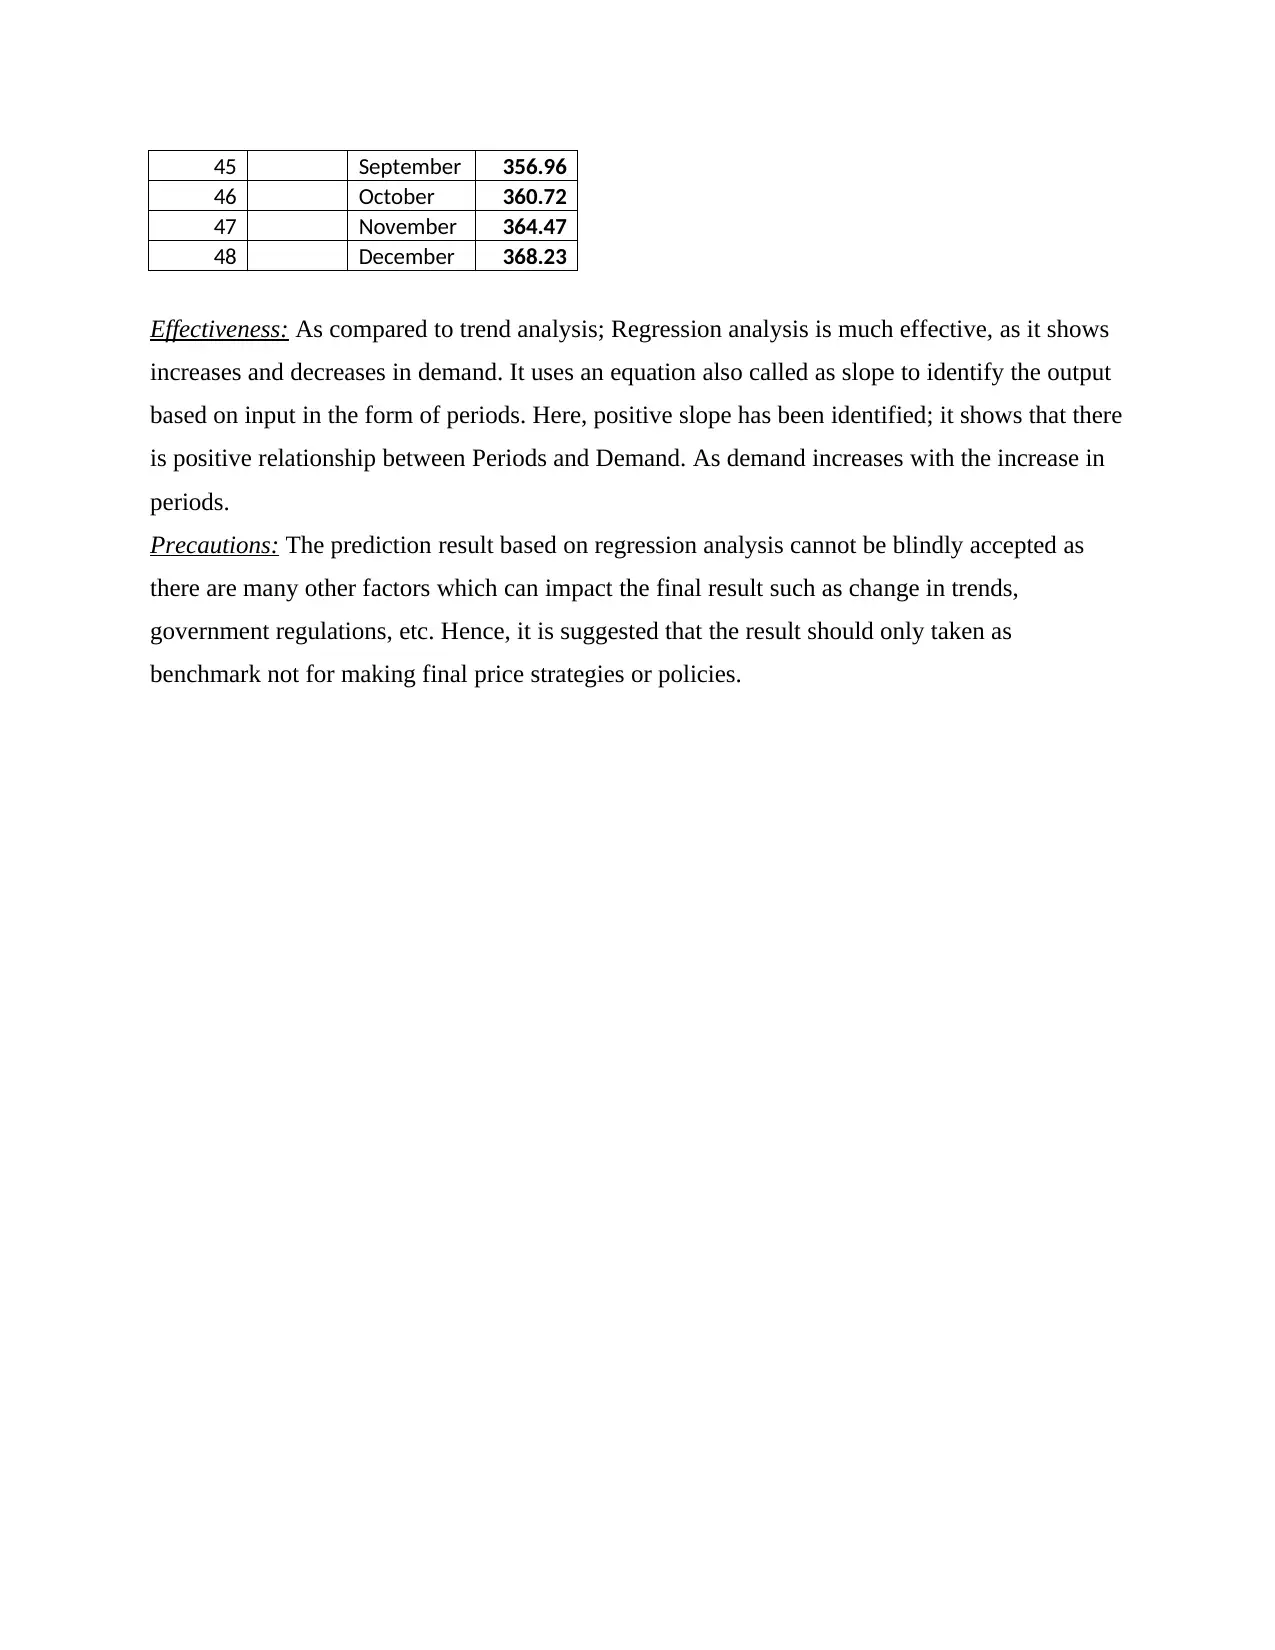
This assignment focuses on forecasting demand using two primary data visualization methods: trend analysis and regression analysis. The assignment presents a dataset of monthly demand from 2014 to 2016, followed by forecasts for 2017 using both methods. Trend analysis, while showing a continuous increase in demand for 2017, is deemed less effective due to its inability to account for the fluctuations observed in historical data. Regression analysis, on the other hand, is presented as a more effective method, providing an equation to predict demand based on periods and demonstrating a positive relationship between periods and demand. The assignment includes calculations of the regression equation, and predicted demand values, while also emphasizing the need for caution in interpreting the results due to external factors. The assignment concludes by comparing the effectiveness of both methods and highlighting the importance of considering various influencing factors beyond the statistical models when making final decisions.
tabler-icon-diamond-filled.svg

Contribute Materials

Your contribution can guide someone’s learning journey. Share your documents today.
Document Page
Forecasting
tabler-icon-diamond-filled.svg

Secure Best Marks with AI Grader

Need help grading? Try our AI Grader for instant feedback on your assignments.
Document Page
Forecast
Two methods of data visualization for predict the demand in 2017 are:
i) Trend Analysis:
Periods Year Month
Deman
d
1 2014 January 233.00
2 February 223.00
3 March 208.00
4 April 195.00
5 May 197.00
6 June 196.00
7 July 212.00
8 August 219.00
9 September 225.00
10 October 219.00
11 November 196.00
12 December 230.00
13 2015 January 266.00
14 February 256.00
15 March 241.00
16 April 228.00
17 May 230.00
18 June 229.00
19 July 245.00
20 August 252.00
21 September 258.00
22 October 252.00
23 November 229.00
24 December 263.00
25 2016 January 334.00
26 February 324.00
27 March 309.00
28 April 296.00
29 May 298.00
30 June 297.00
31 July 313.00
32 August 320.00
33 September 326.00
34 October 320.00
35 November 297.00
36 December 331.00
Document Page
37 2017 January 326.91
38 February 333.16
39 March 339.05
40 April 344.17
41 May 348.45
42 June 352.61
43 July 356.46
44 August 360.95
45 September 365.67
46 October 370.61
47 November 375.06
48 December 377.90
Effectiveness: Trend analysis is not so effective in predicting data which is increasing and
decreasing over the months. As the result shows that demand in 2017 is continuously increasing
from January to December; while past data clearly shown that demand is not constantly
increasing. It has up downs in demand from January to December in each year. Hence, this
method is not effective and can only be used where only increasing trended data is available or to
find the result of only one month.
ii) Regression Analysis:
X - Mx Y - My (X - Mx)2 (X - Mx)(Y - My)
-17.5 -24.4167 306.25 427.2917
-16.5 -34.4167 272.25 567.875
-15.5 -49.4167 240.25 765.9583
-14.5 -62.4167 210.25 905.0417
-13.5 -60.4167 182.25 815.625
-12.5 -61.4167 156.25 767.7083
-11.5 -45.4167 132.25 522.2917
-10.5 -38.4167 110.25 403.375
-9.5 -32.4167 90.25 307.9583
-8.5 -38.4167 72.25 326.5417
-7.5 -61.4167 56.25 460.625
-6.5 -27.4167 42.25 178.2083
-5.5 8.5833 30.25 -47.2083
-4.5 -1.4167 20.25 6.375
-3.5 -16.4167 12.25 57.4583
-2.5 -29.4167 6.25 73.5417
-1.5 -27.4167 2.25 41.125
-0.5 -28.4167 0.25 14.2083
0.5 -12.4167 0.25 -6.2083
1.5 -5.4167 2.25 -8.125
Document Page
2.5 0.5833 6.25 1.4583
3.5 -5.4167 12.25 -18.9583
4.5 -28.4167 20.25 -127.875
5.5 5.5833 30.25 30.7083
6.5 76.5833 42.25 497.7917
7.5 66.5833 56.25 499.375
8.5 51.5833 72.25 438.4583
9.5 38.5833 90.25 366.5417
10.5 40.5833 110.25 426.125
11.5 39.5833 132.25 455.2083
12.5 55.5833 156.25 694.7917
13.5 62.5833 182.25 844.875
14.5 68.5833 210.25 994.4583
15.5 62.5833 240.25 970.0417
16.5 39.5833 272.25 653.125
17.5 73.5833 306.25 1287.7083
SS: 3885 SP: 14593.5
Sum of X = 666
Sum of Y = 9267
Mean X = 18.5
Mean Y = 257.4167
Sum of squares (SSX) = 3885
Sum of products (SP) = 14593.5
Regression Equation = ŷ = bX + a
b = SP/SSX = 14593.5/3885 = 3.75637
a = MY - bMX = 257.42 - (3.76*18.5) = 187.92381
ŷ = 3.75637X + 187.92381
Predicted demand:
Periods Year Month
Deman
d
tabler-icon-diamond-filled.svg

Secure Best Marks with AI Grader

Need help grading? Try our AI Grader for instant feedback on your assignments.
Document Page
1 2014 January 233.00
2 February 223.00
3 March 208.00
4 April 195.00
5 May 197.00
6 June 196.00
7 July 212.00
8 August 219.00
9 September 225.00
10 October 219.00
11 November 196.00
12 December 230.00
13 2015 January 266.00
14 February 256.00
15 March 241.00
16 April 228.00
17 May 230.00
18 June 229.00
19 July 245.00
20 August 252.00
21 September 258.00
22 October 252.00
23 November 229.00
24 December 263.00
25 2016 January 334.00
26 February 324.00
27 March 309.00
28 April 296.00
29 May 298.00
30 June 297.00
31 July 313.00
32 August 320.00
33 September 326.00
34 October 320.00
35 November 297.00
36 December 331.00
37 2017 January 326.91
38 February 330.67
39 March 334.42
40 April 338.18
41 May 341.93
42 June 345.69
43 July 349.45
44 August 353.20
Document Page
45 September 356.96
46 October 360.72
47 November 364.47
48 December 368.23
Effectiveness: As compared to trend analysis; Regression analysis is much effective, as it shows
increases and decreases in demand. It uses an equation also called as slope to identify the output
based on input in the form of periods. Here, positive slope has been identified; it shows that there
is positive relationship between Periods and Demand. As demand increases with the increase in
periods.
Precautions: The prediction result based on regression analysis cannot be blindly accepted as
there are many other factors which can impact the final result such as change in trends,
government regulations, etc. Hence, it is suggested that the result should only taken as
benchmark not for making final price strategies or policies.
chevron_up_icon
1 out of 6
circle_padding
hide_on_mobile
zoom_out_icon
logo.png

Your All-in-One AI-Powered Toolkit for Academic Success.

Available 24*7 on WhatsApp / Email

[object Object]