Contemporary Business Economics: Demand and Supply Analysis Report
VerifiedAdded on 2022/12/15
|14
|3063
|343
Report
AI Summary
This report provides a comprehensive analysis of demand and supply, fundamental concepts in contemporary business economics. It begins with an explanation of the law of demand, including movements along the demand curve and changes in the demand curve, supported by diagrams. Similarly, it elucidates the law of supply, movements along the supply curve, and shifts in the supply curve, also with graphical representations. The report then delves into a comparison of emerging theories and models in 21st-century economics with those of the 20th century, relating both to modern business practices. The analysis encompasses classical and Marxist economics, as well as economic models, offering insights into how these concepts shape business strategies. The report concludes by highlighting the significance of demand and supply analysis for business growth and success. The provided solution is contributed by a student on Desklib, a platform offering AI-based study tools.
Contemporary Business
Economics.
Economics.
Paraphrase This Document
Need a fresh take? Get an instant paraphrase of this document with our AI Paraphraser
Contents
INTRODUCTION...........................................................................................................................1
MAIN BODY...................................................................................................................................1
Explain law of demand movement along with same demand curve with diagram and changes
in demand curve.....................................................................................................................1
Explain the law of supply, movement along with the same supply curve along with diagram
and changes in supply curve...................................................................................................6
TASK 2............................................................................................................................................8
Illustrate about reason among emerging theories and model in 21st century contemporary
economics with those in 20th century and having modern practise in business......................8
CONCLUSION................................................................................................................................8
REFERENCES................................................................................................................................9
INTRODUCTION
The contemporary business meaning long in within the same period of time to understand the
better business environment on the basis of competitive market (Binhalail and Gohar , 2021). As
if it's fluctuating at very fast pace on which business proprietor must be eligible enough to
understand the requirements and a development with it involves in its business that the targets
could be accomplished in a effective manner. Business Economics is a field or a platform in
which economics studies related with financial market related with environmental issues faced
over the Corporation. As a business in economics defects subjects related searches the concept of
demand supply scarcity product factors certain sort of distribution and so on. There is a graphical
representation that shows price of the supply curve at shift to the market segment and have to
achieve certain equilibrium level. In this report there is a overall evaluation related to demand
and supply movement and how it operates within the market as well as economy through
diagram (D'Andrea, 2021). By comparing and contrast with emerging theories and model in 21st
century within the contemporary economic towards modern business practice. By framing
business of retail industry to shows demand and supply movement curve operates within
competitive market.
MAIN BODY
Explain law of demand movement along with same demand curve with diagram and changes in
demand curve.
The concept of law of demand states that the other factor being can
constant of price and quantity demanded of any product and services which
are entitled to proportionate to each other. It is a simple theory describe if there is high price then
the demand of the product would fall and if the product demand is high the price can be
negotiated which would can increase within market (Glavaš, Unukić and Budimir., 2020). It
only occurs when there is a diminishing marginal utility which also reflect that consumer when
they use their first economic product they buy which fulfil their most urgent needs using
additional unit of the goods and subsequently
lower valued cost. For example usually people are buy retail products and there are usually
every types of product which consists in retail market whether in economic cost skills and
premium price rate. If the prices food high in premium retail market the demand of that
1
⊘ This is a preview!⊘
Do you want full access?
Subscribe today to unlock all pages.
Trusted by 1+ million students worldwide
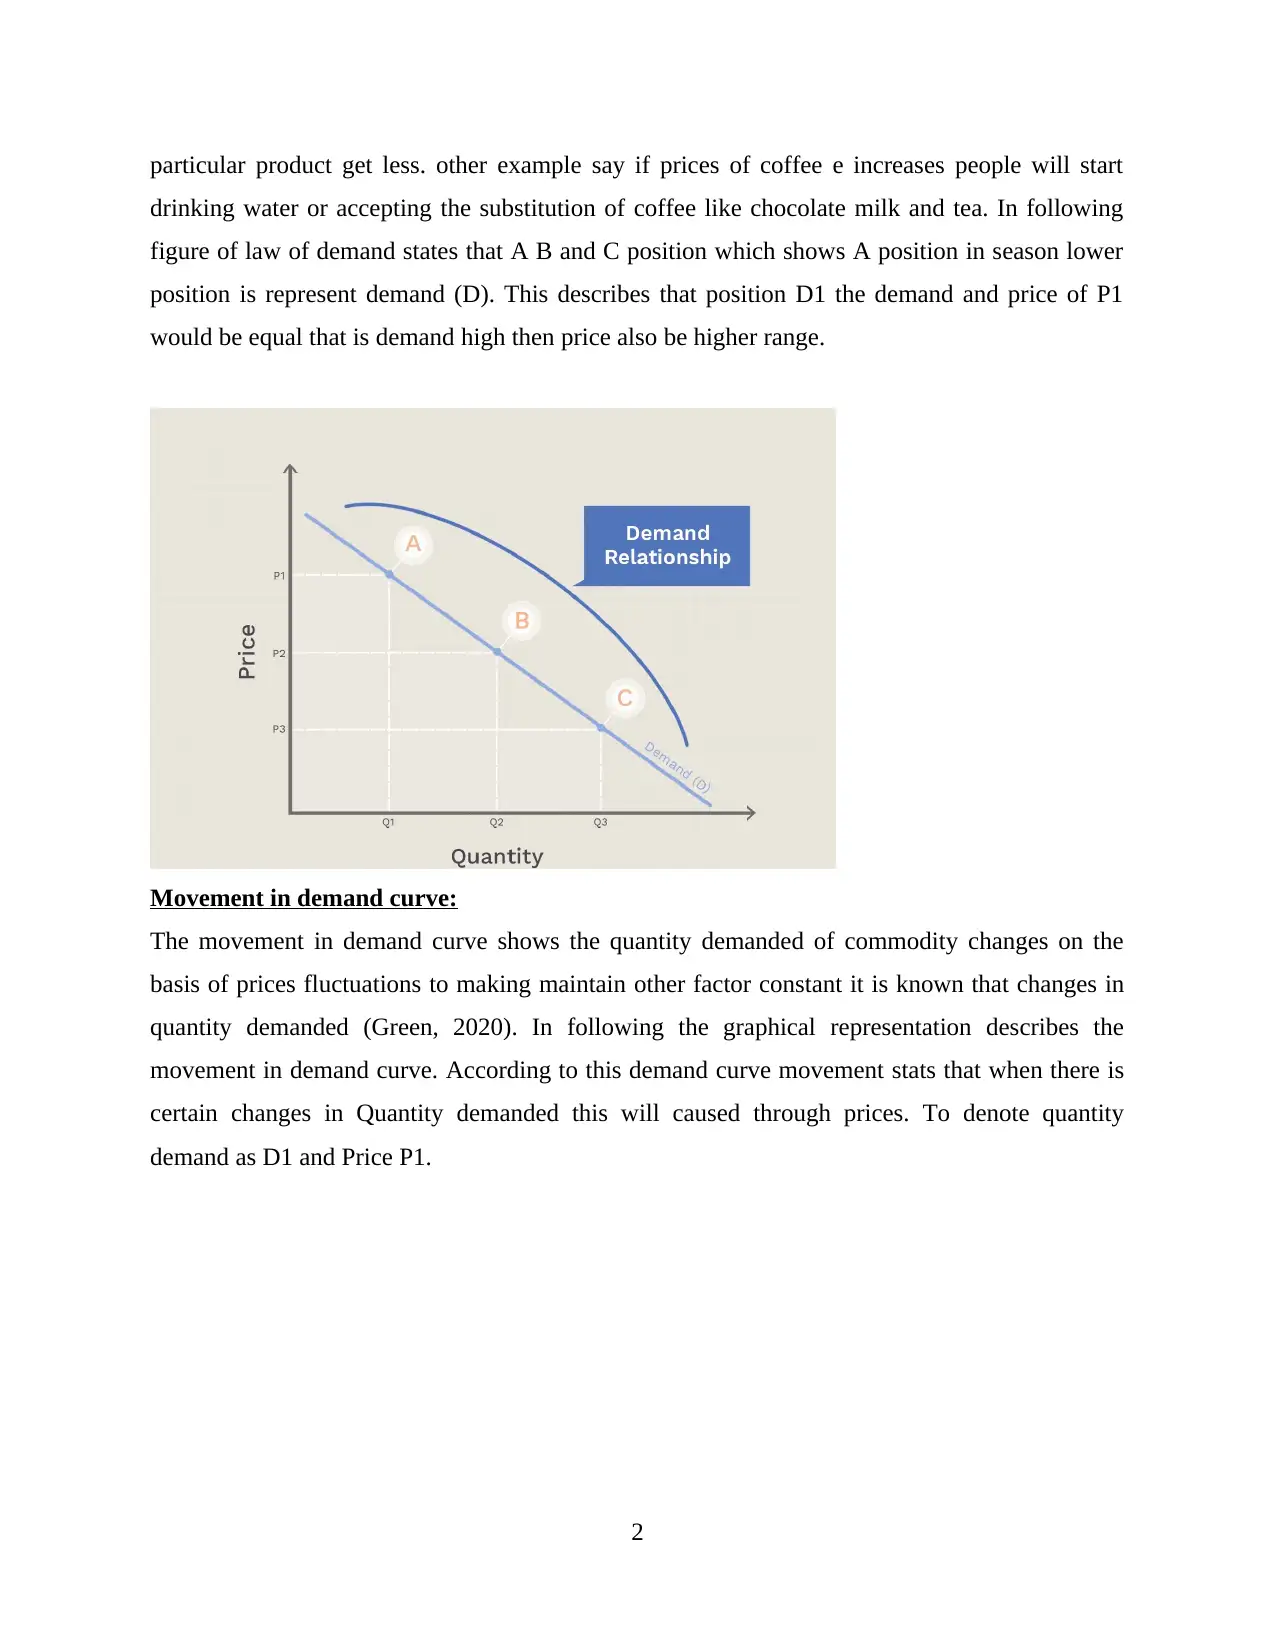
particular product get less. other example say if prices of coffee e increases people will start
drinking water or accepting the substitution of coffee like chocolate milk and tea. In following
figure of law of demand states that A B and C position which shows A position in season lower
position is represent demand (D). This describes that position D1 the demand and price of P1
would be equal that is demand high then price also be higher range.
Movement in demand curve:
The movement in demand curve shows the quantity demanded of commodity changes on the
basis of prices fluctuations to making maintain other factor constant it is known that changes in
quantity demanded (Green, 2020). In following the graphical representation describes the
movement in demand curve. According to this demand curve movement stats that when there is
certain changes in Quantity demanded this will caused through prices. To denote quantity
demand as D1 and Price P1.
2
Paraphrase This Document
Need a fresh take? Get an instant paraphrase of this document with our AI Paraphraser
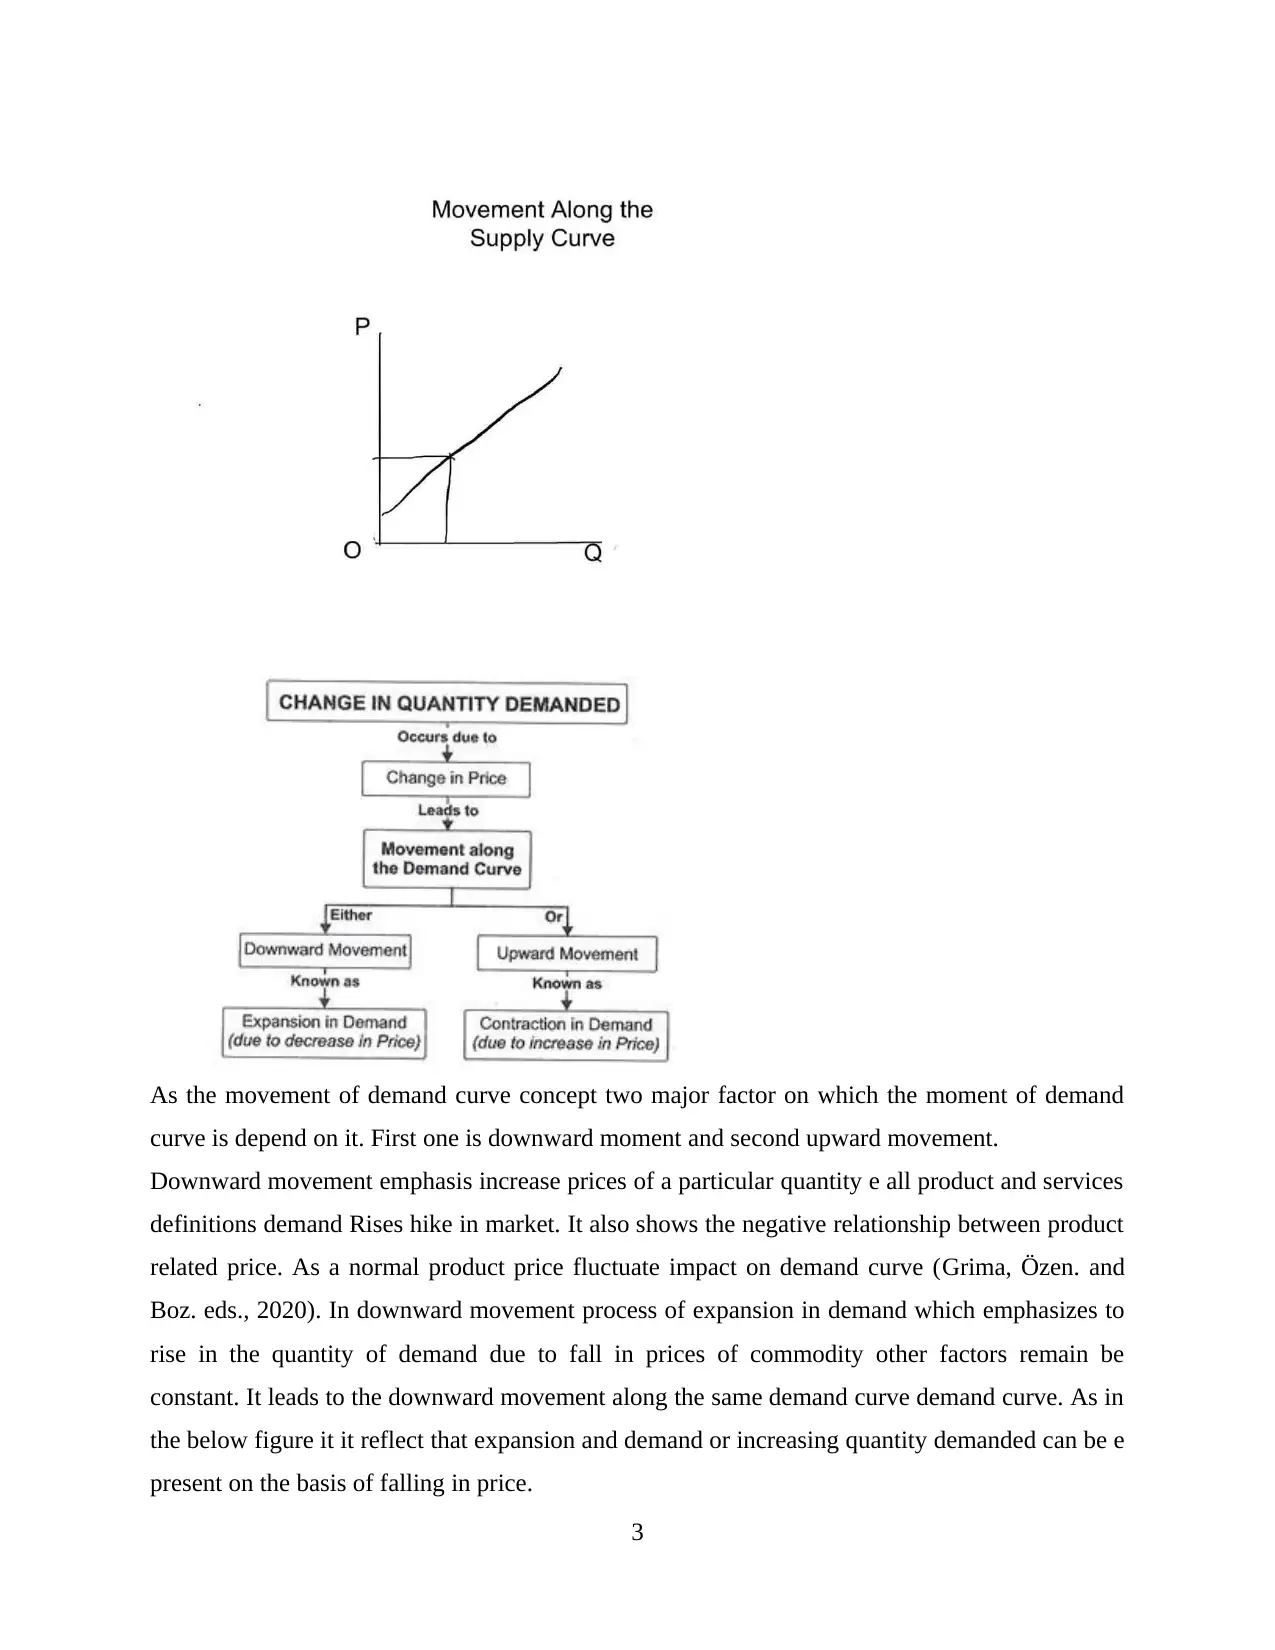
As the movement of demand curve concept two major factor on which the moment of demand
curve is depend on it. First one is downward moment and second upward movement.
Downward movement emphasis increase prices of a particular quantity e all product and services
definitions demand Rises hike in market. It also shows the negative relationship between product
related price. As a normal product price fluctuate impact on demand curve (Grima, Özen. and
Boz. eds., 2020). In downward movement process of expansion in demand which emphasizes to
rise in the quantity of demand due to fall in prices of commodity other factors remain be
constant. It leads to the downward movement along the same demand curve demand curve. As in
the below figure it it reflect that expansion and demand or increasing quantity demanded can be e
present on the basis of falling in price.
3
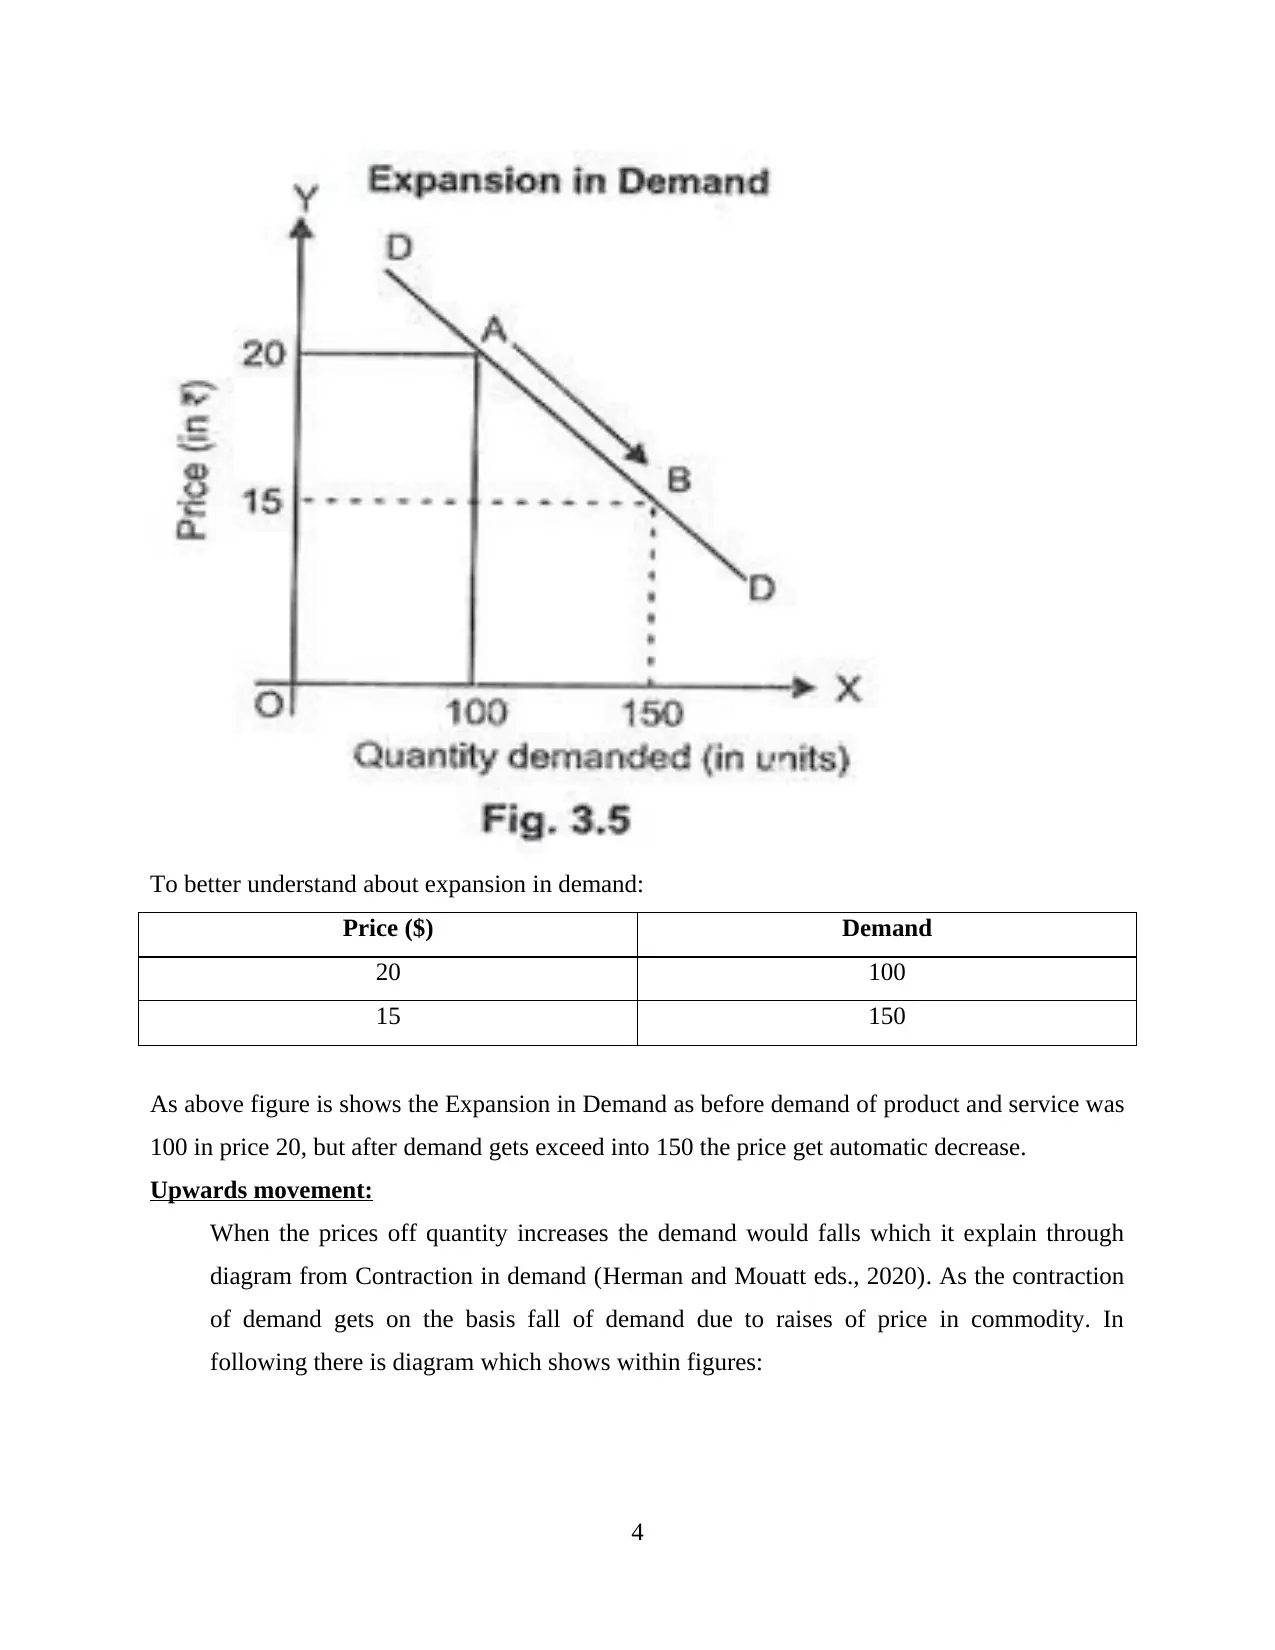
To better understand about expansion in demand:
Price ($) Demand
20 100
15 150
As above figure is shows the Expansion in Demand as before demand of product and service was
100 in price 20, but after demand gets exceed into 150 the price get automatic decrease.
Upwards movement:
When the prices off quantity increases the demand would falls which it explain through
diagram from Contraction in demand (Herman and Mouatt eds., 2020). As the contraction
of demand gets on the basis fall of demand due to raises of price in commodity. In
following there is diagram which shows within figures:
4
⊘ This is a preview!⊘
Do you want full access?
Subscribe today to unlock all pages.
Trusted by 1+ million students worldwide
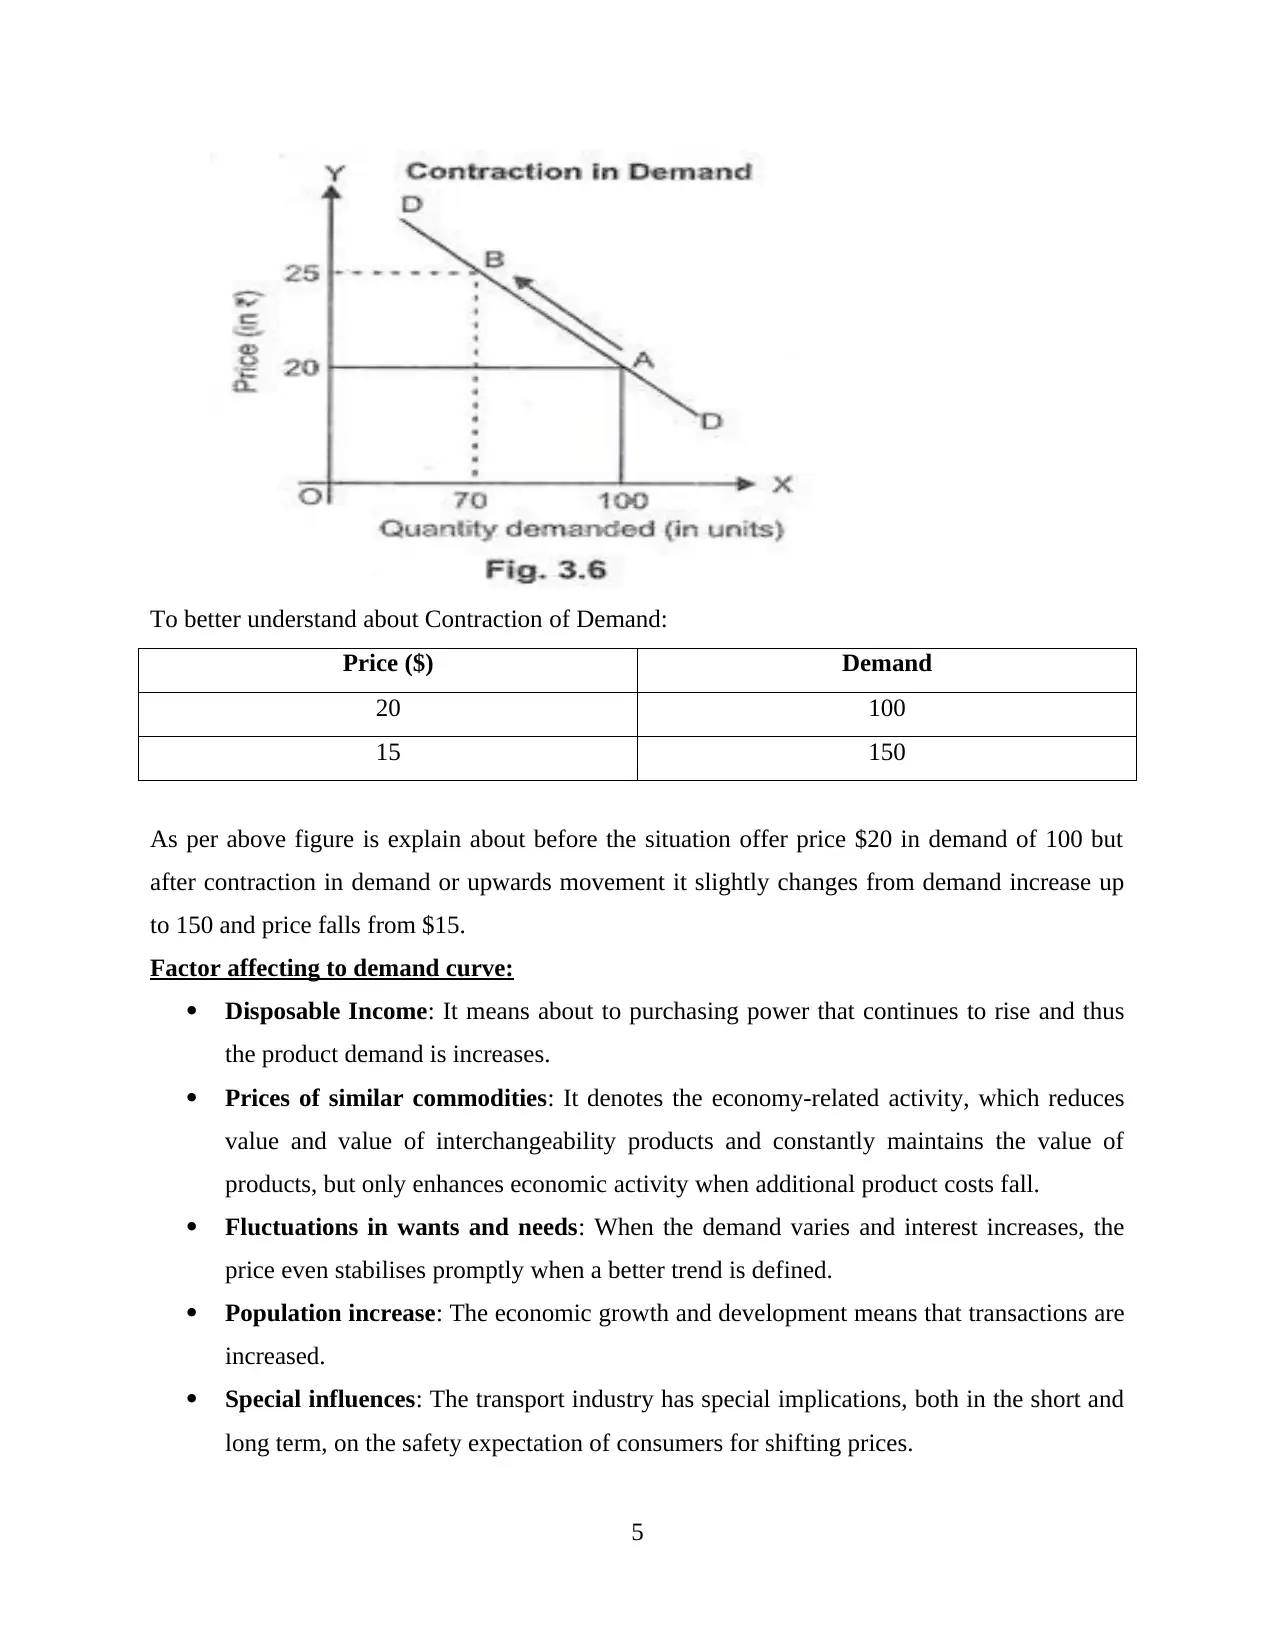
To better understand about Contraction of Demand:
Price ($) Demand
20 100
15 150
As per above figure is explain about before the situation offer price $20 in demand of 100 but
after contraction in demand or upwards movement it slightly changes from demand increase up
to 150 and price falls from $15.
Factor affecting to demand curve:
Disposable Income: It means about to purchasing power that continues to rise and thus
the product demand is increases.
Prices of similar commodities: It denotes the economy-related activity, which reduces
value and value of interchangeability products and constantly maintains the value of
products, but only enhances economic activity when additional product costs fall.
Fluctuations in wants and needs: When the demand varies and interest increases, the
price even stabilises promptly when a better trend is defined.
Population increase: The economic growth and development means that transactions are
increased.
Special influences: The transport industry has special implications, both in the short and
long term, on the safety expectation of consumers for shifting prices.
5
Paraphrase This Document
Need a fresh take? Get an instant paraphrase of this document with our AI Paraphraser
In other conditions the demand curve shifts, there are all kinds of variances (Knezović., Riđić
and Chambas, , 2020). If demand at the price level increases then it means that the demand
curve is moving in the correct direction and if the price falls, the price of the market shifts to
the left
Explain the law of supply, movement along with the same supply curve along with diagram and
changes in supply curve.
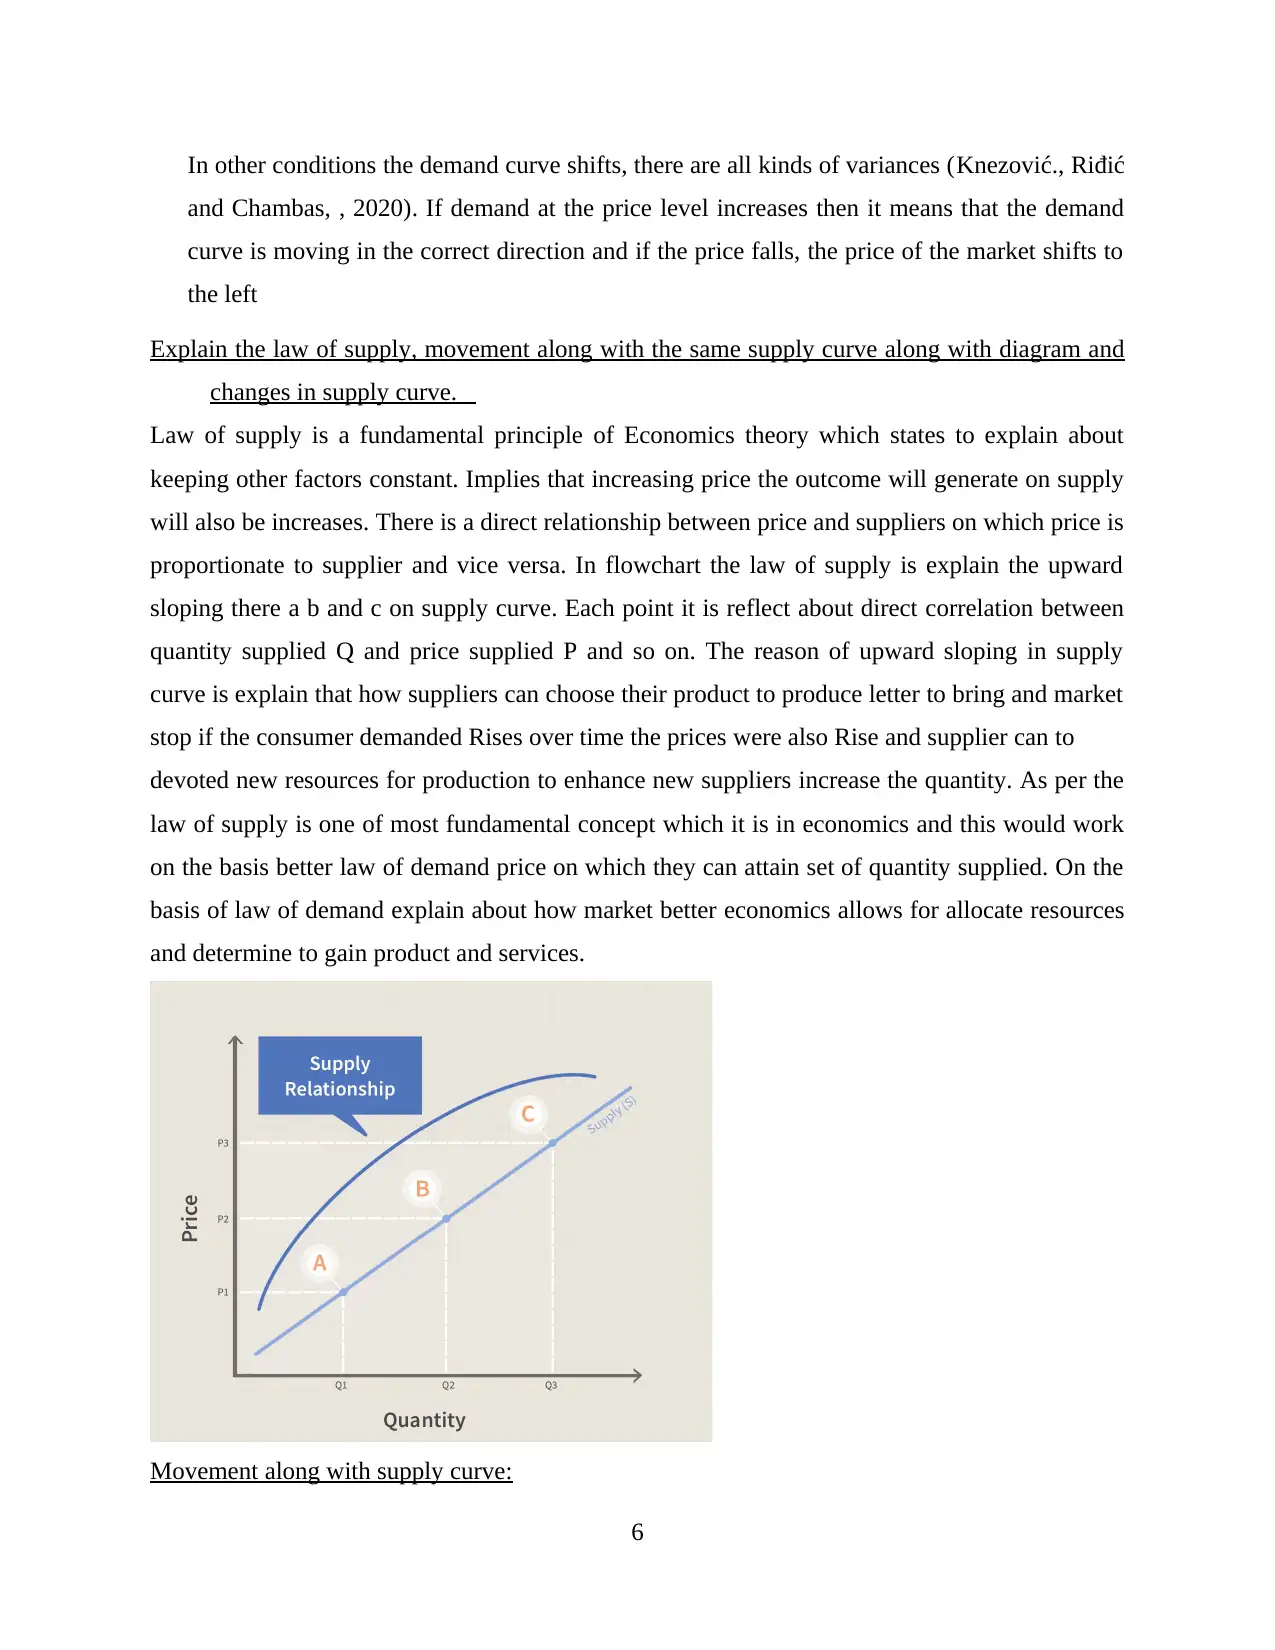
Law of supply is a fundamental principle of Economics theory which states to explain about
keeping other factors constant. Implies that increasing price the outcome will generate on supply
will also be increases. There is a direct relationship between price and suppliers on which price is
proportionate to supplier and vice versa. In flowchart the law of supply is explain the upward
sloping there a b and c on supply curve. Each point it is reflect about direct correlation between
quantity supplied Q and price supplied P and so on. The reason of upward sloping in supply
curve is explain that how suppliers can choose their product to produce letter to bring and market
stop if the consumer demanded Rises over time the prices were also Rise and supplier can to
devoted new resources for production to enhance new suppliers increase the quantity. As per the
law of supply is one of most fundamental concept which it is in economics and this would work
on the basis better law of demand price on which they can attain set of quantity supplied. On the
basis of law of demand explain about how market better economics allows for allocate resources
and determine to gain product and services.
Movement along with supply curve:
6
and Chambas, , 2020). If demand at the price level increases then it means that the demand
curve is moving in the correct direction and if the price falls, the price of the market shifts to
the left
Explain the law of supply, movement along with the same supply curve along with diagram and
changes in supply curve.
Law of supply is a fundamental principle of Economics theory which states to explain about
keeping other factors constant. Implies that increasing price the outcome will generate on supply
will also be increases. There is a direct relationship between price and suppliers on which price is
proportionate to supplier and vice versa. In flowchart the law of supply is explain the upward
sloping there a b and c on supply curve. Each point it is reflect about direct correlation between
quantity supplied Q and price supplied P and so on. The reason of upward sloping in supply
curve is explain that how suppliers can choose their product to produce letter to bring and market
stop if the consumer demanded Rises over time the prices were also Rise and supplier can to
devoted new resources for production to enhance new suppliers increase the quantity. As per the
law of supply is one of most fundamental concept which it is in economics and this would work
on the basis better law of demand price on which they can attain set of quantity supplied. On the
basis of law of demand explain about how market better economics allows for allocate resources
and determine to gain product and services.
Movement along with supply curve:
6
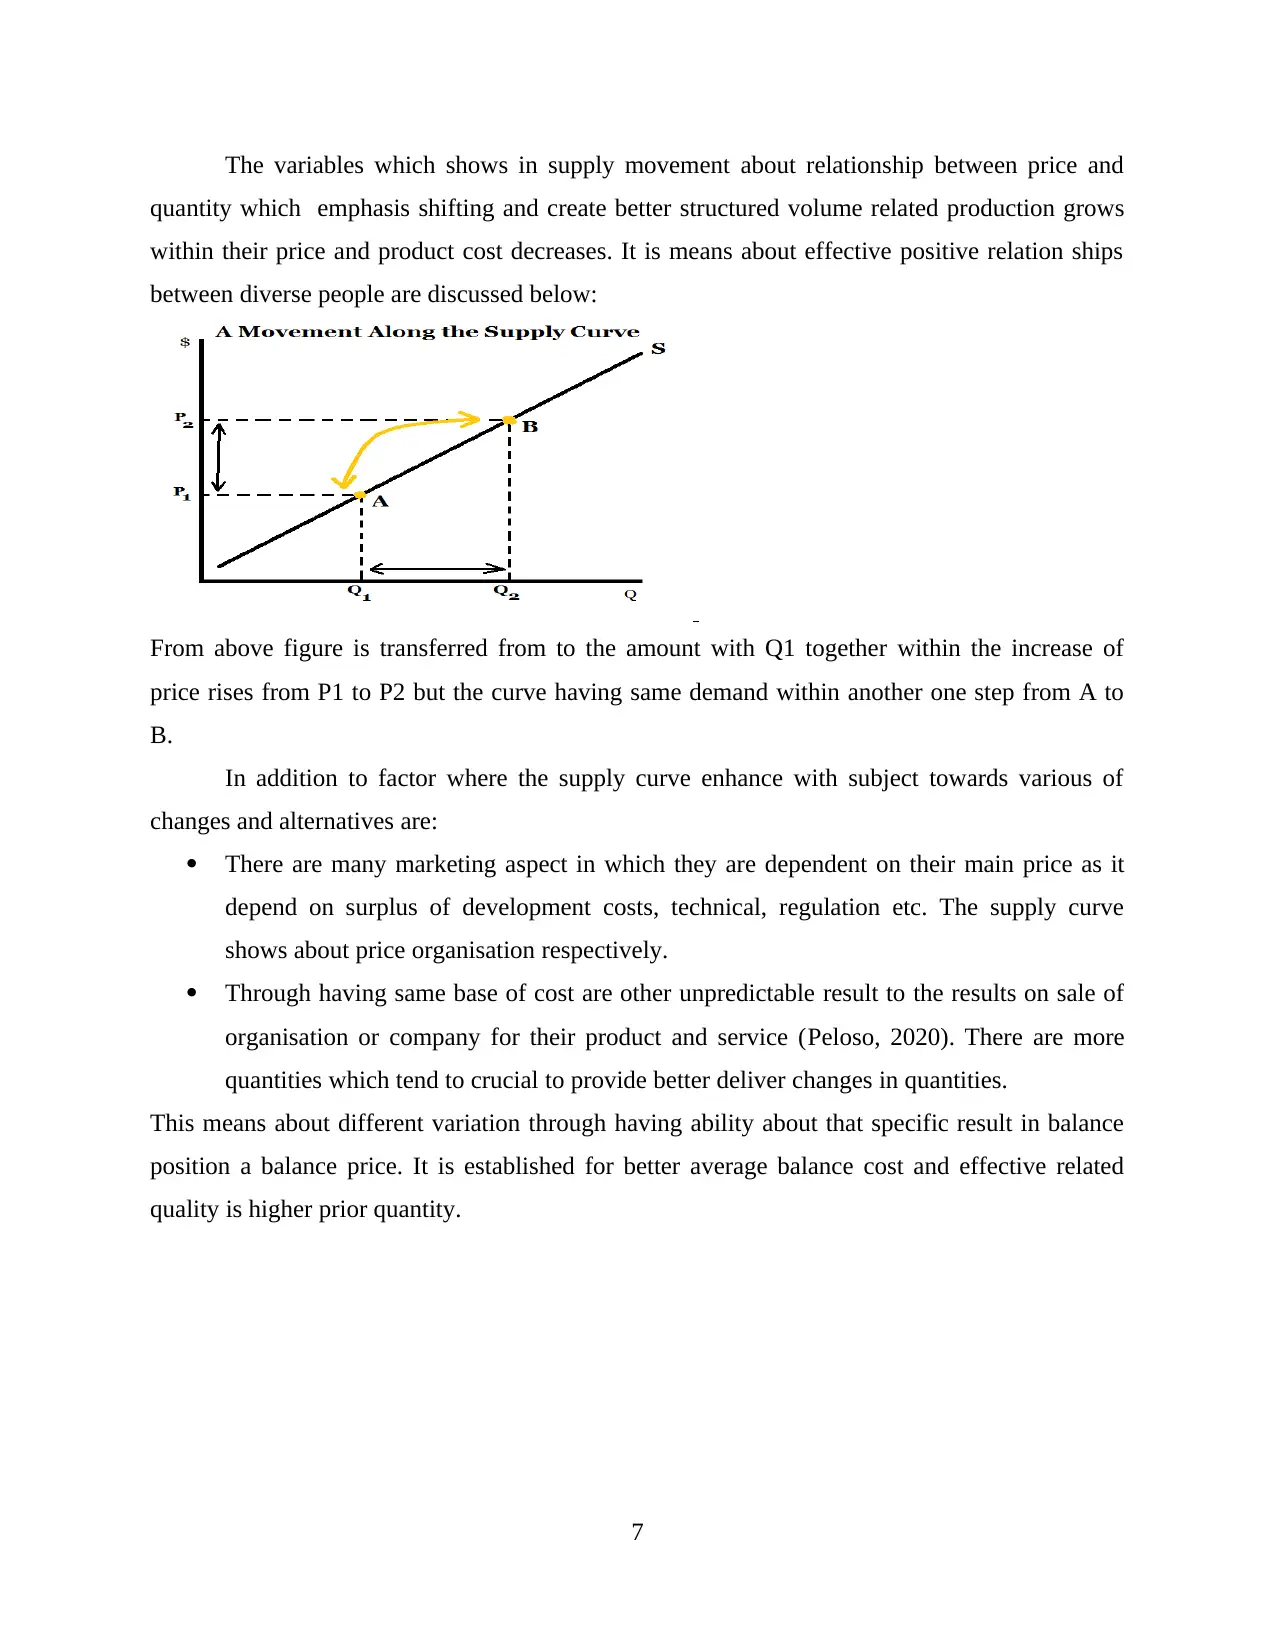
The variables which shows in supply movement about relationship between price and
quantity which emphasis shifting and create better structured volume related production grows
within their price and product cost decreases. It is means about effective positive relation ships
between diverse people are discussed below:
From above figure is transferred from to the amount with Q1 together within the increase of
price rises from P1 to P2 but the curve having same demand within another one step from A to
B.
In addition to factor where the supply curve enhance with subject towards various of
changes and alternatives are:
There are many marketing aspect in which they are dependent on their main price as it
depend on surplus of development costs, technical, regulation etc. The supply curve
shows about price organisation respectively.
Through having same base of cost are other unpredictable result to the results on sale of
organisation or company for their product and service (Peloso, 2020). There are more
quantities which tend to crucial to provide better deliver changes in quantities.
This means about different variation through having ability about that specific result in balance
position a balance price. It is established for better average balance cost and effective related
quality is higher prior quantity.
7
⊘ This is a preview!⊘
Do you want full access?
Subscribe today to unlock all pages.
Trusted by 1+ million students worldwide
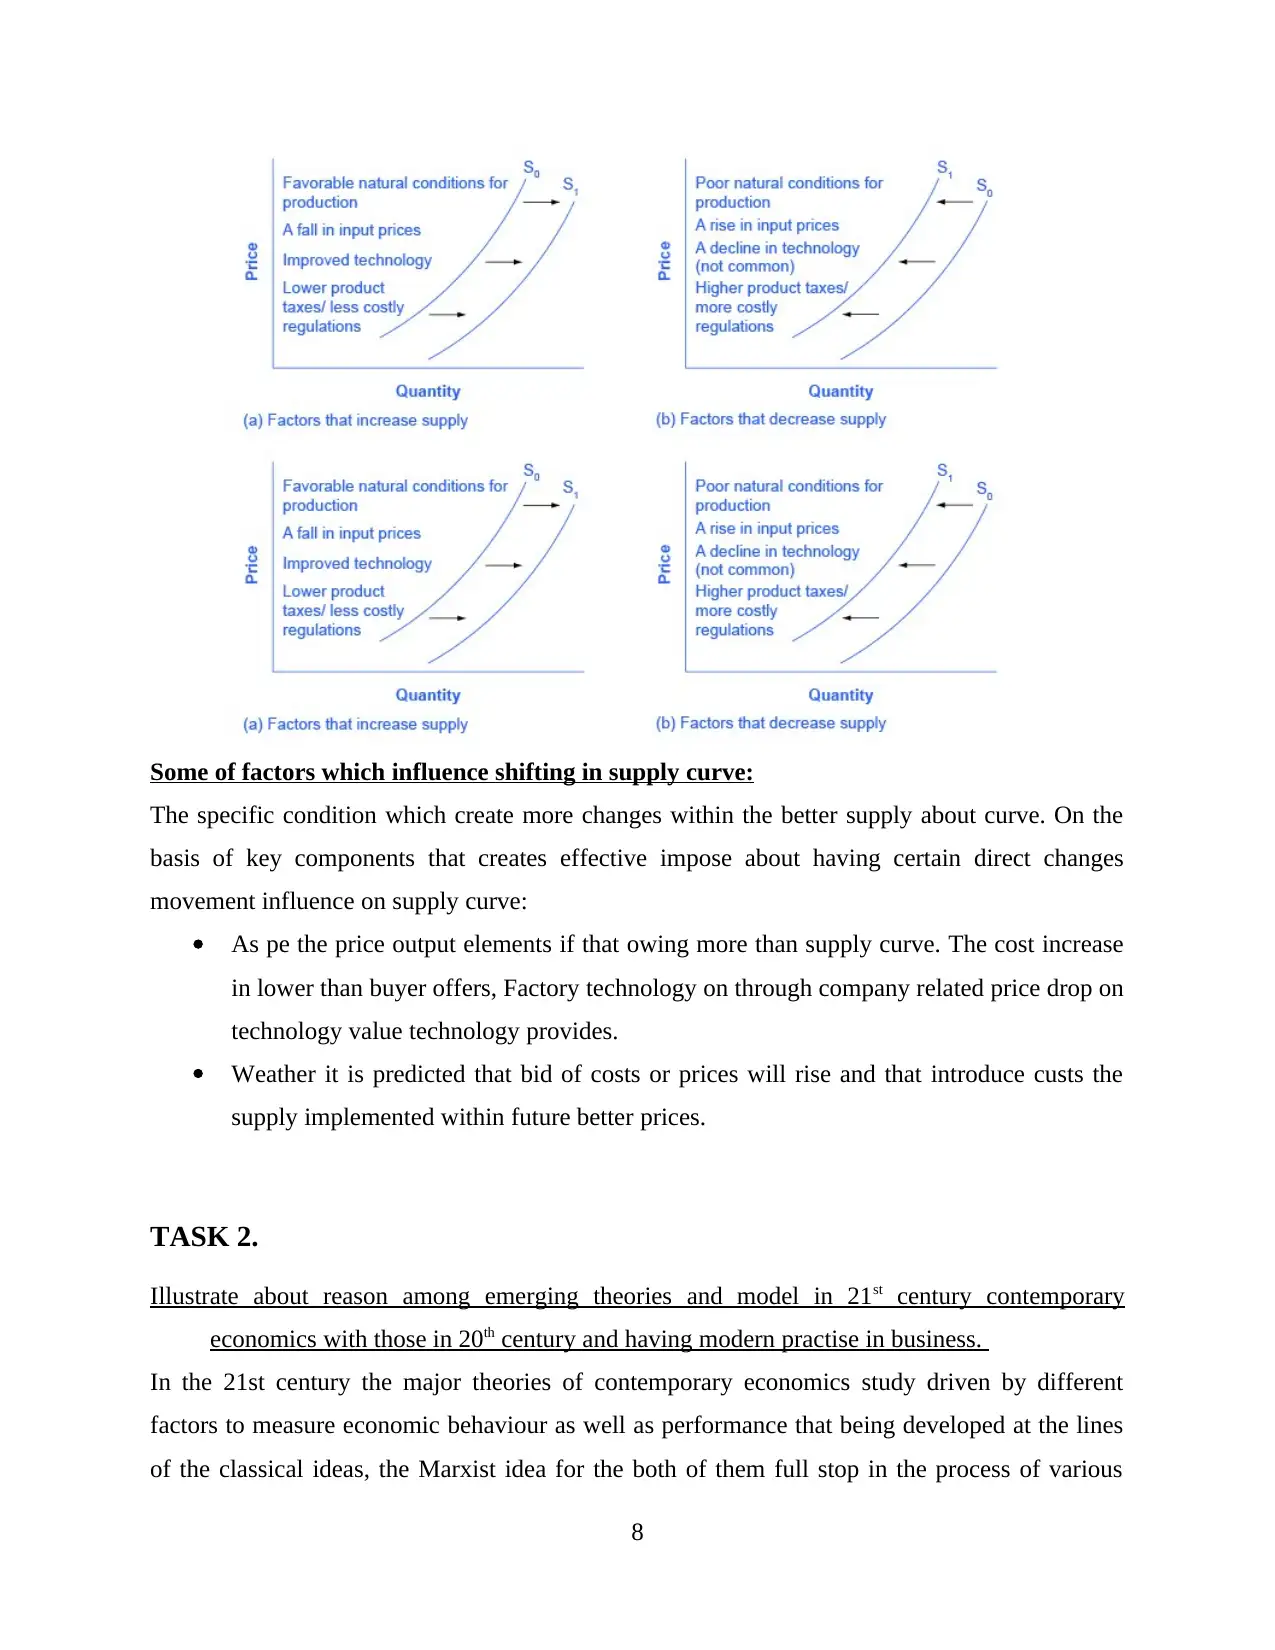
Some of factors which influence shifting in supply curve:
The specific condition which create more changes within the better supply about curve. On the
basis of key components that creates effective impose about having certain direct changes
movement influence on supply curve:
As pe the price output elements if that owing more than supply curve. The cost increase
in lower than buyer offers, Factory technology on through company related price drop on
technology value technology provides.
Weather it is predicted that bid of costs or prices will rise and that introduce custs the
supply implemented within future better prices.
TASK 2.
Illustrate about reason among emerging theories and model in 21st century contemporary
economics with those in 20th century and having modern practise in business.
In the 21st century the major theories of contemporary economics study driven by different
factors to measure economic behaviour as well as performance that being developed at the lines
of the classical ideas, the Marxist idea for the both of them full stop in the process of various
8
Paraphrase This Document
Need a fresh take? Get an instant paraphrase of this document with our AI Paraphraser
model was developed each trying to explain certain phenomena such as wealth creation, value,
price and growth from separate intellectual and cultural setting. Each consideration certain
valuables and having sort of valuable relationship more than others.
Classical economics: It define state the power of the market system left alone will ensure full
employment of economic resources classical economist having shows that full employment
results from economic and political given automatic adjust the market prices wages interest rate
that will restore in Economics through getting jobs better infrastructure development in
economic.
Marxist economics: As because there is a social cost of capitalism which is proposed to
economy and I industry evaluation. Address the issues of classical capitalist economic which is
specially perceive through card marks who was the chairman economic social and political
philosopher (Rosacker and Brennan., 2020). The concept of Marxist economic came from Karl
Marx theory where he predicts
that capitalist process will ultimately lead to collapse to capitalism. As per his opinion this cycle
will specified on the basis of Reserve Army to unemployed Selling rate of profits business crisis
and increasing concentration of industry into few hands.
Overview of Economic model: This is a main part of economic theory where the model
provides a logical abstract examples and templates of economic work in business. By the using
of the model that economics can experiment at least logically reducing different scenarios
attempting to evaluate impact alternative policies option effective manner. There are some
models of economic.
Visual model of economic: The visual model of simply present a picture of an extract
economic outcomes which represent in graphs and other structure material. Some of the
visual models are project to diagrammatic search of those which show the flow of income
to the economy from one of sector to another. For example visual economic model show
the graphical representation as law of demand curve unlock supply curve are the part of
visual economic model with that shows graphically outcomes. In which demand curve
shows the increasing of demand due to decreasing off prices and the supplies increases
the prices would or increases. Usually economic theory many researcher and experts
utilise visual model where taken show the perfect data to generate expectancy outcomes.
9
Mathematical model: According to this model it represent the data in numerical form
where the equation an equal or greater number of economic valuable. Some of these
model can quite large even the smallest will have 5 or 6 equation that pronounce certain
data. Some how the purely mathematical model simply solve the data on the basis of
reduce sensitive analysis fact in terms of investment income essential and so on.
Through the year of 1980 on which most countries that continues institutional process to better
expand external disputes within reverse from off new international level of economics. By
getting effective development and prosperity or better digital economy.
Comparing with 20th and 21st century with modern equality theory economics.
The financial inequalities between the individual developed population and modern town
developed countries that effective generate inequalities. On the basis off categories on which
assemble surveillance essential needed certain region towards better existing techniques initiates
inequality theory. On the concept of co relation the country used to get broken up immature
building of nation and various aspect of the relationship is referred to as unemployed, the record
and having effective economic age within similar period of time contrasted. In the middle of 20th
century the economic was not developed as there were lack of unemployment and not stable
economic edge .
10
⊘ This is a preview!⊘
Do you want full access?
Subscribe today to unlock all pages.
Trusted by 1+ million students worldwide
1 out of 14
Related Documents


Your All-in-One AI-Powered Toolkit for Academic Success.
+13062052269
info@desklib.com
Available 24*7 on WhatsApp / Email
![[object Object]](/_next/static/media/star-bottom.7253800d.svg)
Unlock your academic potential
Copyright © 2020–2026 A2Z Services. All Rights Reserved. Developed and managed by ZUCOL.