Analysis of Demand and Supply for Nordic Bridge Services Case Study
VerifiedAdded on 2020/05/04
|9
|2279
|186
Case Study
AI Summary
This case study examines the demand and supply dynamics of the Nordic Bridge services. Part A analyzes the market structure, identifying it as an oligopoly with a downward-sloping demand curve influenced by price. Part B explores non-price factors affecting demand, such as substitute prices and traffic conditions, causing shifts in the demand curve. Part C focuses on price elasticity of demand (PED), calculating the impact of a price reduction on revenue and demonstrating that the demand for bridge services is relatively inelastic. The analysis uses figures to illustrate the demand curve, non-price determinants, and elasticity, concluding that a price cut may not necessarily increase revenue due to inelastic demand. The paper references various economic sources to support its arguments.
Running Head: Demand and Supply Analysis
Demand and Supply of Nordic Bridge Services
Student Name
Institutional Affiliation
Course/Number
Instructor Name
Due Date
Demand and Supply of Nordic Bridge Services
Student Name
Institutional Affiliation
Course/Number
Instructor Name
Due Date
Paraphrase This Document
Need a fresh take? Get an instant paraphrase of this document with our AI Paraphraser
Demand and Supply Analysis 2
Demand and Supply of Nordic Bridge Services
Part A
This case study clearly notes that there are many passengers who are demanding to use
the Nordic bridge. The high traffic recorded on a one way from Sweden to Denmark indicates
that there is high competition for the bridge services. This makes the demand side by considered
to be perfect competitive. On the other side, the supply side is not perfectly competitive; this is
because there are fewer means of transportation from Sweden to Denmark. The case study notes
that the suppliers are directly cutting the price meaning that they are price makers; the price is
not resulting from the interaction between demand and supply forces. A person moving from
either Sweden to Denmark or vice versa have four main means of transport; could use the bridge,
the train, ferry or the air means. The train and ferry services are the most commonly used means
of transport because they are cheaper; the other two means are way expensive. One disadvantage
of the cheaper means is that they are way slower compared to the expensive means. The supply
side of this market therefore operates under an oligopoly market structure where the suppliers are
few but the consumers are many.
The main reason why the demand curve for Nordic Bridge services is downward sloping
is because demand is influenced by the price level; the two has a negative relationship (Anand,
2017). For normal goods or services, the demand curve is downward sloping because consumers’
willingness and ability to pay is lower when the prices are high. On the other hand, the
consumers’ willingness and ability to pay is higher when prices are lower. This therefore means
that when price rises, demand falls, and when price falls, demand rises. This negative
relationship between price and demand of goods and services is represented in the downward
sloping demand curve. This case study explains that the high price on the bridge is responsible
for the reduced number of vehicles using the bridge. It also tell that a reduction in this price will
result in an increased demand for the bridge services; the number of vehicles will rise.
When the bridge was constructed, the demand was very high and the suppliers assumed
that the demand would remain high at the set price level. However this is a wrong assumption
because if the price set was very high, demand in the short run could have been higher because
of the convenience expected to be derived from using the bridge. However in the long run,
households and business investors will adjust so as to minimize their usage of the bridge so as to
avoid the higher costs (Bhaskaran, 2017). The suppliers thinks that definitely the demand for the
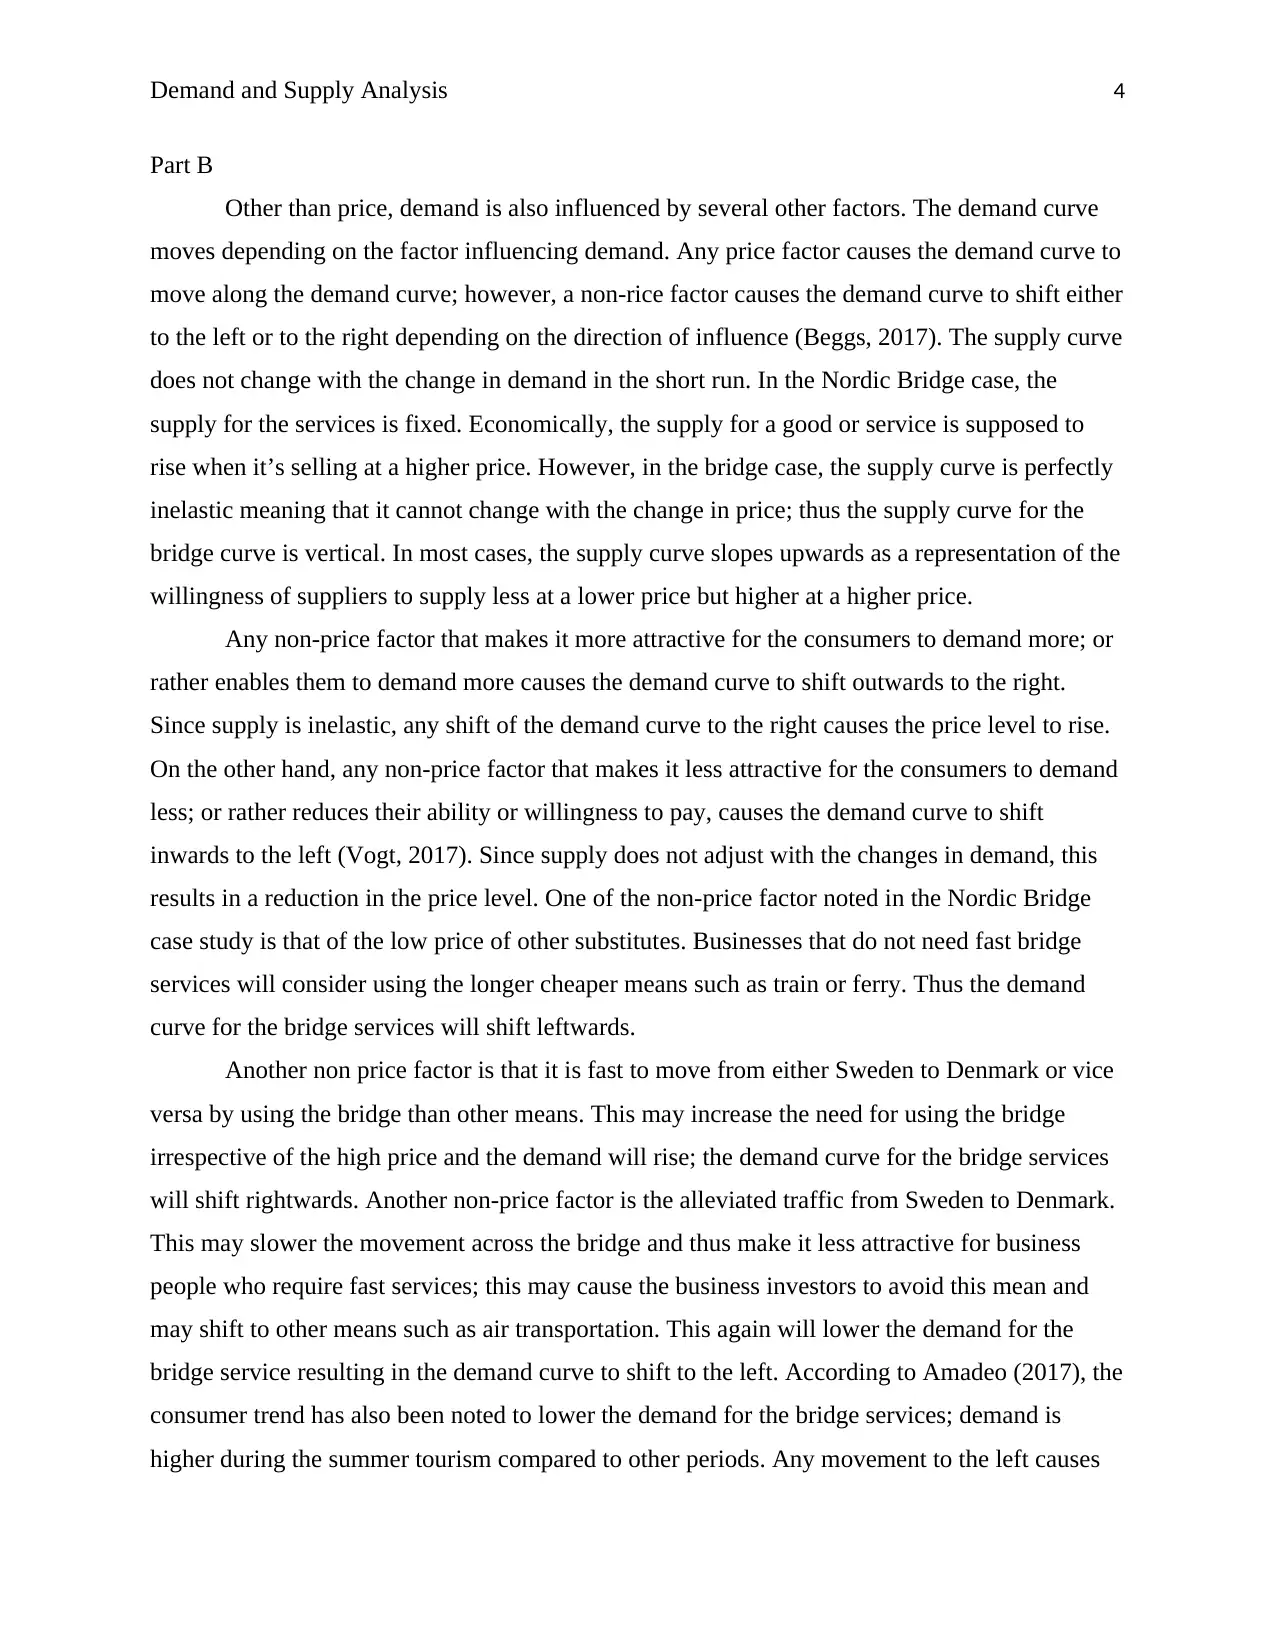
Demand and Supply Analysis 3
bridge services will rise when price is cut, however, this may not be the case. Sometimes a price
cut does not result in a significant rise in demand depending on the nature of the good or service.
The suppliers are also making a wrong assumption by thinking that they could price discriminate
a service is the same market. A cut in one way price from Singapore to Denmark will create high
pressure for the price from Denmark to Sweden to be cut too. Thus, it won’t help in lowering
traffic as expected.
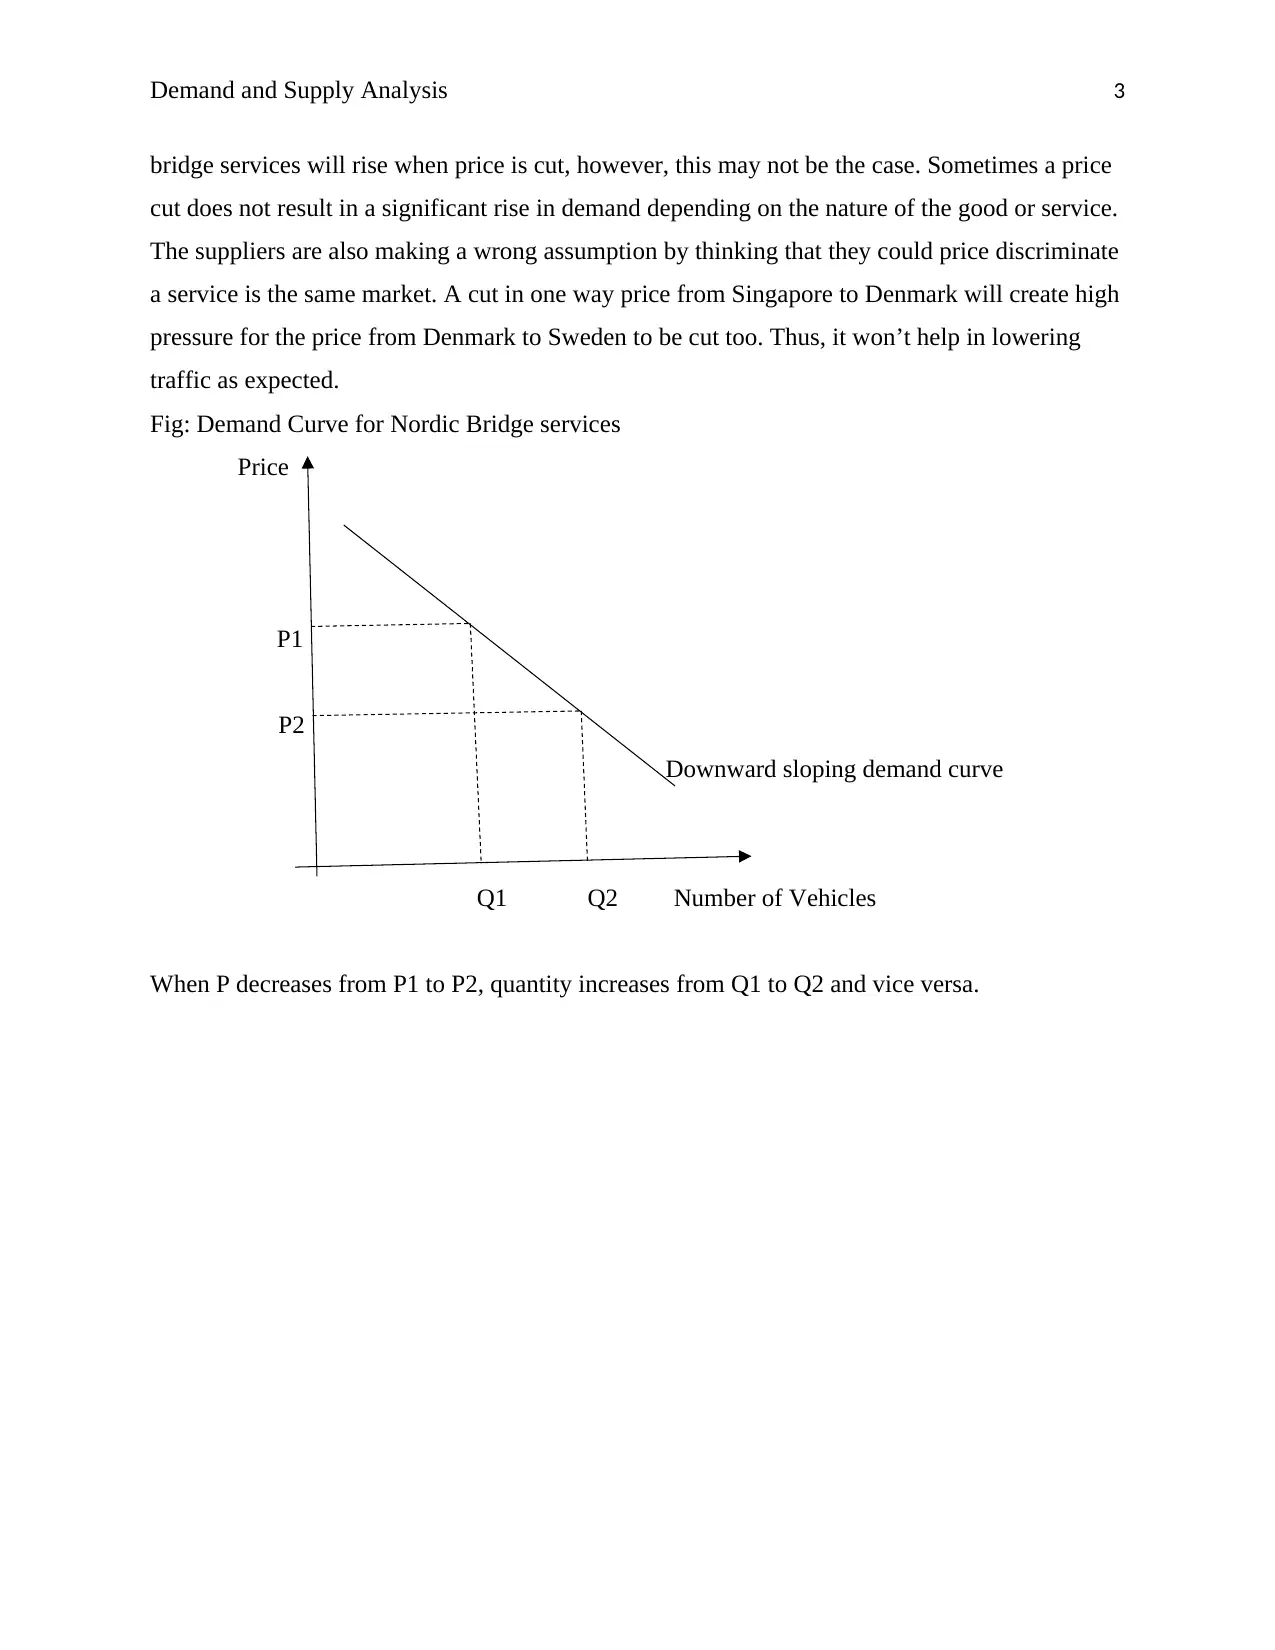
Fig: Demand Curve for Nordic Bridge services
Price
P1
P2
Downward sloping demand curve
Q1 Q2 Number of Vehicles
When P decreases from P1 to P2, quantity increases from Q1 to Q2 and vice versa.
bridge services will rise when price is cut, however, this may not be the case. Sometimes a price
cut does not result in a significant rise in demand depending on the nature of the good or service.
The suppliers are also making a wrong assumption by thinking that they could price discriminate
a service is the same market. A cut in one way price from Singapore to Denmark will create high
pressure for the price from Denmark to Sweden to be cut too. Thus, it won’t help in lowering
traffic as expected.
Fig: Demand Curve for Nordic Bridge services
Price
P1
P2
Downward sloping demand curve
Q1 Q2 Number of Vehicles
When P decreases from P1 to P2, quantity increases from Q1 to Q2 and vice versa.
⊘ This is a preview!⊘
Do you want full access?
Subscribe today to unlock all pages.
Trusted by 1+ million students worldwide
Demand and Supply Analysis 4
Part B
Other than price, demand is also influenced by several other factors. The demand curve
moves depending on the factor influencing demand. Any price factor causes the demand curve to
move along the demand curve; however, a non-rice factor causes the demand curve to shift either
to the left or to the right depending on the direction of influence (Beggs, 2017). The supply curve
does not change with the change in demand in the short run. In the Nordic Bridge case, the
supply for the services is fixed. Economically, the supply for a good or service is supposed to
rise when it’s selling at a higher price. However, in the bridge case, the supply curve is perfectly
inelastic meaning that it cannot change with the change in price; thus the supply curve for the
bridge curve is vertical. In most cases, the supply curve slopes upwards as a representation of the
willingness of suppliers to supply less at a lower price but higher at a higher price.
Any non-price factor that makes it more attractive for the consumers to demand more; or
rather enables them to demand more causes the demand curve to shift outwards to the right.
Since supply is inelastic, any shift of the demand curve to the right causes the price level to rise.
On the other hand, any non-price factor that makes it less attractive for the consumers to demand
less; or rather reduces their ability or willingness to pay, causes the demand curve to shift
inwards to the left (Vogt, 2017). Since supply does not adjust with the changes in demand, this
results in a reduction in the price level. One of the non-price factor noted in the Nordic Bridge
case study is that of the low price of other substitutes. Businesses that do not need fast bridge
services will consider using the longer cheaper means such as train or ferry. Thus the demand
curve for the bridge services will shift leftwards.
Another non price factor is that it is fast to move from either Sweden to Denmark or vice
versa by using the bridge than other means. This may increase the need for using the bridge
irrespective of the high price and the demand will rise; the demand curve for the bridge services
will shift rightwards. Another non-price factor is the alleviated traffic from Sweden to Denmark.
This may slower the movement across the bridge and thus make it less attractive for business
people who require fast services; this may cause the business investors to avoid this mean and
may shift to other means such as air transportation. This again will lower the demand for the
bridge service resulting in the demand curve to shift to the left. According to Amadeo (2017), the
consumer trend has also been noted to lower the demand for the bridge services; demand is
higher during the summer tourism compared to other periods. Any movement to the left causes
Paraphrase This Document
Need a fresh take? Get an instant paraphrase of this document with our AI Paraphraser
Demand and Supply Analysis 5
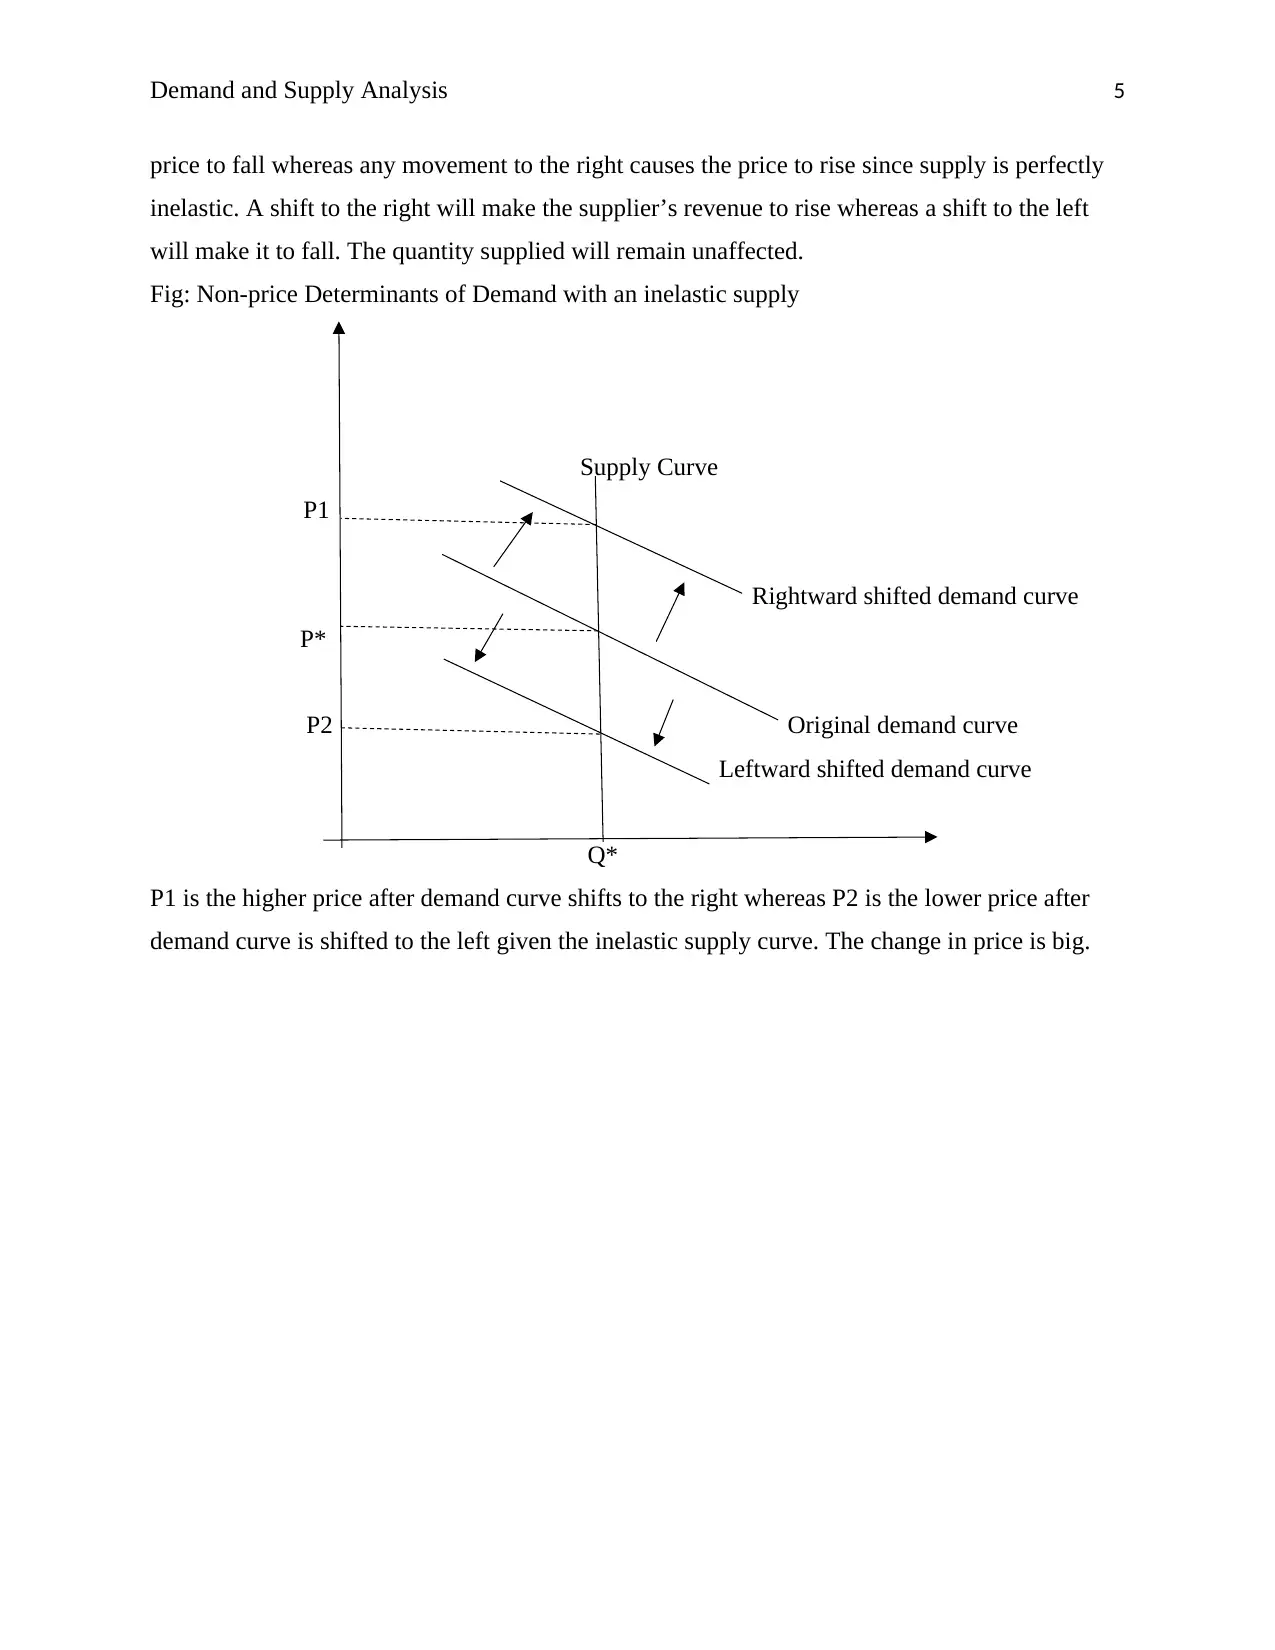
price to fall whereas any movement to the right causes the price to rise since supply is perfectly
inelastic. A shift to the right will make the supplier’s revenue to rise whereas a shift to the left
will make it to fall. The quantity supplied will remain unaffected.
Fig: Non-price Determinants of Demand with an inelastic supply
Supply Curve
P1
Rightward shifted demand curve
P*
P2 Original demand curve
Leftward shifted demand curve
Q*
P1 is the higher price after demand curve shifts to the right whereas P2 is the lower price after
demand curve is shifted to the left given the inelastic supply curve. The change in price is big.
Demand and Supply Analysis 6
Part C
Price elasticity of demand helps in explain the behavior of all the customers towards a
change in the price level (Graham, 2017). Elasticity is determined whether price is lowered of is
raised. Depending on the nature of goods or services, a reduction in price results either in a small
or a big increase in the quantity demanded (Sparknotes.com, 2017). Similarly, an increase in
prices results in a small or a big decrease in the quantity demanded. An increase in demand can
cause to effects on the total revenue, one it can increase revenue even if the product or service is
selling at a lower price or two, it can result in a decreased revenue. Thus the increase in demand
does not guarantee the supplier an increased revenue in all the cases because the supplier has
already lowered the price level so as to stimulate the increase in demand. Revenue increase is
only guaranteed when demand is increased from the result on an influence by a non-price factor.
However, the magnitude of change in demand determines whether the supplier is going to raise
more or lower revenue from selling at a lower price (Hill, 2017). This magnitude of change is the
one explained by the price elasticity of demand (PED).
Since most consumers are avoiding the consumption of bridge services due to higher
prices, it can be argue that a price reduction will stimulate an additional use of the bridge
services. Many people would argue that if one wants to increase revenue, price have to be raised;
however, this is not always the case as it may even make the supplier worse off. In some cases,
price have to be cut so as to increase revenue (Krugman & Wells, 2012). A change in price have
both a price and quantity effect depending on the elasticity of demand. Ebel & Petersen (2012)
argued that only the variable costs of the bridge should be charges to the consumers of this
service because it is a public service meant to benefit many people; the capital cost should be
taxed by raising the national tax. The demand for bridge services is relatively inelastic to
charges, meaning that there are several other alternatives that raise vertical equity concerns.
Literature has confirmed that citizens are relatively responsive to toll charges on bridges, roads
and tunnels. In the U.S. the PED ranges from -0.10 to -0.50. A meta-analysis of the short run
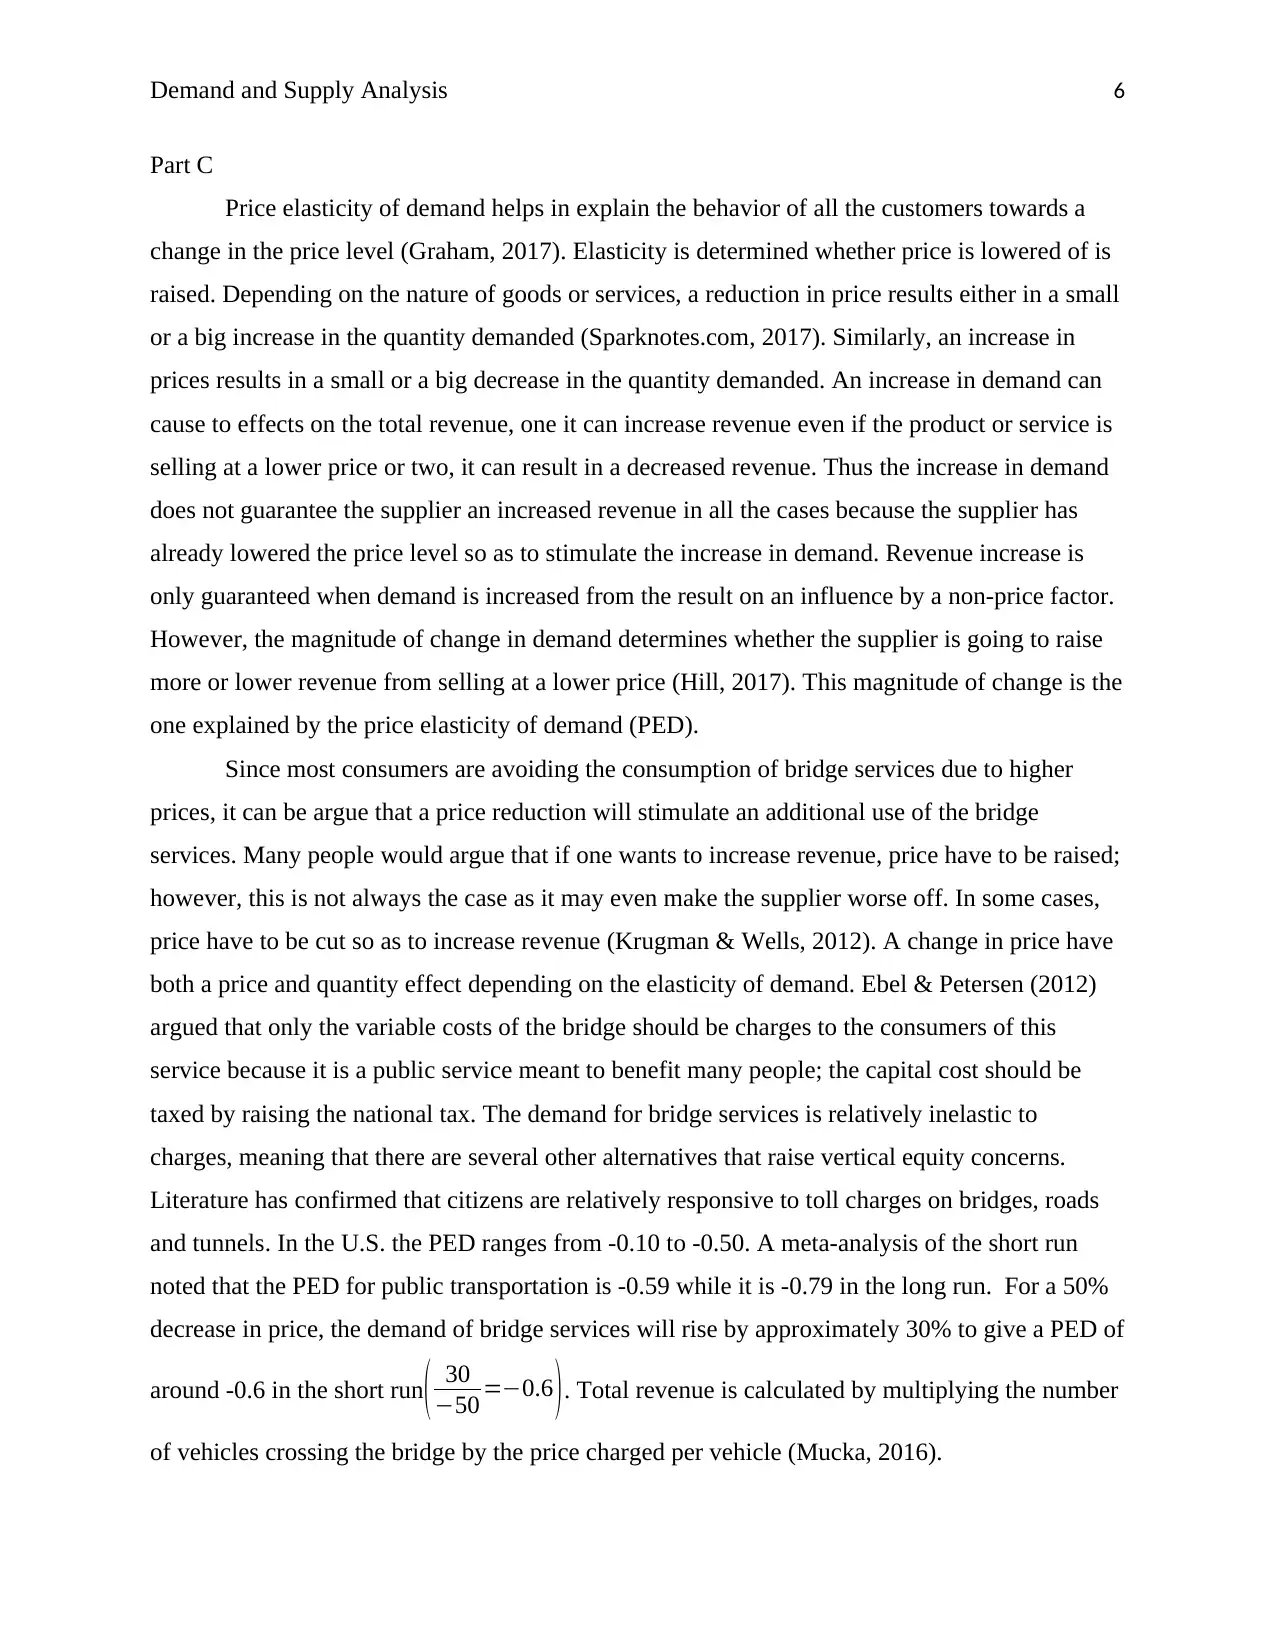
noted that the PED for public transportation is -0.59 while it is -0.79 in the long run. For a 50%
decrease in price, the demand of bridge services will rise by approximately 30% to give a PED of
around -0.6 in the short run( 30
−50 =−0.6 ). Total revenue is calculated by multiplying the number
of vehicles crossing the bridge by the price charged per vehicle (Mucka, 2016).
Part C
Price elasticity of demand helps in explain the behavior of all the customers towards a
change in the price level (Graham, 2017). Elasticity is determined whether price is lowered of is
raised. Depending on the nature of goods or services, a reduction in price results either in a small
or a big increase in the quantity demanded (Sparknotes.com, 2017). Similarly, an increase in
prices results in a small or a big decrease in the quantity demanded. An increase in demand can
cause to effects on the total revenue, one it can increase revenue even if the product or service is
selling at a lower price or two, it can result in a decreased revenue. Thus the increase in demand
does not guarantee the supplier an increased revenue in all the cases because the supplier has
already lowered the price level so as to stimulate the increase in demand. Revenue increase is
only guaranteed when demand is increased from the result on an influence by a non-price factor.
However, the magnitude of change in demand determines whether the supplier is going to raise
more or lower revenue from selling at a lower price (Hill, 2017). This magnitude of change is the
one explained by the price elasticity of demand (PED).
Since most consumers are avoiding the consumption of bridge services due to higher
prices, it can be argue that a price reduction will stimulate an additional use of the bridge
services. Many people would argue that if one wants to increase revenue, price have to be raised;
however, this is not always the case as it may even make the supplier worse off. In some cases,
price have to be cut so as to increase revenue (Krugman & Wells, 2012). A change in price have
both a price and quantity effect depending on the elasticity of demand. Ebel & Petersen (2012)
argued that only the variable costs of the bridge should be charges to the consumers of this
service because it is a public service meant to benefit many people; the capital cost should be
taxed by raising the national tax. The demand for bridge services is relatively inelastic to
charges, meaning that there are several other alternatives that raise vertical equity concerns.
Literature has confirmed that citizens are relatively responsive to toll charges on bridges, roads
and tunnels. In the U.S. the PED ranges from -0.10 to -0.50. A meta-analysis of the short run
noted that the PED for public transportation is -0.59 while it is -0.79 in the long run. For a 50%
decrease in price, the demand of bridge services will rise by approximately 30% to give a PED of
around -0.6 in the short run( 30
−50 =−0.6 ). Total revenue is calculated by multiplying the number
of vehicles crossing the bridge by the price charged per vehicle (Mucka, 2016).
⊘ This is a preview!⊘
Do you want full access?
Subscribe today to unlock all pages.
Trusted by 1+ million students worldwide
Demand and Supply Analysis 7
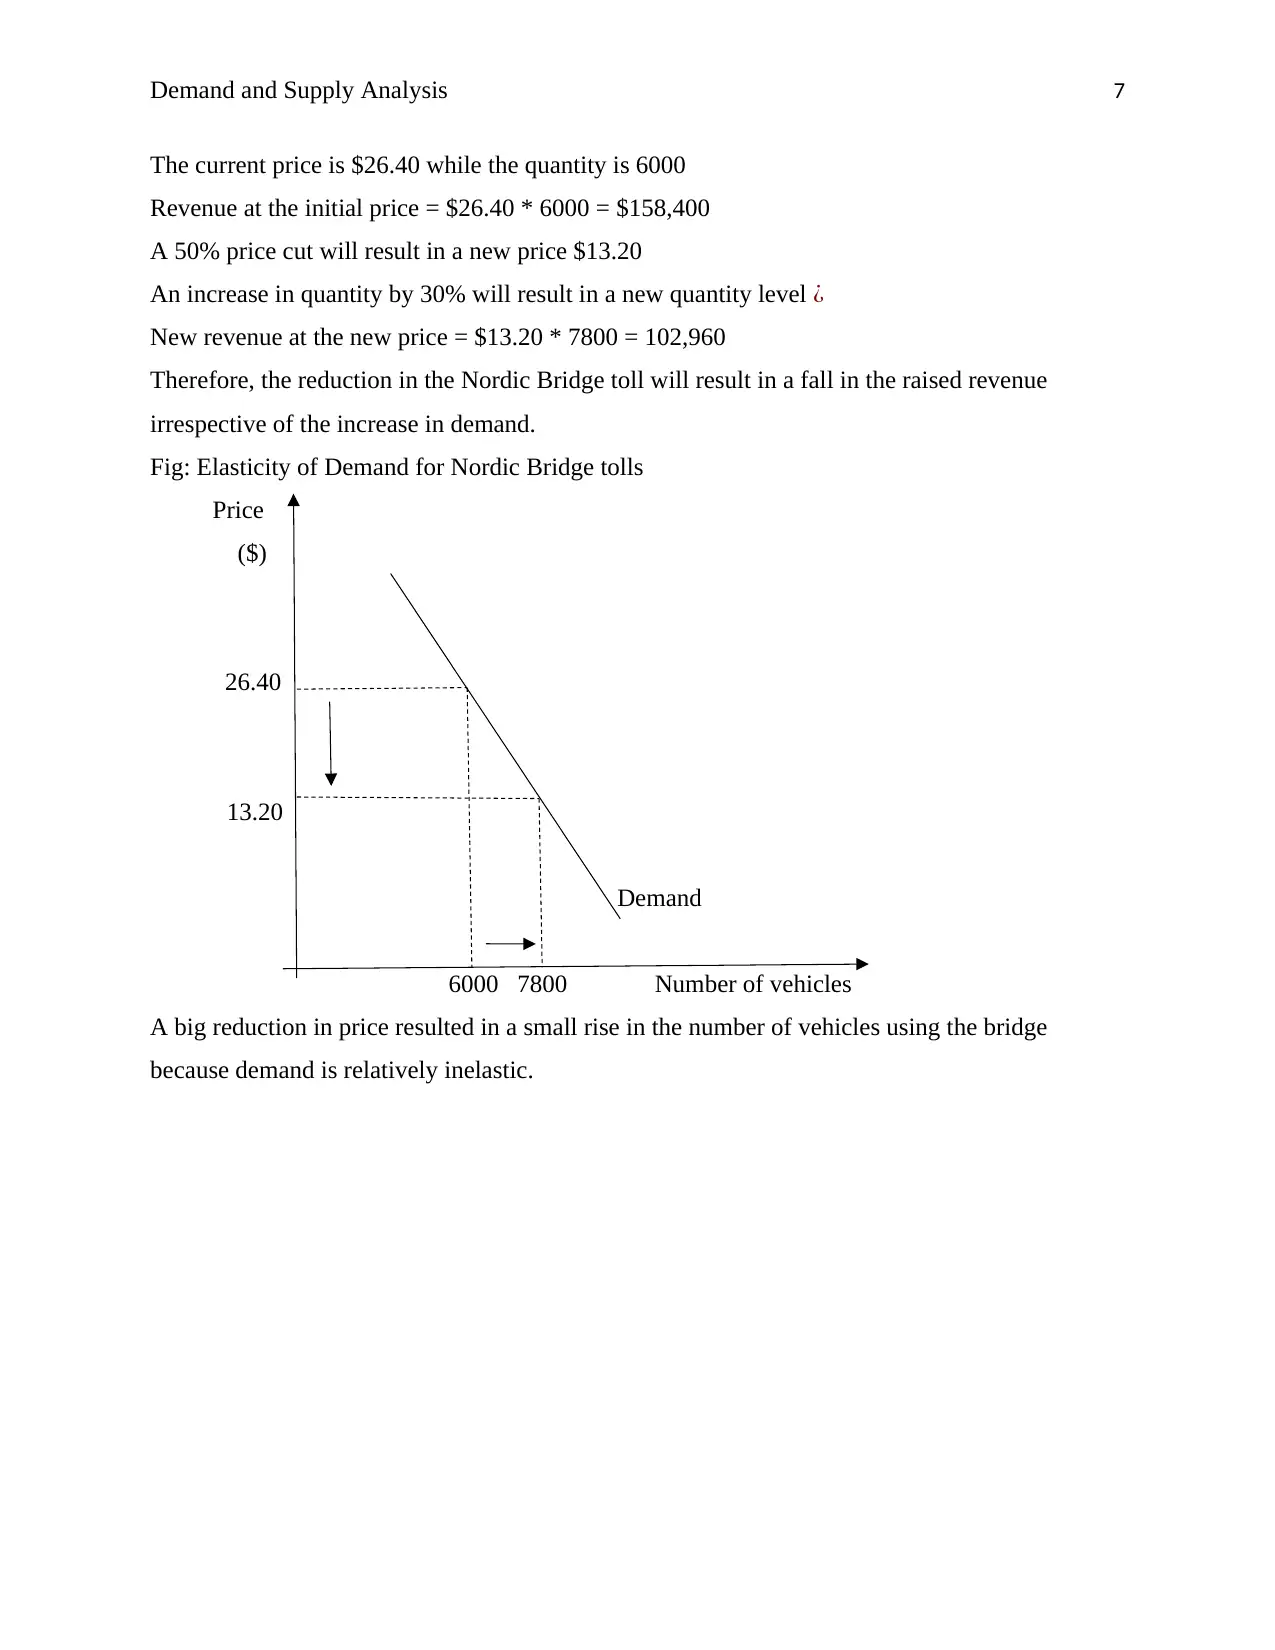
The current price is $26.40 while the quantity is 6000
Revenue at the initial price = $26.40 * 6000 = $158,400
A 50% price cut will result in a new price $13.20
An increase in quantity by 30% will result in a new quantity level ¿
New revenue at the new price = $13.20 * 7800 = 102,960
Therefore, the reduction in the Nordic Bridge toll will result in a fall in the raised revenue
irrespective of the increase in demand.
Fig: Elasticity of Demand for Nordic Bridge tolls
Price
($)
26.40
13.20
Demand
6000 7800 Number of vehicles
A big reduction in price resulted in a small rise in the number of vehicles using the bridge
because demand is relatively inelastic.
Paraphrase This Document
Need a fresh take? Get an instant paraphrase of this document with our AI Paraphraser
Demand and Supply Analysis 8
References
Amadeo, K. (2017). Shift in Demand Curve: When Price Doesn't Matter. The Balance. Retrieved
21 October 2017, from https://www.thebalance.com/shift-in-demand-curve-when-price-
doesn-t-matter-3305720.
Anand, M. (2017). Demand & Supply |Demand |Price Elasticity of Demand. Scribd. Retrieved
21 October 2017, from https://www.scribd.com/document/106778050/Demand-Supply.
Beggs, J. (2017). Shifting the Demand Curve. ThoughtCo. Retrieved 22 October 2017, from
https://www.thoughtco.com/shifting-the-demand-curve-1146961.
Bhaskaran, S. (2017). ECONOMICS. Scribd. Retrieved 21 October 2017, from
https://www.scribd.com/document/123638739/ECONOMICS.
Ebel, D. & Petersen, E. (2012). The Oxford handbook of state and local government finance.
New York: Oxford University Press.
Graham, R. (2017). How to Determine the Price Elasticity of Demand. Dummies. Retrieved 21
October 2017, from http://www.dummies.com/education/economics/how-to-determine-
the-price-elasticity-of-demand/.
Hill, A. (2017). Price Elasticity of Demand in Microeconomics. Study.com. Retrieved 21 October
2017, from http://study.com/academy/lesson/price-elasticity-of-demand-in-
microeconomics.html.
Krugman, P. & Wells, R. (2012). CourseSmart E-Book for Economics: A PDF-style E-Book.
Palgrave Macmillan.
Mucka, S. (2016). Price Elasticity of Demand and Its Effect on Revenue. [S.L.], Grin Publishing.
Sparknotes.com. (2017). Elasticity. Sparknotes.com. Retrieved 21 October 2017, from
http://www.sparknotes.com/economics/micro/elasticity/section1.rhtml.
Vogt, C. (2017). Shifting the Demand Curve vs. Moving Along the Demand Curve.
Smallbusiness.chron.com. Retrieved 21 October 2017, from
http://smallbusiness.chron.com/shifting-demand-curve-vs-moving-along-demand-curve-
31926.html.

Demand and Supply Analysis 9
⊘ This is a preview!⊘
Do you want full access?
Subscribe today to unlock all pages.
Trusted by 1+ million students worldwide
1 out of 9
Related Documents


Your All-in-One AI-Powered Toolkit for Academic Success.
+13062052269
info@desklib.com
Available 24*7 on WhatsApp / Email
![[object Object]](/_next/static/media/star-bottom.7253800d.svg)
Unlock your academic potential
Copyright © 2020–2026 A2Z Services. All Rights Reserved. Developed and managed by ZUCOL.