BM533 - Economic Analysis: Demand, Supply, and Economic Models
VerifiedAdded on 2023/06/10
|14
|3136
|57
Report
AI Summary
This report provides a detailed analysis of microeconomic concepts, focusing on the laws of demand and supply in the context of Tesco Plc. It explores the movement and shifts in demand and supply curves, identifying factors that cause these changes. The report includes diagrams to illustrate these concepts. Furthermore, it compares and contrasts economic models from the 20th and 21st centuries, linking them to modern business practices. The analysis covers Adam Smith's economic theory and international trade practices, highlighting the role of manpower, labor, and government intervention in the market. The report concludes by summarizing the key findings and their implications for understanding economic behavior in contemporary business environments.
BM533 Contemporary
Economic Analysis
Economic Analysis
Paraphrase This Document
Need a fresh take? Get an instant paraphrase of this document with our AI Paraphraser
Contents
INTRODUCTION.................................................................................................................................3
TASK 1.................................................................................................................................................3
State the Law of demand and also discuss the movement along the demand curve and changes in
the demand curve with the elements that have impact on them. Use appropriate diagram................3
Explain the law of supply, also elaborate the movement and shift along with the supply curve with
the help of suitable diagrams.............................................................................................................7
TASK 2...............................................................................................................................................11
Choose two merging models of 21st century contemporary economics and two models f 20th
century. Give a comparison and contrast and relate both of the concepts with the modern business
practices...........................................................................................................................................11
CONCLUSION...................................................................................................................................13
References...........................................................................................................................................14
INTRODUCTION
The following report looks into the microeconomic concepts in relation to the food
and grocery store named Tesco Plc. The upcoming report highlights the notions n law of
demand supply. Furthermore, it also encompasses on the theory of movement and shifts in
the demand and supply curves along with the help of suitable table and charts. The report also
presents the components that causes the changes in the demand and supply curve.
Furthermore, it also discusses on the 20 and 21st century theory and their link in the modern
business practices and protocols. The report will comprise of the various graphs that will help
in the analyzation and interpretation of the variations in the demand and supply schedule and
curve.
TASK 1
State the Law of demand and also discuss the movement along the demand curve and
changes in the demand curve with the elements that have impact on them. Use appropriate
diagram.
Demand is the desire of the customer to purchase the product and services and the
willingness to pay for the particular good or service.
The law of demand is the fundamental concept in the economics. This law reflects the
negative relationship between the price and quantity demanded. It tells that keeping other
components unchanged, if the price of the commodity changes, the quantity demanded for
that specific good will also change. Law of Demand in Tesco Plc states that, there is an
inverse relationship between the price and quantity. If the price of commodity rises, then the
demand will decrease; but if the price falls, then the demand will increase. The law of
demand is operated by the two main components. They are the demand schedule and demand
curve (Castillo-Vergara and et.al., 2018). The demand schedule tells the Tesco Plc in the
appropriate evaluation of the quantity that a consumer will buy at the given level of price and
the demand curve is that which allots those points on charts.
⊘ This is a preview!⊘
Do you want full access?
Subscribe today to unlock all pages.
Trusted by 1+ million students worldwide
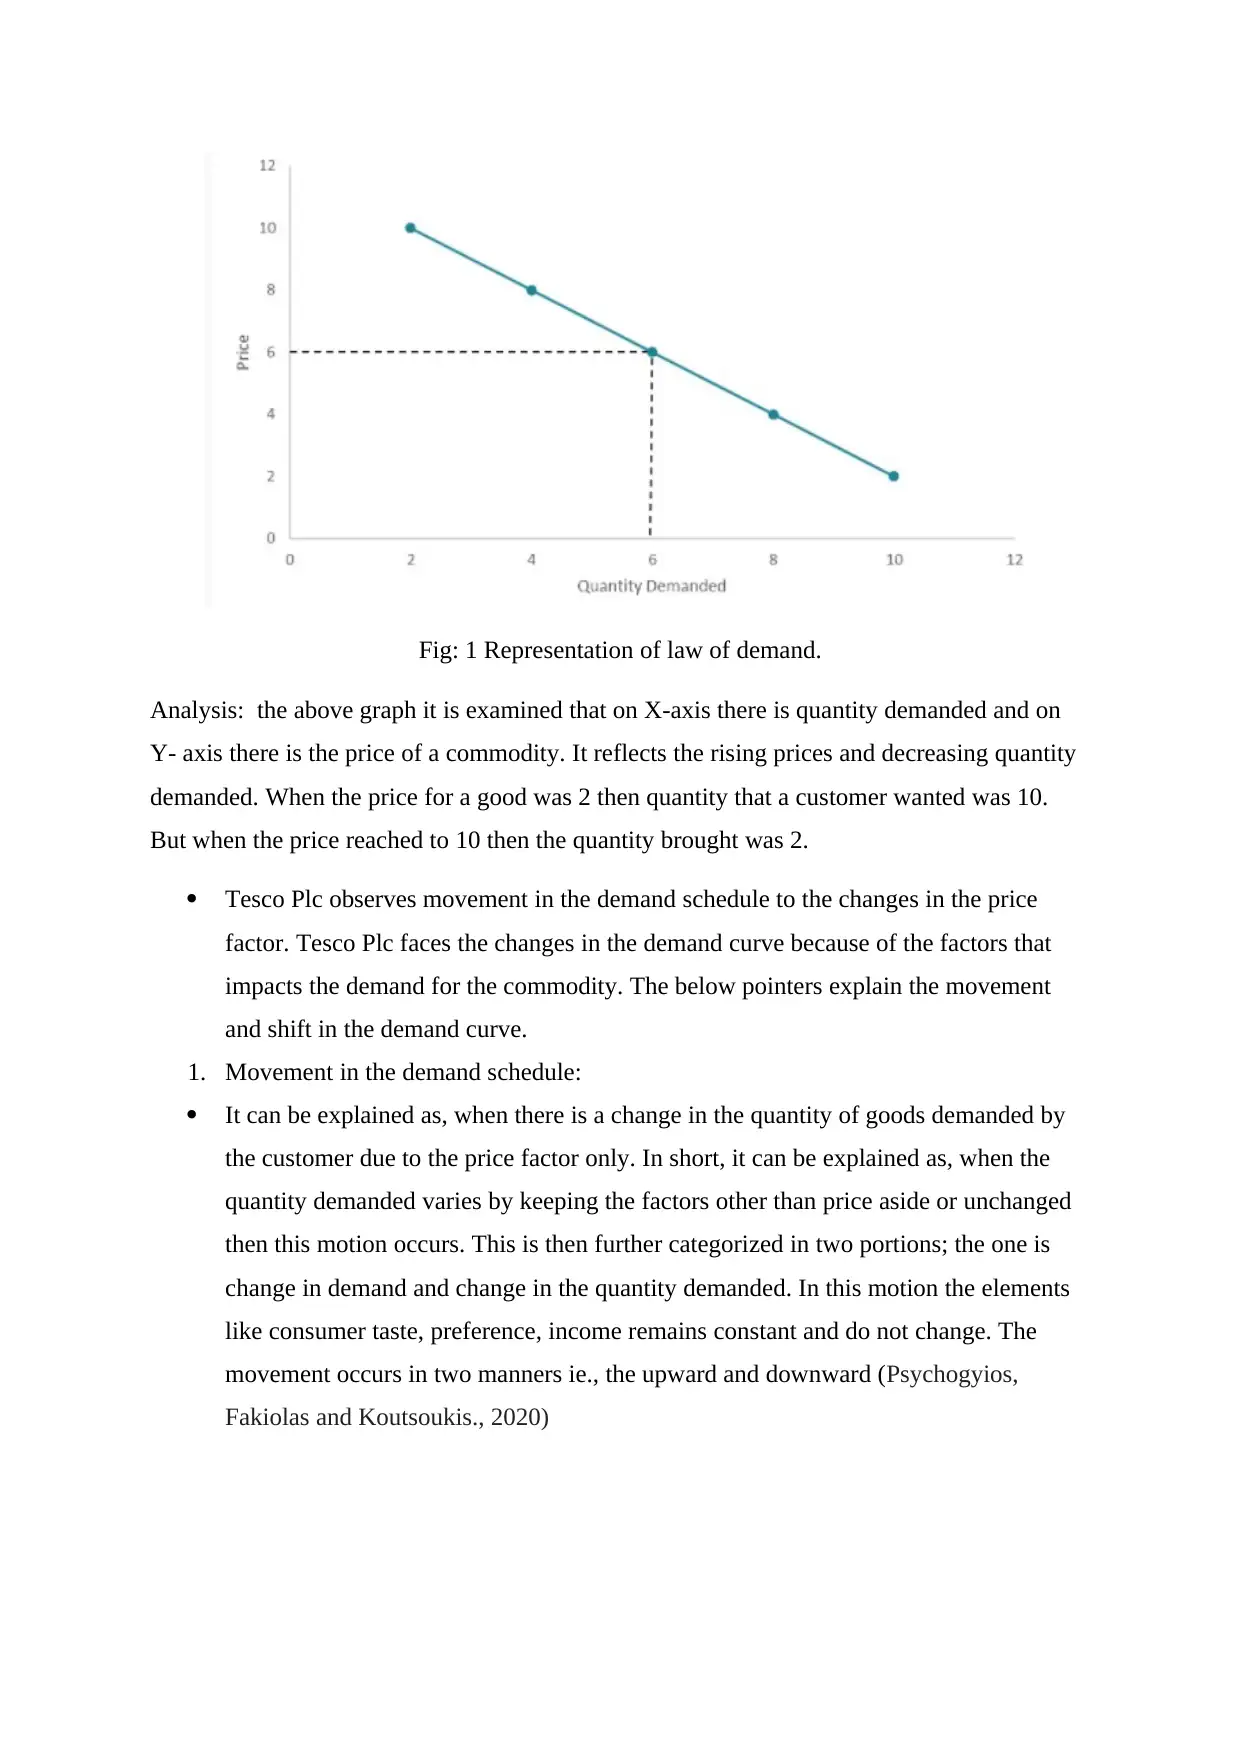
Fig: 1 Representation of law of demand.
Analysis: the above graph it is examined that on X-axis there is quantity demanded and on
Y- axis there is the price of a commodity. It reflects the rising prices and decreasing quantity
demanded. When the price for a good was 2 then quantity that a customer wanted was 10.
But when the price reached to 10 then the quantity brought was 2.
Tesco Plc observes movement in the demand schedule to the changes in the price
factor. Tesco Plc faces the changes in the demand curve because of the factors that
impacts the demand for the commodity. The below pointers explain the movement
and shift in the demand curve.
1. Movement in the demand schedule:
It can be explained as, when there is a change in the quantity of goods demanded by
the customer due to the price factor only. In short, it can be explained as, when the
quantity demanded varies by keeping the factors other than price aside or unchanged
then this motion occurs. This is then further categorized in two portions; the one is
change in demand and change in the quantity demanded. In this motion the elements
like consumer taste, preference, income remains constant and do not change. The
movement occurs in two manners ie., the upward and downward (Psychogyios,
Fakiolas and Koutsoukis., 2020)
Paraphrase This Document
Need a fresh take? Get an instant paraphrase of this document with our AI Paraphraser
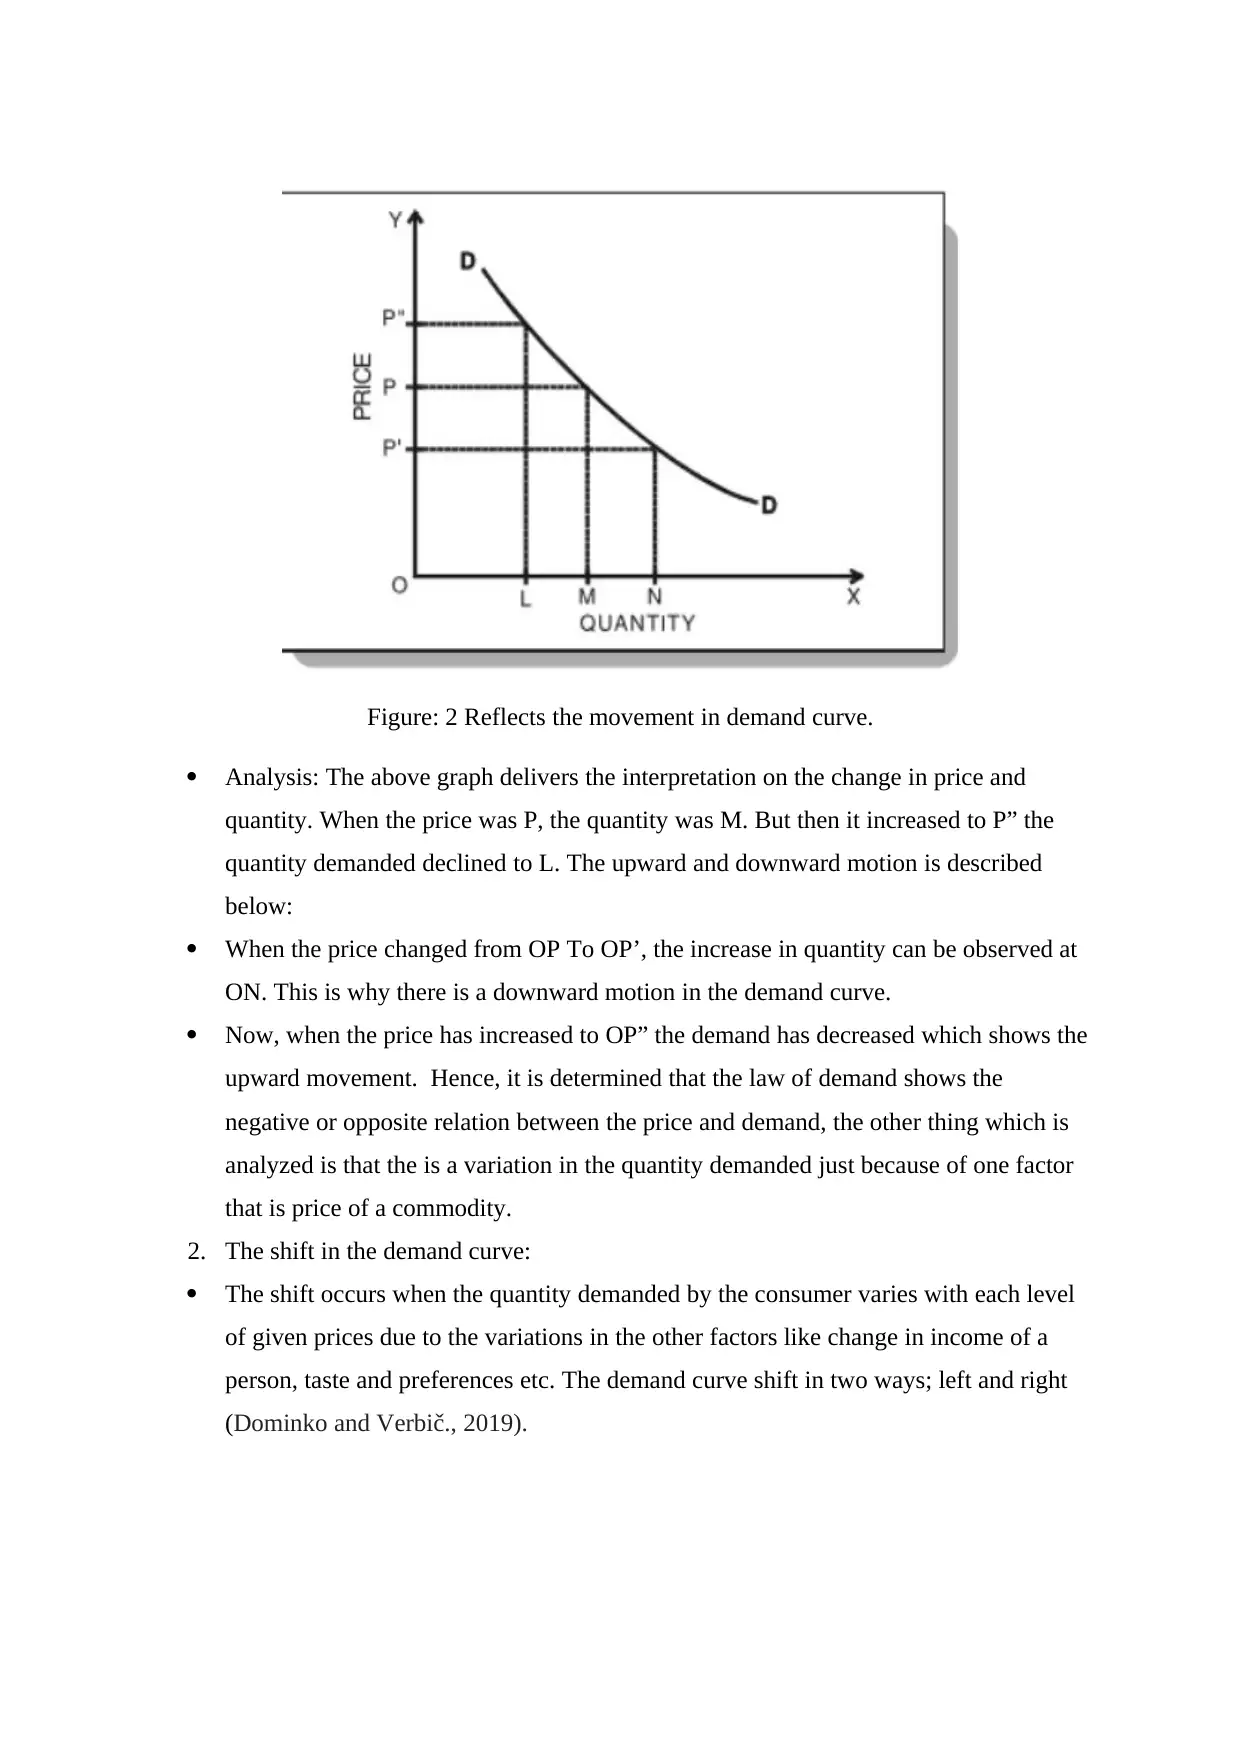
Figure: 2 Reflects the movement in demand curve.
Analysis: The above graph delivers the interpretation on the change in price and
quantity. When the price was P, the quantity was M. But then it increased to P” the
quantity demanded declined to L. The upward and downward motion is described
below:
When the price changed from OP To OP’, the increase in quantity can be observed at
ON. This is why there is a downward motion in the demand curve.
Now, when the price has increased to OP” the demand has decreased which shows the
upward movement. Hence, it is determined that the law of demand shows the
negative or opposite relation between the price and demand, the other thing which is
analyzed is that the is a variation in the quantity demanded just because of one factor
that is price of a commodity.
2. The shift in the demand curve:
The shift occurs when the quantity demanded by the consumer varies with each level
of given prices due to the variations in the other factors like change in income of a
person, taste and preferences etc. The demand curve shift in two ways; left and right
(Dominko and Verbič., 2019).
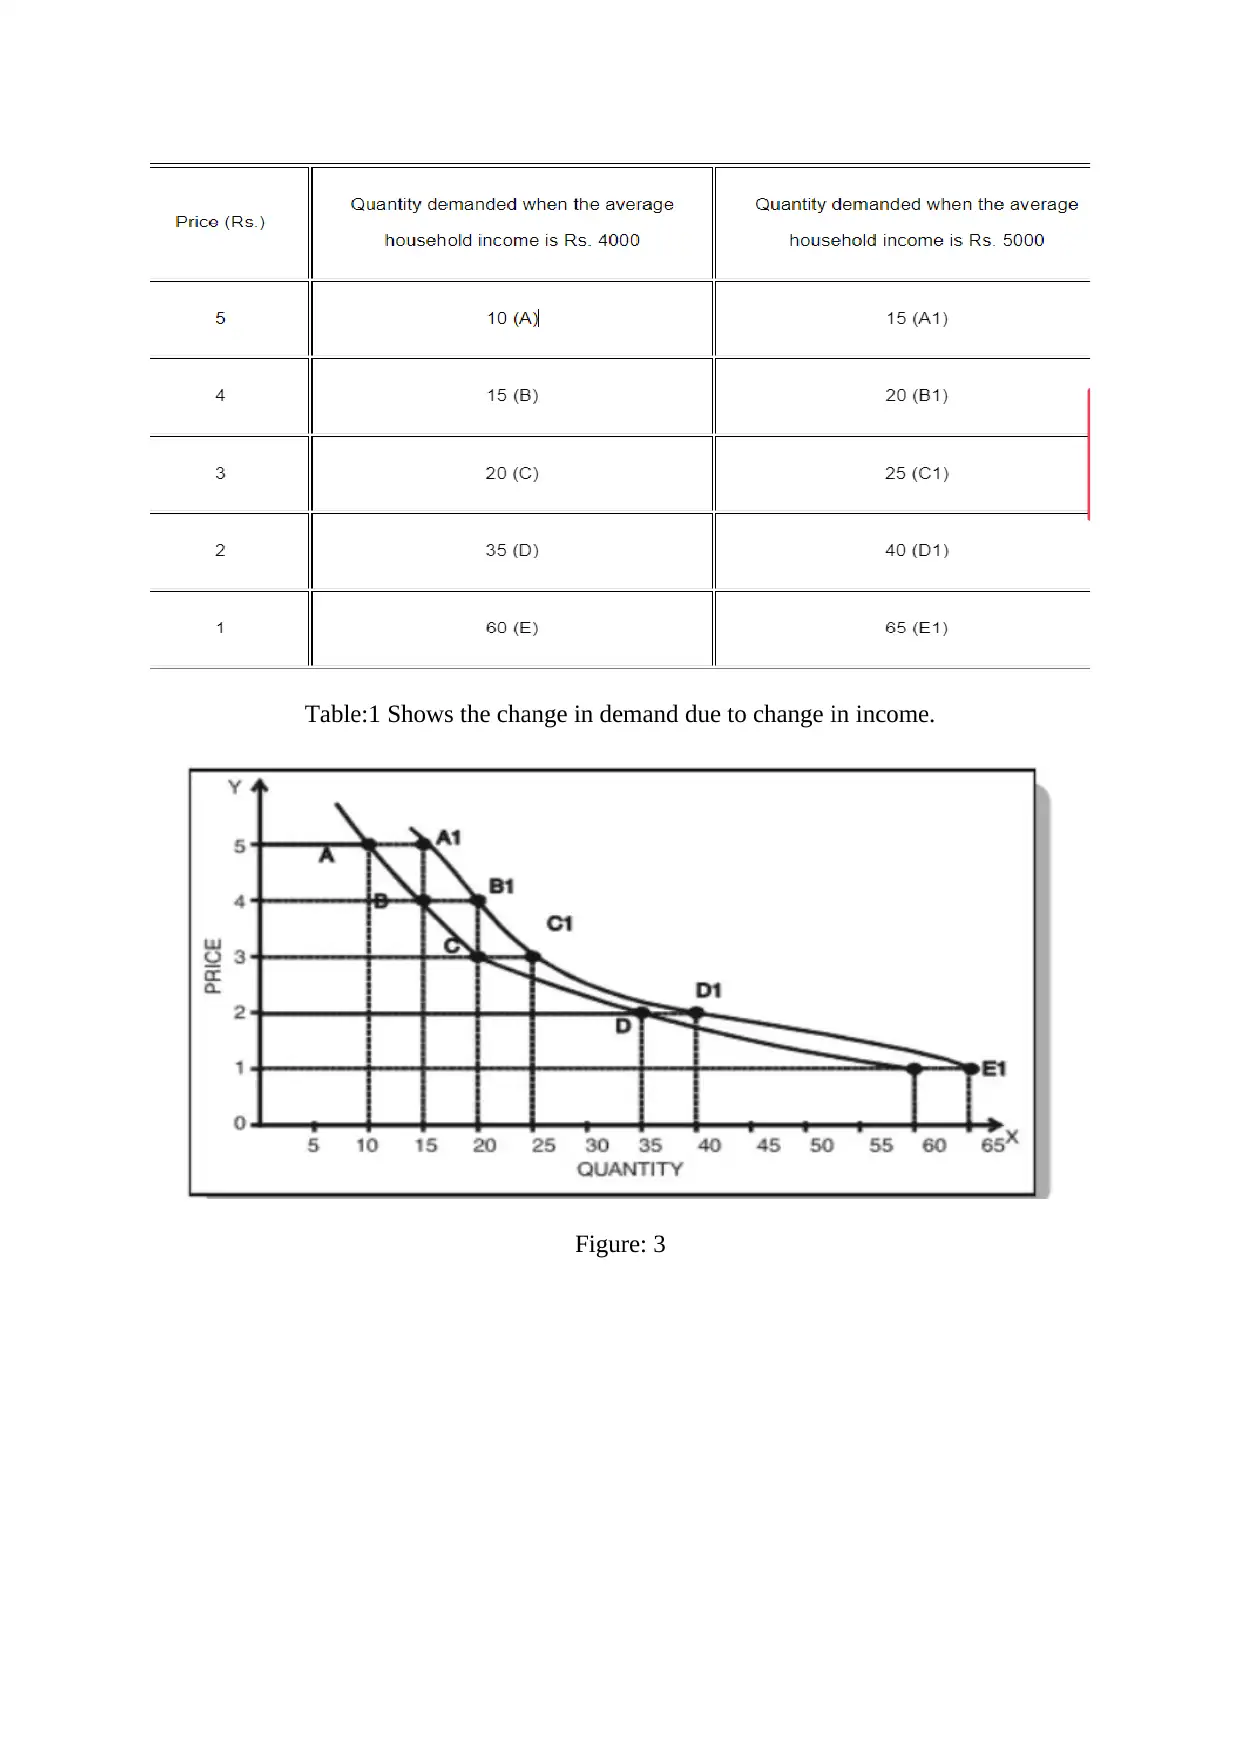
Table:1 Shows the change in demand due to change in income.
Figure: 3
Figure: 3
⊘ This is a preview!⊘
Do you want full access?
Subscribe today to unlock all pages.
Trusted by 1+ million students worldwide
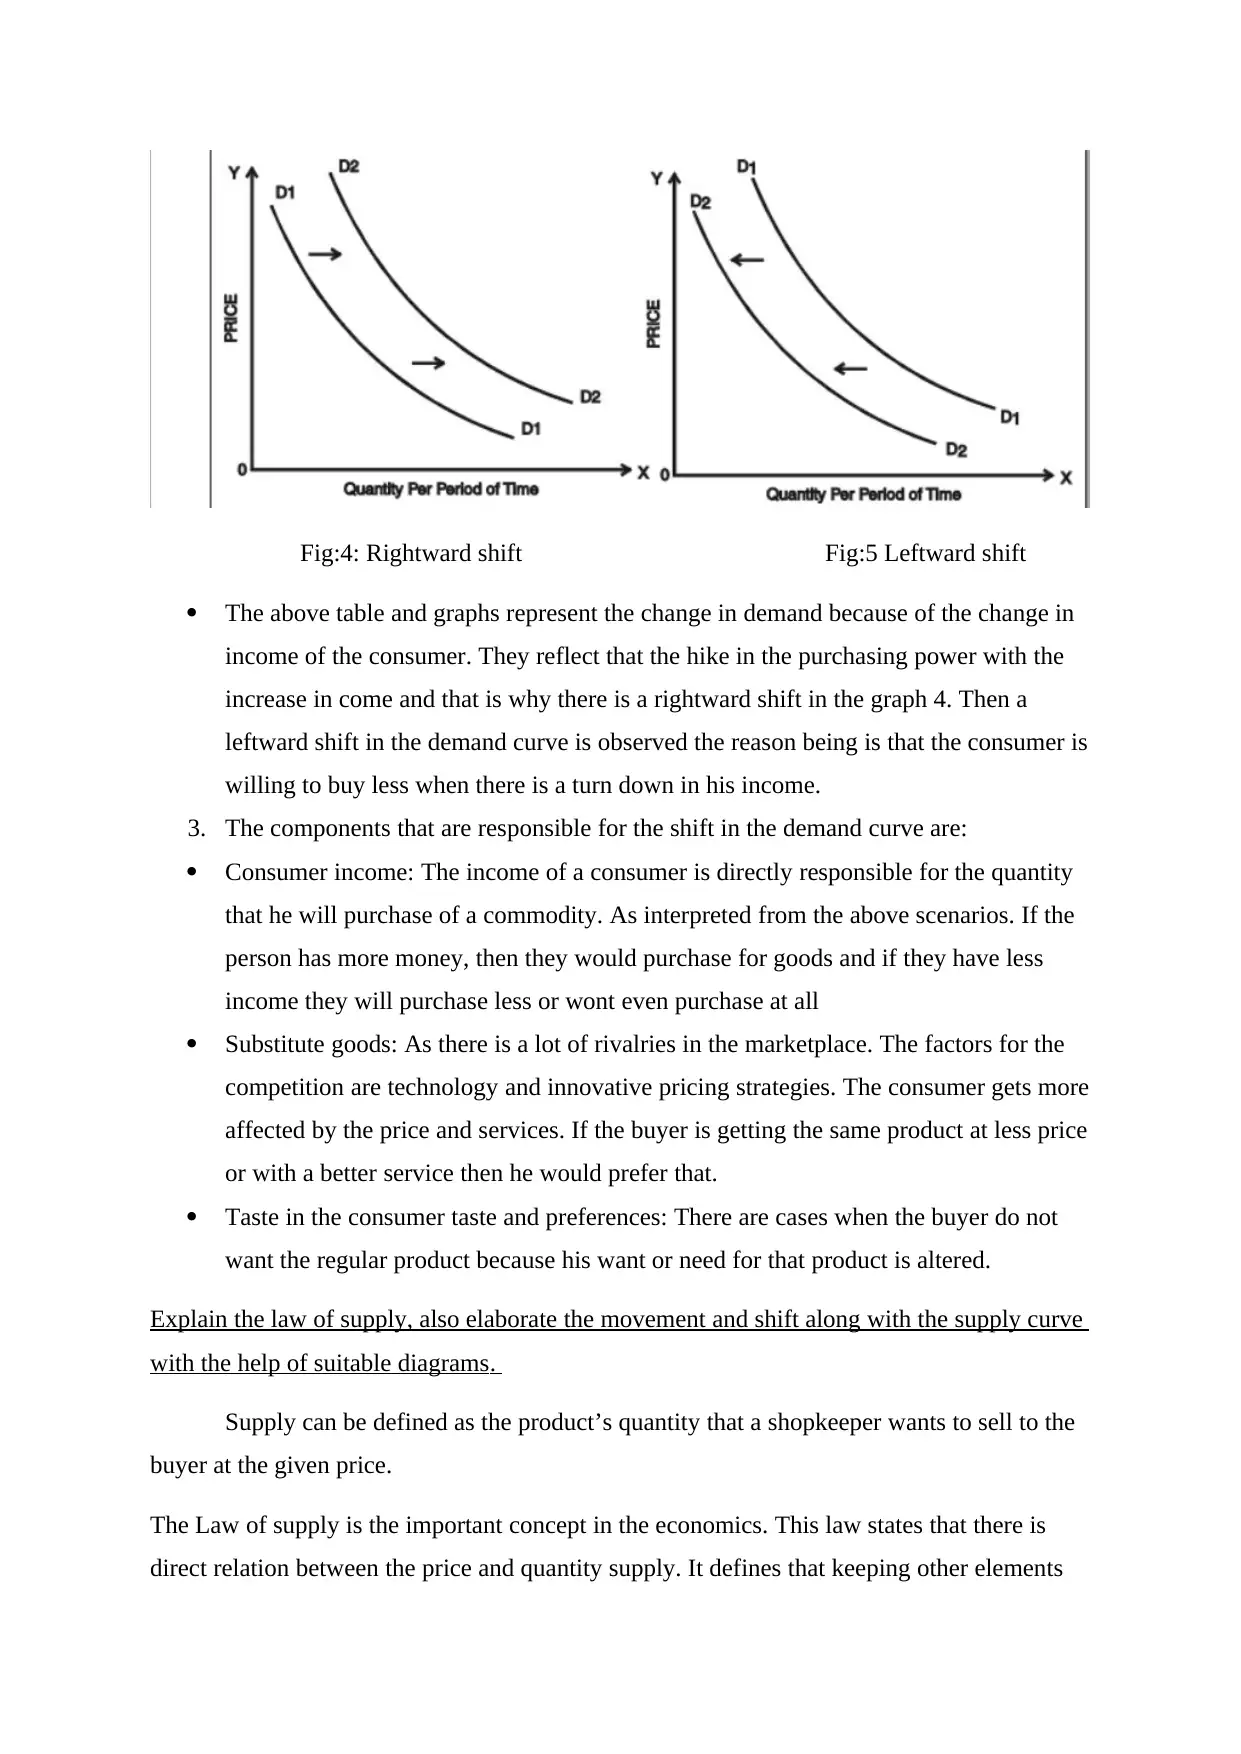
Fig:4: Rightward shift Fig:5 Leftward shift
The above table and graphs represent the change in demand because of the change in
income of the consumer. They reflect that the hike in the purchasing power with the
increase in come and that is why there is a rightward shift in the graph 4. Then a
leftward shift in the demand curve is observed the reason being is that the consumer is
willing to buy less when there is a turn down in his income.
3. The components that are responsible for the shift in the demand curve are:
Consumer income: The income of a consumer is directly responsible for the quantity
that he will purchase of a commodity. As interpreted from the above scenarios. If the
person has more money, then they would purchase for goods and if they have less
income they will purchase less or wont even purchase at all
Substitute goods: As there is a lot of rivalries in the marketplace. The factors for the
competition are technology and innovative pricing strategies. The consumer gets more
affected by the price and services. If the buyer is getting the same product at less price
or with a better service then he would prefer that.
Taste in the consumer taste and preferences: There are cases when the buyer do not
want the regular product because his want or need for that product is altered.
Explain the law of supply, also elaborate the movement and shift along with the supply curve
with the help of suitable diagrams.
Supply can be defined as the product’s quantity that a shopkeeper wants to sell to the
buyer at the given price.
The Law of supply is the important concept in the economics. This law states that there is
direct relation between the price and quantity supply. It defines that keeping other elements
Paraphrase This Document
Need a fresh take? Get an instant paraphrase of this document with our AI Paraphraser
constant when the price for the commodity will rise the supply of the product will also
increase. The response of the quantity supplied due to the variations in the prices of product
is the law of supply. When there is a hike in price then the retailers try to achieve more and
more profits by bringing an increase in the quantity of sales (Pilinkiene and Liberyte., 2021).
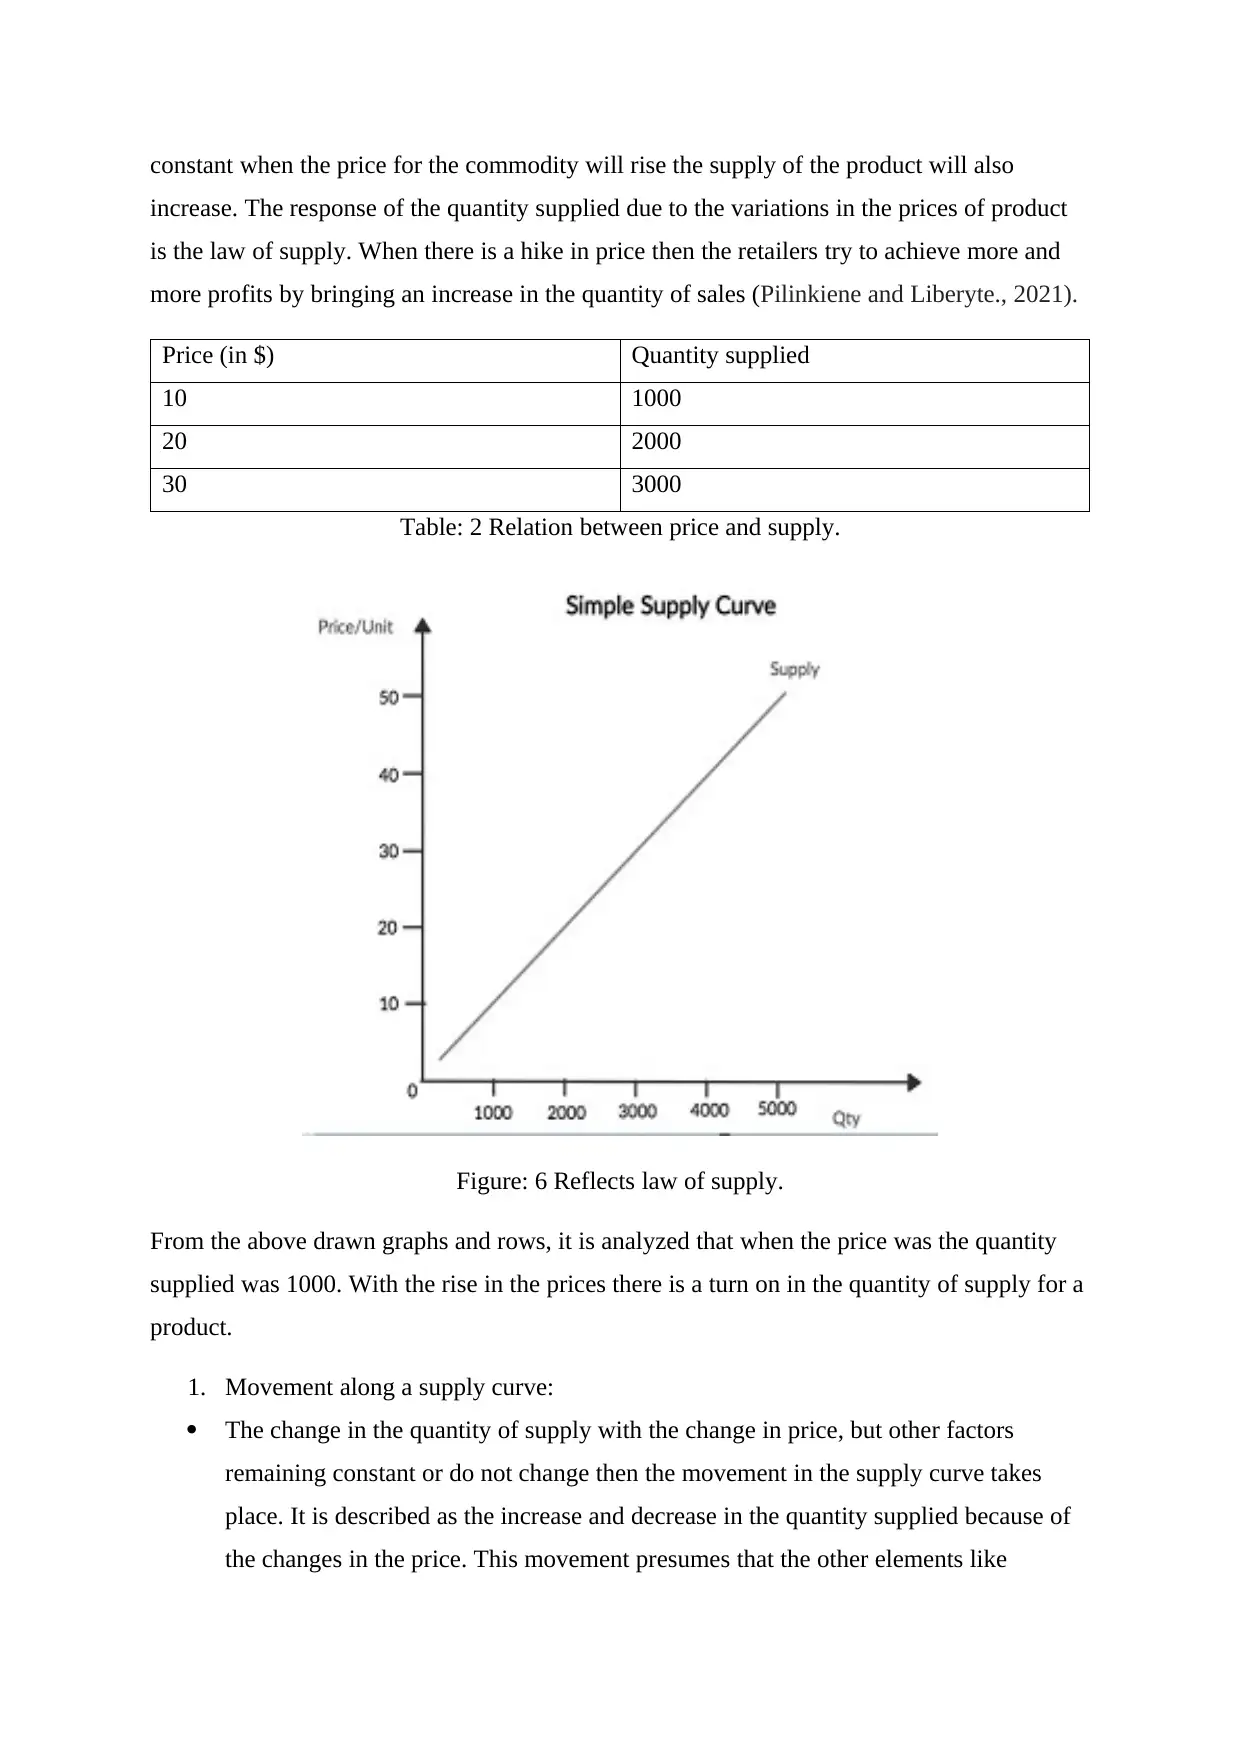
Price (in $) Quantity supplied
10 1000
20 2000
30 3000
Table: 2 Relation between price and supply.
Figure: 6 Reflects law of supply.
From the above drawn graphs and rows, it is analyzed that when the price was the quantity
supplied was 1000. With the rise in the prices there is a turn on in the quantity of supply for a
product.
1. Movement along a supply curve:
The change in the quantity of supply with the change in price, but other factors
remaining constant or do not change then the movement in the supply curve takes
place. It is described as the increase and decrease in the quantity supplied because of
the changes in the price. This movement presumes that the other elements like
increase. The response of the quantity supplied due to the variations in the prices of product
is the law of supply. When there is a hike in price then the retailers try to achieve more and
more profits by bringing an increase in the quantity of sales (Pilinkiene and Liberyte., 2021).
Price (in $) Quantity supplied
10 1000
20 2000
30 3000
Table: 2 Relation between price and supply.
Figure: 6 Reflects law of supply.
From the above drawn graphs and rows, it is analyzed that when the price was the quantity
supplied was 1000. With the rise in the prices there is a turn on in the quantity of supply for a
product.
1. Movement along a supply curve:
The change in the quantity of supply with the change in price, but other factors
remaining constant or do not change then the movement in the supply curve takes
place. It is described as the increase and decrease in the quantity supplied because of
the changes in the price. This movement presumes that the other elements like
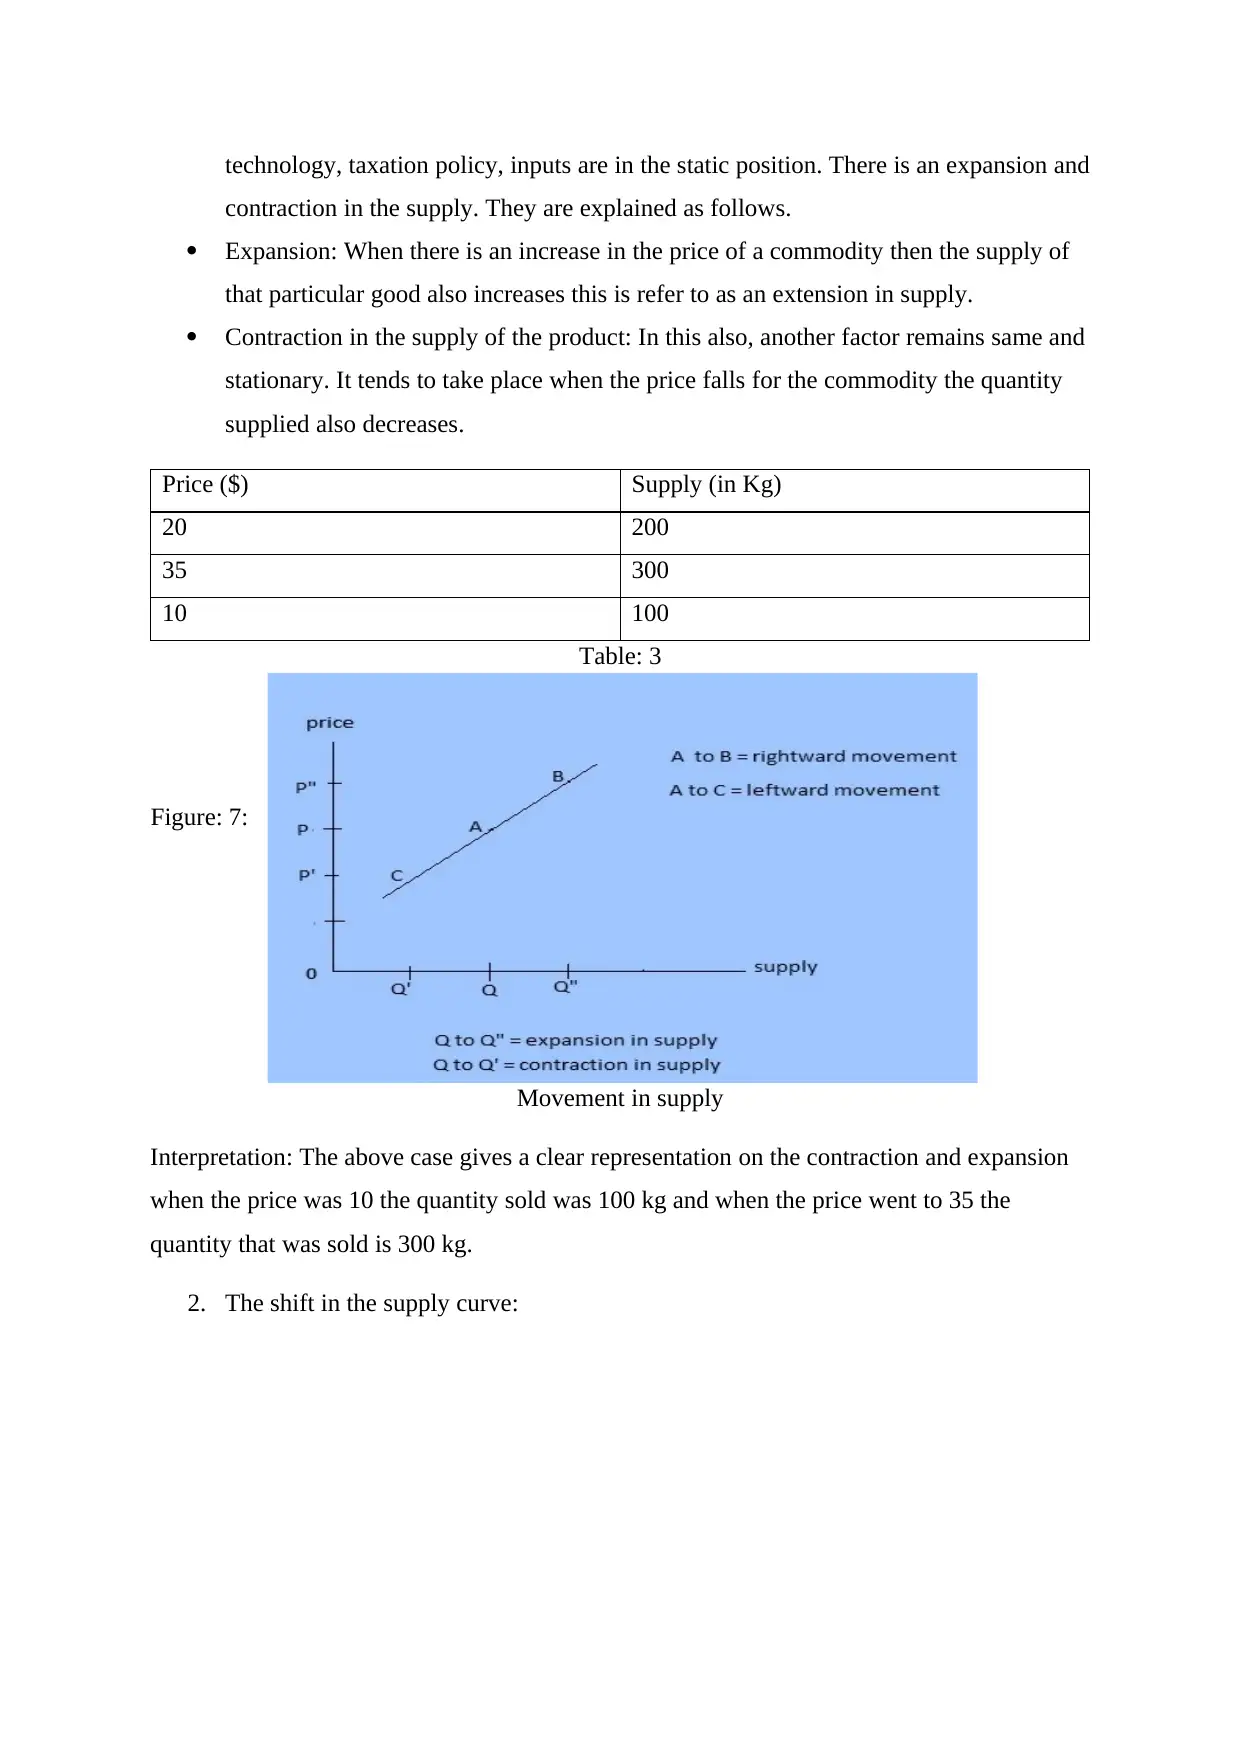
technology, taxation policy, inputs are in the static position. There is an expansion and
contraction in the supply. They are explained as follows.
Expansion: When there is an increase in the price of a commodity then the supply of
that particular good also increases this is refer to as an extension in supply.
Contraction in the supply of the product: In this also, another factor remains same and
stationary. It tends to take place when the price falls for the commodity the quantity
supplied also decreases.
Price ($) Supply (in Kg)
20 200
35 300
10 100
Table: 3
Figure: 7:
Movement in supply
Interpretation: The above case gives a clear representation on the contraction and expansion
when the price was 10 the quantity sold was 100 kg and when the price went to 35 the
quantity that was sold is 300 kg.
2. The shift in the supply curve:
⊘ This is a preview!⊘
Do you want full access?
Subscribe today to unlock all pages.
Trusted by 1+ million students worldwide
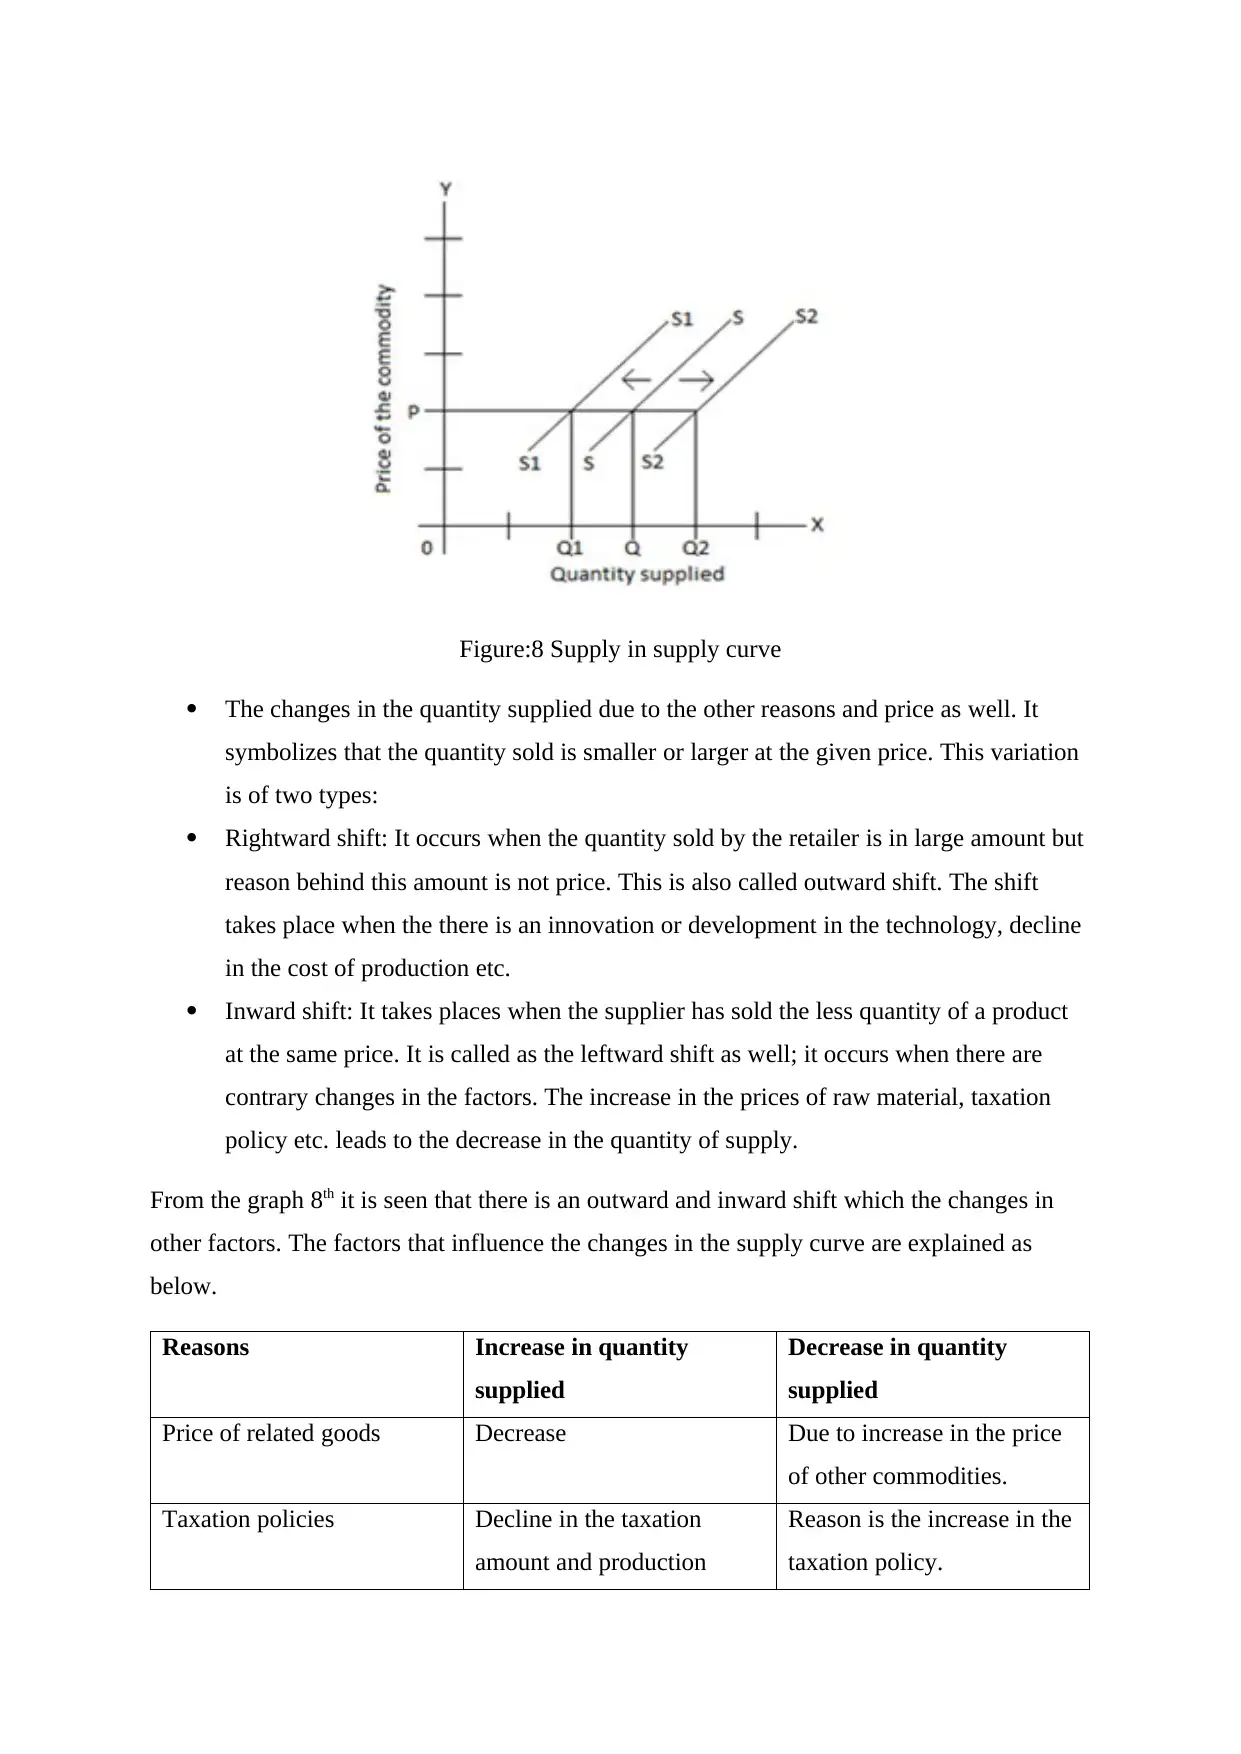
Figure:8 Supply in supply curve
The changes in the quantity supplied due to the other reasons and price as well. It
symbolizes that the quantity sold is smaller or larger at the given price. This variation
is of two types:
Rightward shift: It occurs when the quantity sold by the retailer is in large amount but
reason behind this amount is not price. This is also called outward shift. The shift
takes place when the there is an innovation or development in the technology, decline
in the cost of production etc.
Inward shift: It takes places when the supplier has sold the less quantity of a product
at the same price. It is called as the leftward shift as well; it occurs when there are
contrary changes in the factors. The increase in the prices of raw material, taxation
policy etc. leads to the decrease in the quantity of supply.
From the graph 8th it is seen that there is an outward and inward shift which the changes in
other factors. The factors that influence the changes in the supply curve are explained as
below.
Reasons Increase in quantity
supplied
Decrease in quantity
supplied
Price of related goods Decrease Due to increase in the price
of other commodities.
Taxation policies Decline in the taxation
amount and production
Reason is the increase in the
taxation policy.
Paraphrase This Document
Need a fresh take? Get an instant paraphrase of this document with our AI Paraphraser
costs.
Technology Effective and appropriate
use of the technology
Inefficient and inappropriate
utilization of technology.
TASK 2
Choose two merging models of 21st century contemporary economics and two models f 20th
century. Give a comparison and contrast and relate both of the concepts with the modern
business practices.
Economic Theory: The economic theory can be defined as the set of standards and
principles that explains the functioning of distinct economies. There are numerous models
that economic theory has. The Tesco Plc performs the activities with the aid of below stated
economic theories:
The Adam Smith Economic Theory: This theory comments on the potential of
manpower and labor. It states that both of them holds the great ability to make power.
This model defines if the people are self – ambitious, disciplined and motivated then
they can make the best use of the resources as they are scarce and have alternative
uses. The Adam smith also holds the opinion that if the government does not interfere
then the market can run smoothly and effectively. But if there is a government
interference then it can result in the economic sufferings. The economists Smith
Laissez Faire introduced the international trade practices. The government not in the
favor of imposing the worldwide trade practices, then Smith Faire came up with this
model. In his model, he prescribes that the nation can be developed when people are
allowed to take decisions associated with the land, labor, capital and machines that
how they shall be used. This theory gave an idea that enabling people to perform
according to their likings is crucial for other systems (Galbraith., 2018)
Keynesian Economic Theory: It is the principle that assess the macroeconomic
financial system and delivers an explanation on the affects that production,
employment, and inflation have because of the overall fiscal expenses that occur in an
economy. This standard was introduced in the 30s when the concept of the Great
Depression was understood by the British economists named John Maynard Keynes
(Stage., 2018). This model believes that the changes in the financial methods cause
the variations in the economy. It explains that demand plays a great role in an
economy, if the demand turns down then it would lead to the loss of employment
opportunities and production. And all this will result in making less expenses and
payments. The idea is imposable on the Tesco Plc that if the authorities provide the
extension in the money delivery, then there will increasing demand for the products
and services.
Modern Theories:
Nudge Principles: It explains the effect of modest suggestions and wonderful
technologies on the behavior of a consumer. It helps in the improvement of the
decision - making ability of the customers. It assists in improving thinking capability
so that the people can be able to manage and organize themselves with every possible
change the happens in an economy and also assists in examining the impact of the
present economic level (Ardito and et.al., 2018). It will help the Tesco Plc in the best
and effective use of its assets.
Behavioral Theory: Richard Thaler introduced this theory. It is a mixture of
psychology and economics. It enables to gain insights on the reactions of people and
their actions in real world. It helps the business to make faster decisions. It determines
that customers do not always take rational and reliable decisions even if they have
techniques that provide them with the information. All this is grounded on the real
observations of human behavior. For the Tesla Co. this theory can of purpose because
it is based on the model that choices of the people are dependent of generating the
money welfare. So, money policies are implemented after the consideration of the
factors like taxation and borrowing policies, spendings etc. But the concept that was
brought by Adam Smith is the best way to bring value in the system.
⊘ This is a preview!⊘
Do you want full access?
Subscribe today to unlock all pages.
Trusted by 1+ million students worldwide
1 out of 14
Related Documents


Your All-in-One AI-Powered Toolkit for Academic Success.
+13062052269
info@desklib.com
Available 24*7 on WhatsApp / Email
![[object Object]](/_next/static/media/star-bottom.7253800d.svg)
Unlock your academic potential
Copyright © 2020–2026 A2Z Services. All Rights Reserved. Developed and managed by ZUCOL.