ECON1010 Assignment 1: Demand and Supply Analysis of Airline Tickets

Verified

Added on  2023/01/19

|9
|1823
|92
Report
AI Summary
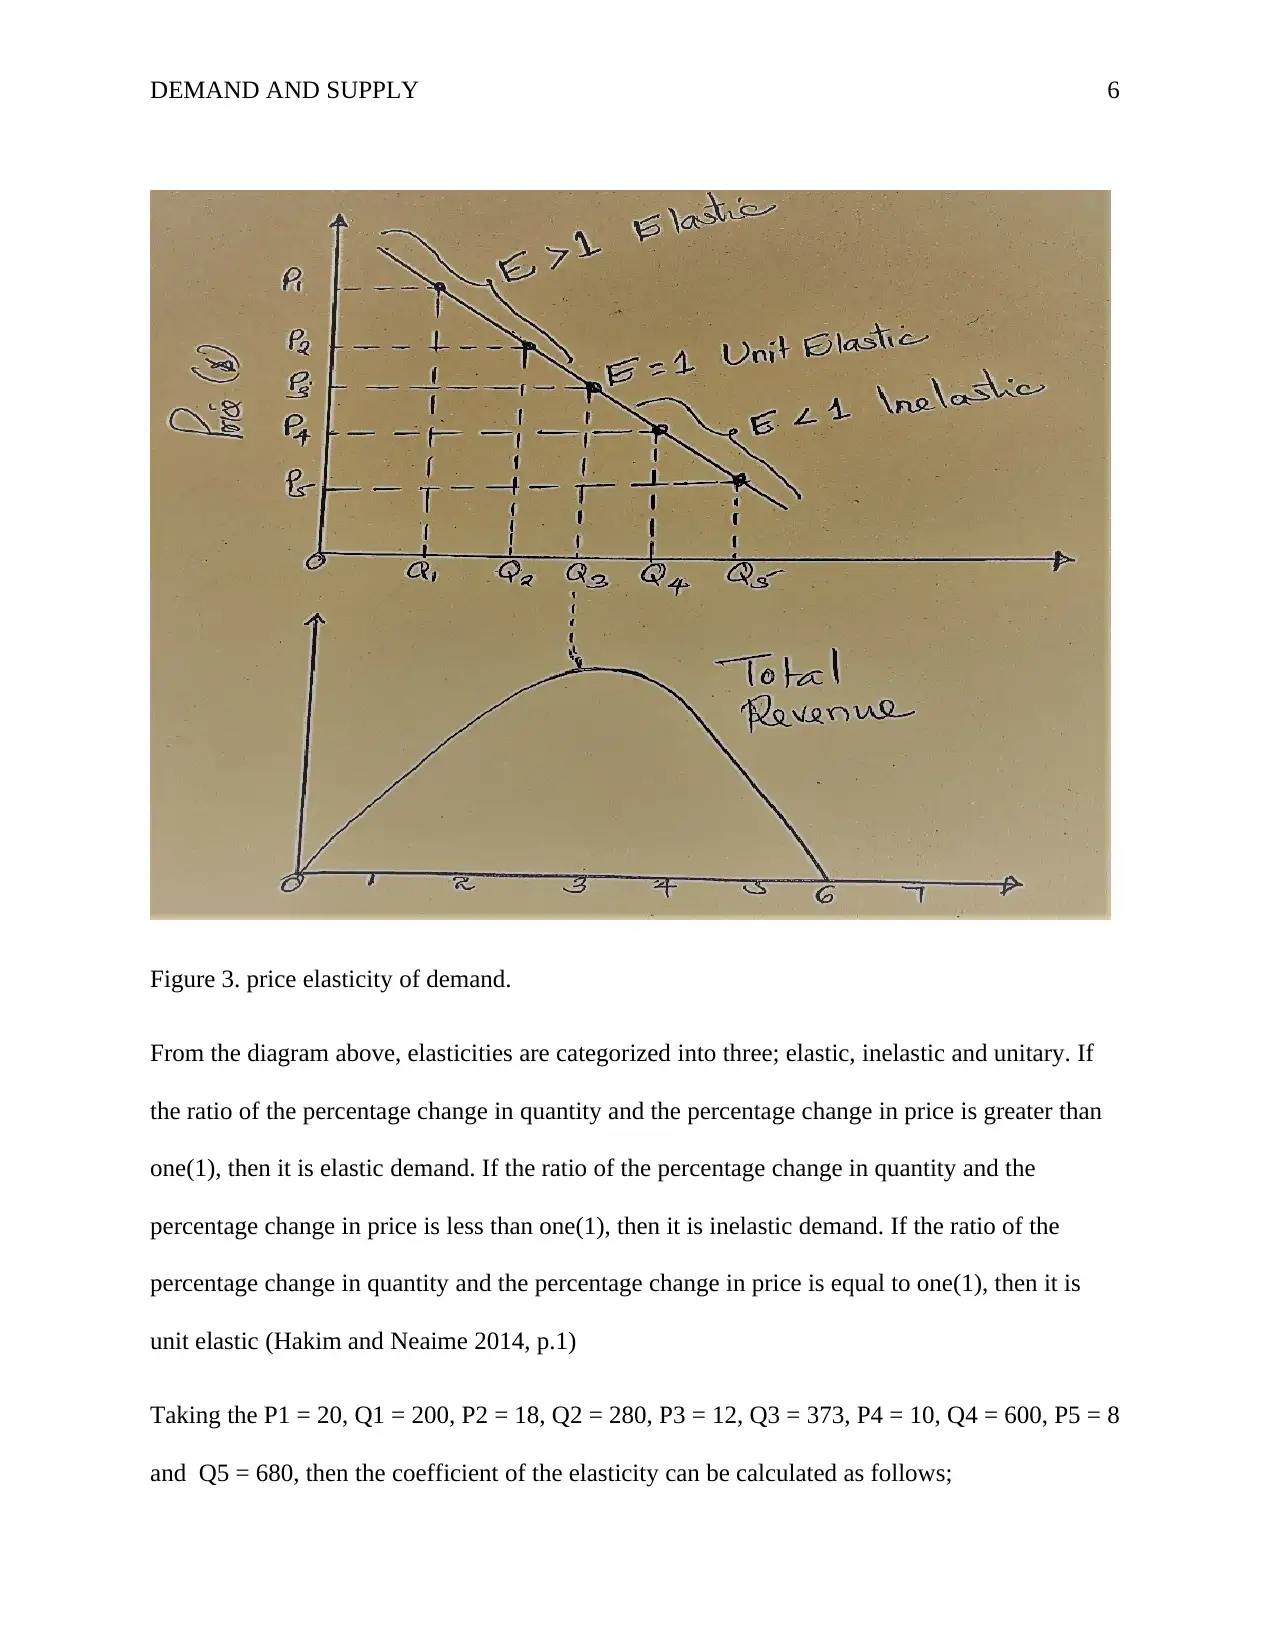
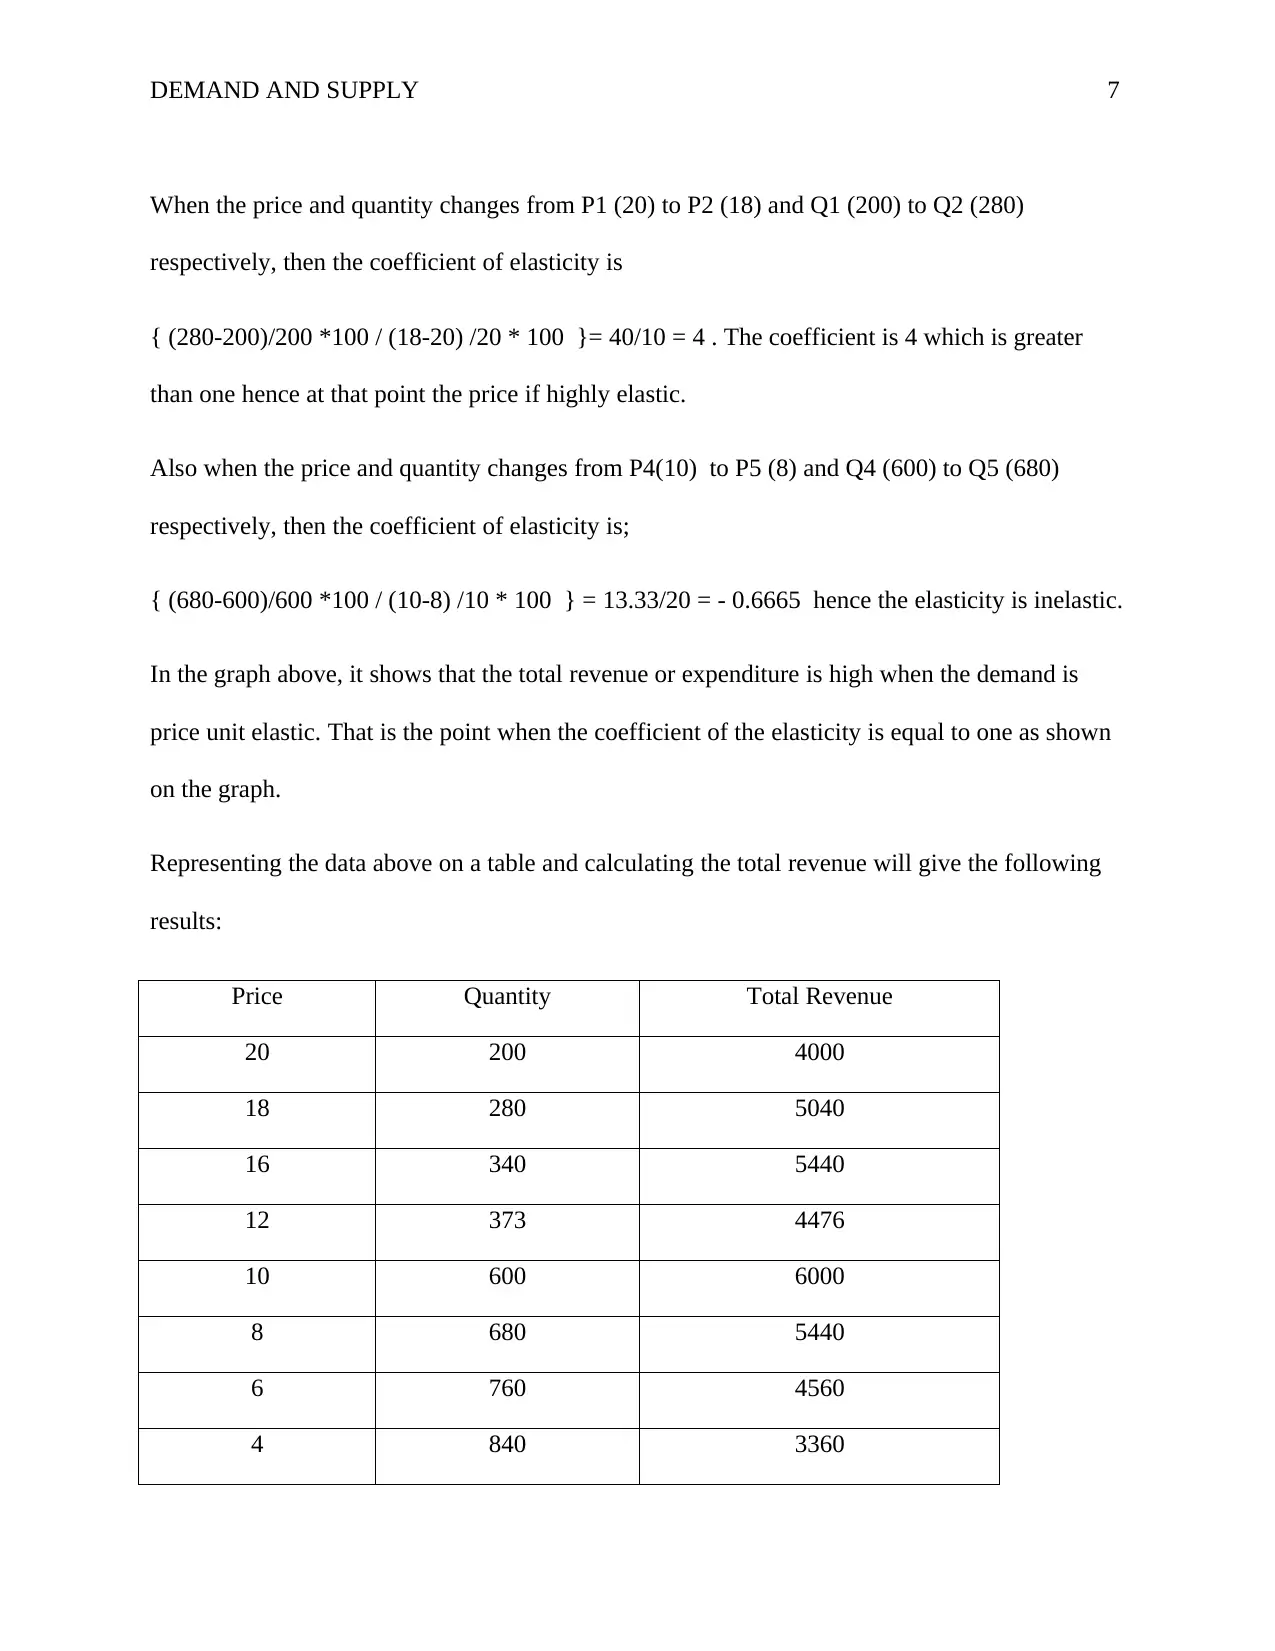
This report analyzes the impact of rising fuel prices on airline ticket prices using demand and supply models. It explores how increased fuel costs shift supply curves, leading to higher ticket prices and decreased demand, as illustrated through graphical representations of market equilibrium. The report also examines price elasticity of demand and supply, discussing how factors like the availability of substitutes and time influence elasticity. It includes calculations of elasticity coefficients and analyzes how price changes affect total revenue in the airline industry. The analysis covers elastic, inelastic, and unit elastic demand, and the report concludes by discussing the implications of these economic principles on the airline industry's revenue and overall market dynamics. The report also answers questions about the determinants of elasticity and explains these concepts with the help of graphs and the real-world scenario of airline tickets and fuel prices.
Document Page
DEMAND AND SUPPLY 1
ECONOMICS ASSIGNMENT
Student Name
Institutional Affiliation
Facilitator
Course
Date
tabler-icon-diamond-filled.svg

Paraphrase This Document

Need a fresh take? Get an instant paraphrase of this document with our AI Paraphraser
Document Page
DEMAND AND SUPPLY 2
Question1
a.
The ticket prices will increase because of the increase in the cost of the skyrocketing fuel. When
the price of the fuel goes up, the quantity will go down. Skyrocketing fuel is a complement
product for the airlines. So, an increase in its prices will lead to an increase in the ticket prices
for the airlines. This increase in the ticket prices will result in a decrease in demand for the
airlines in the future. Having the initial price at point P0 and the quantity at point Q0 as shown in
the diagram below, point E0 is the equilibrium for the airlines demanded. When the price goes up
to point P1, the quantity demanded decreases to point Q1 causing the equilibrium of the airlines
demanded move from E0 to E1 along the demand curve.
Figure 1: change in Equilibrium Price and Quantity.
Document Page
DEMAND AND SUPPLY 3
In the above diagram, the other factors affecting demand are assumed to be constant. This is the
reason why there is a movement of the equilibrium from E0 to E1 along the demand curve. The
future expectation of the prices of the skyrocketing fuel to go up is the only determinant causing
this movement of the equilibrium.
The demand in the future will also decrease due to this factor of expecting the ticket prices to go
up (Wang and Lai 2010, p.868).
b.
In the current market, the demand for airlines will increase due to the expectation of prices of the
tickets to go up. This will make the airlines experience more customers (consumers) than in the
future. According to the diagram below, the demand curve (D0) will shift to the right to D1
causing the equilibrium shift from point E0 to E1.
Document Page
DEMAND AND SUPPLY 4
The quantity demanded will increase making the demand curve to shift to the right. The shift in
the demand curve is caused by other factors of demand such as consumers’ income, increase in
the number of the potential consumers, favorable trends and tastes of the consumers as well as
consumers income. For the shift of the demand curve to occur, the prices are held constant.
Question2
a.
Price elasticity of demand is how the change in price of goods and services changes to affect the
quantity of the goods and services demanded in the market for a given period of time (Cashin et
al 2014, p.113).
In the case of the ‘air travel’, if it has another close substitute, then consumers will easily switch
to the other substitute in the market and the demand for the ‘air travel’ will be more elastic. If the
products being transported by the consumers are necessities, then the demand will be inelastic
but if they transport for luxury, then the demand tends to be elastic. Also, if the time given to
make that price changes in the market is longer, the demand of the ‘air travel’ will be elastic
since the consumers will have plenty time for searching an alternative. In case there are costs
involving in switching to another means of transport, then air travel’s demand will be inelastic. If
the ratio of income of the customers (consumers) to that they allocate to spend on the ‘air travel’
is high, then the demand for that ‘air travel’ will be more elastic (Tarasova and Tarasov 2016,
p.219)
b.
tabler-icon-diamond-filled.svg

Paraphrase This Document

Need a fresh take? Get an instant paraphrase of this document with our AI Paraphraser
Document Page
DEMAND AND SUPPLY 5
The elasticity of supply shows how the number of goods and services changes relate to their
changes in prices in the market for a given period of time (Imps and Mejean 2015, p.43).
Time is a very important factor in supply elasticity when the prices of the skyrocketing fuel go
up and the producers have enough time to make expansion on the output, then the supply tends to
be more elastic. Likewise, when the time is limited such that can’t allow the producers to adjust
themselves on the output expansion, then supply will be relatively inelastic (Malhotra and
Kumari 2016, p.94). The mobility in the factors of production tends to determine the price
elasticity of supply. When the factors are easy to be changed from one use to another then the
elasticity of supply of the skyrocketing fuel tends to be more elastic. Similarly, if the mobility is
not easy to change the factors from one use to another then the supply of the skyrocketing fuel
will be inelastic. Also, the suppliers can take advantage of the rise in prices of the fuels, then the
supply becomes excess leading to the more elastic of the supply in the market. Another factor is
when there is the availability of infrastructure facilities in the market for the supply to store for
their products in terms of expansion, then the elasticity of supply becomes relatively elastic. If
there are no facilities for storing the fuels in the airline industry, then the suppliers can’t expand
their output and this leads the price in supply to be relatively inelastic (Soderbery 2015, p.1).
Question3
The diagram below shows a price elasticity of demand along a linear demand curve.
Document Page
DEMAND AND SUPPLY 6
Figure 3. price elasticity of demand.
From the diagram above, elasticities are categorized into three; elastic, inelastic and unitary. If
the ratio of the percentage change in quantity and the percentage change in price is greater than
one(1), then it is elastic demand. If the ratio of the percentage change in quantity and the
percentage change in price is less than one(1), then it is inelastic demand. If the ratio of the
percentage change in quantity and the percentage change in price is equal to one(1), then it is
unit elastic (Hakim and Neaime 2014, p.1)
Taking the P1 = 20, Q1 = 200, P2 = 18, Q2 = 280, P3 = 12, Q3 = 373, P4 = 10, Q4 = 600, P5 = 8
and Q5 = 680, then the coefficient of the elasticity can be calculated as follows;
Document Page
DEMAND AND SUPPLY 7
When the price and quantity changes from P1 (20) to P2 (18) and Q1 (200) to Q2 (280)
respectively, then the coefficient of elasticity is
{ (280-200)/200 *100 / (18-20) /20 * 100 }= 40/10 = 4 . The coefficient is 4 which is greater
than one hence at that point the price if highly elastic.
Also when the price and quantity changes from P4(10) to P5 (8) and Q4 (600) to Q5 (680)
respectively, then the coefficient of elasticity is;
{ (680-600)/600 *100 / (10-8) /10 * 100 } = 13.33/20 = - 0.6665 hence the elasticity is inelastic.
In the graph above, it shows that the total revenue or expenditure is high when the demand is
price unit elastic. That is the point when the coefficient of the elasticity is equal to one as shown
on the graph.
Representing the data above on a table and calculating the total revenue will give the following
results:
Price Quantity Total Revenue
20 200 4000
18 280 5040
16 340 5440
12 373 4476
10 600 6000
8 680 5440
6 760 4560
4 840 3360
tabler-icon-diamond-filled.svg

Paraphrase This Document

Need a fresh take? Get an instant paraphrase of this document with our AI Paraphraser
Document Page
DEMAND AND SUPPLY 8
Table 1
When the price falls and the demand is price elastic, then the reduction of the prices leads to an
increase in the total revenue to the producers. Also when the demand is price inelastic, the fall in
prices leads to lower the total revenue in that market. Studying the trend in the table above, the
revenue increases as the price continues to fall until it reaches a point where it starts to go down.
This is the point when the demand is unit elastic ( when the price is 12 and the quantity is 373).
Similarly, when the prices of the fuel go up, and the consumer’s proportion to their income and
what they have allocated to spending is higher, then the demand remains elastic and the revenue
collection by the airline industry will increase. in case the demand for the price is inelastic, then
the revenue collection will decrease due to decrease in demand after the demand curve shifting to
the left (Gervais 2015, p.1152).
Document Page
DEMAND AND SUPPLY 9
References
Cashin, P., Mohaddes, K., Raissi, M. and Raissi, M., 2014. The differential effects of oil demand
and supply shocks on the global economy. Energy Economics, 44, pp.113-134
Gervais, A., 2015. Product quality and firm heterogeneity in international trade. Canadian
Journal of Economics/Revue canadienned'économique, 48(3), pp.1152-1174.
Hakim, S. and Neaime, S., 2014. The demand elasticity of mobile telephones in the Middle East
and North Africa. Research in international business and finance, 32, pp.1-14.
He, Y., Wang, S. and Lai, K.K., 2010. Global economic activity and crude oil prices: A
cointegration analysis. Energy Economics, 32(4), pp.868-876.
Imbs, J. and Mejean, I., 2015. Elasticity optimism. American Economic Journal:
Macroeconomics, 7(3), pp.43-83.
Malhotra, N. and Kumari, D., 2016. Determinants of Exports in Major Asian Economies.
Journal of International Economics, 7(1), p.94.
Soderbery, A., 2015. Estimating import supply and demand elasticities: Analysis and
implications. Journal of International Economics, 96(1), pp.1-17.
Tarasova, V.V. and Tarasov, V.E., 2016. Elasticity for economic processes with memory:
Fractional differential calculus approach. Fractional Differential Calculus, 6(2), pp.219-232.
chevron_up_icon
1 out of 9
circle_padding
hide_on_mobile
zoom_out_icon