University Economics 101: Demand, Supply, and Elasticity Analysis

Verified

Added on  2020/03/01

|5
|620
|126
Homework Assignment
AI Summary
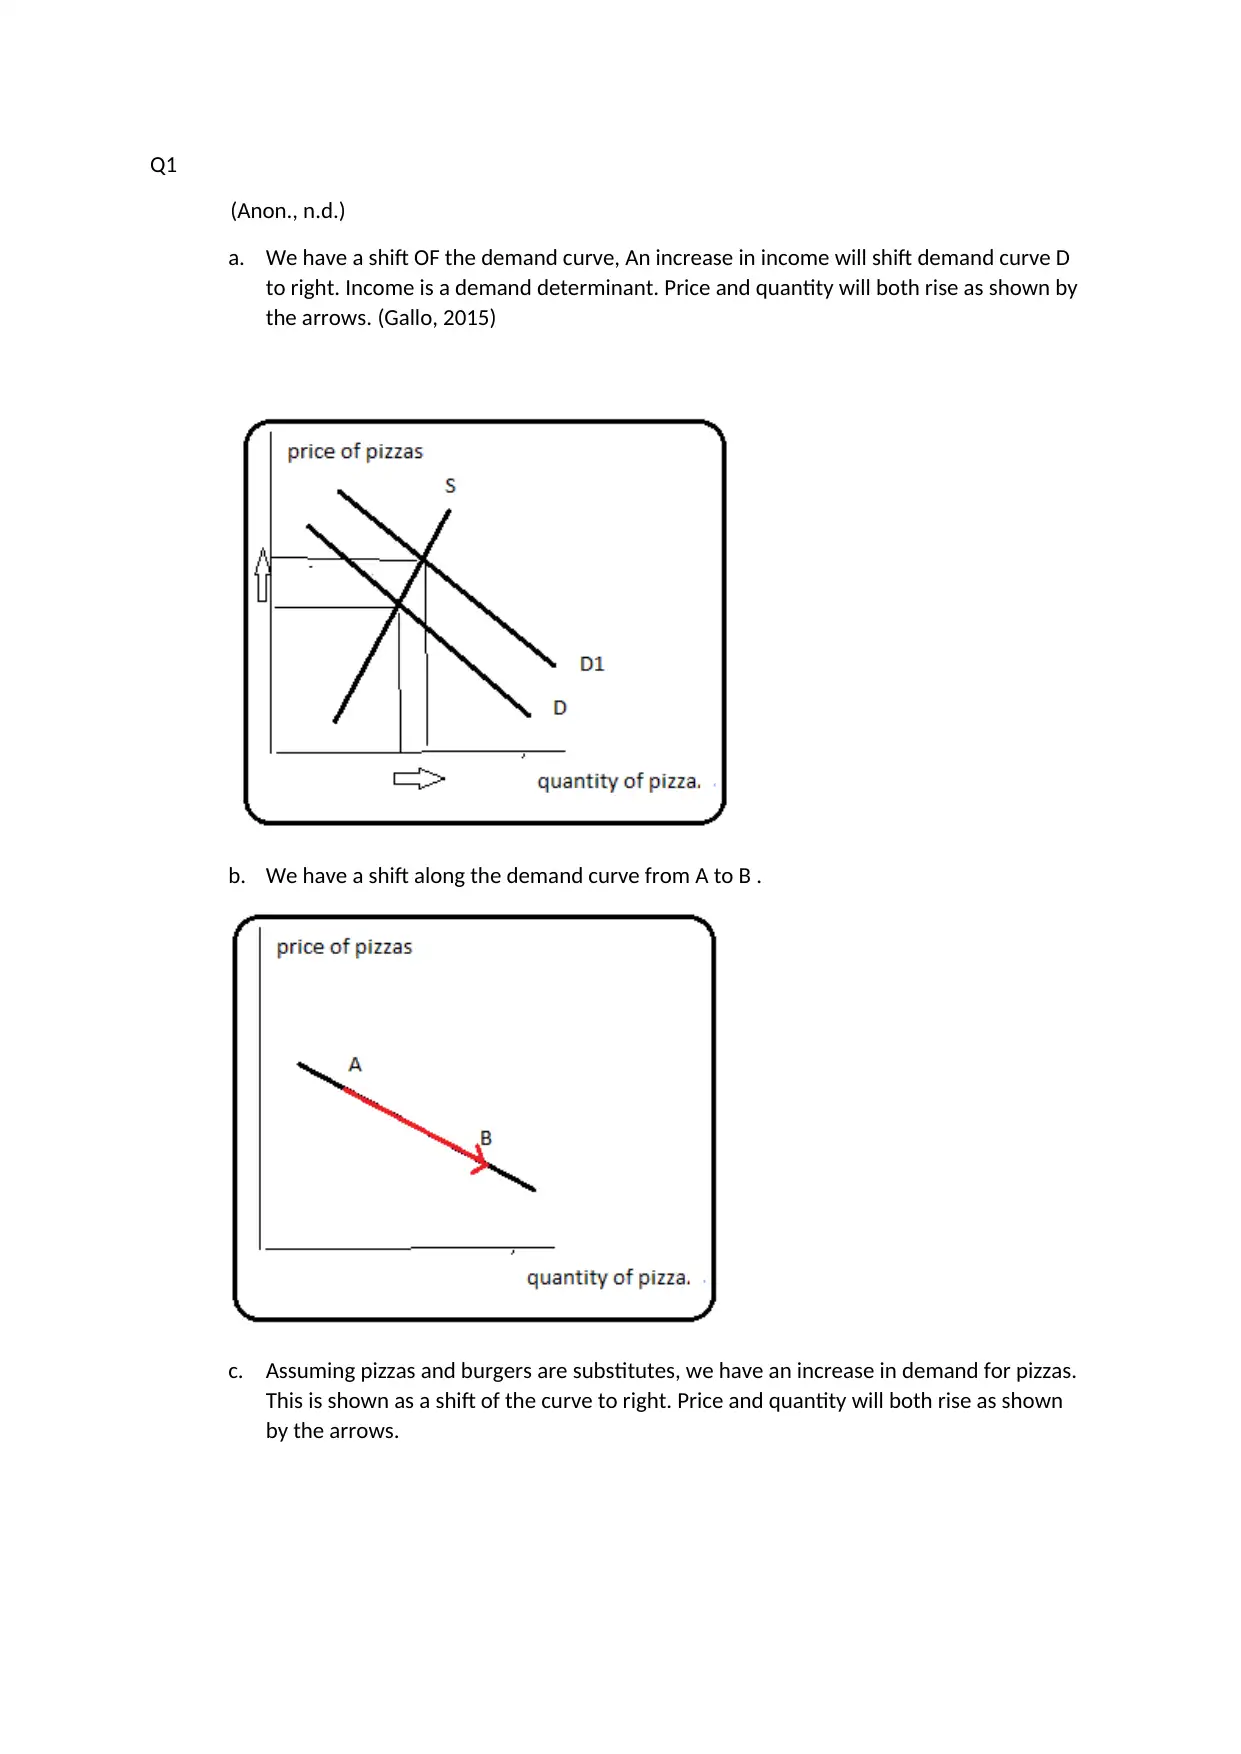
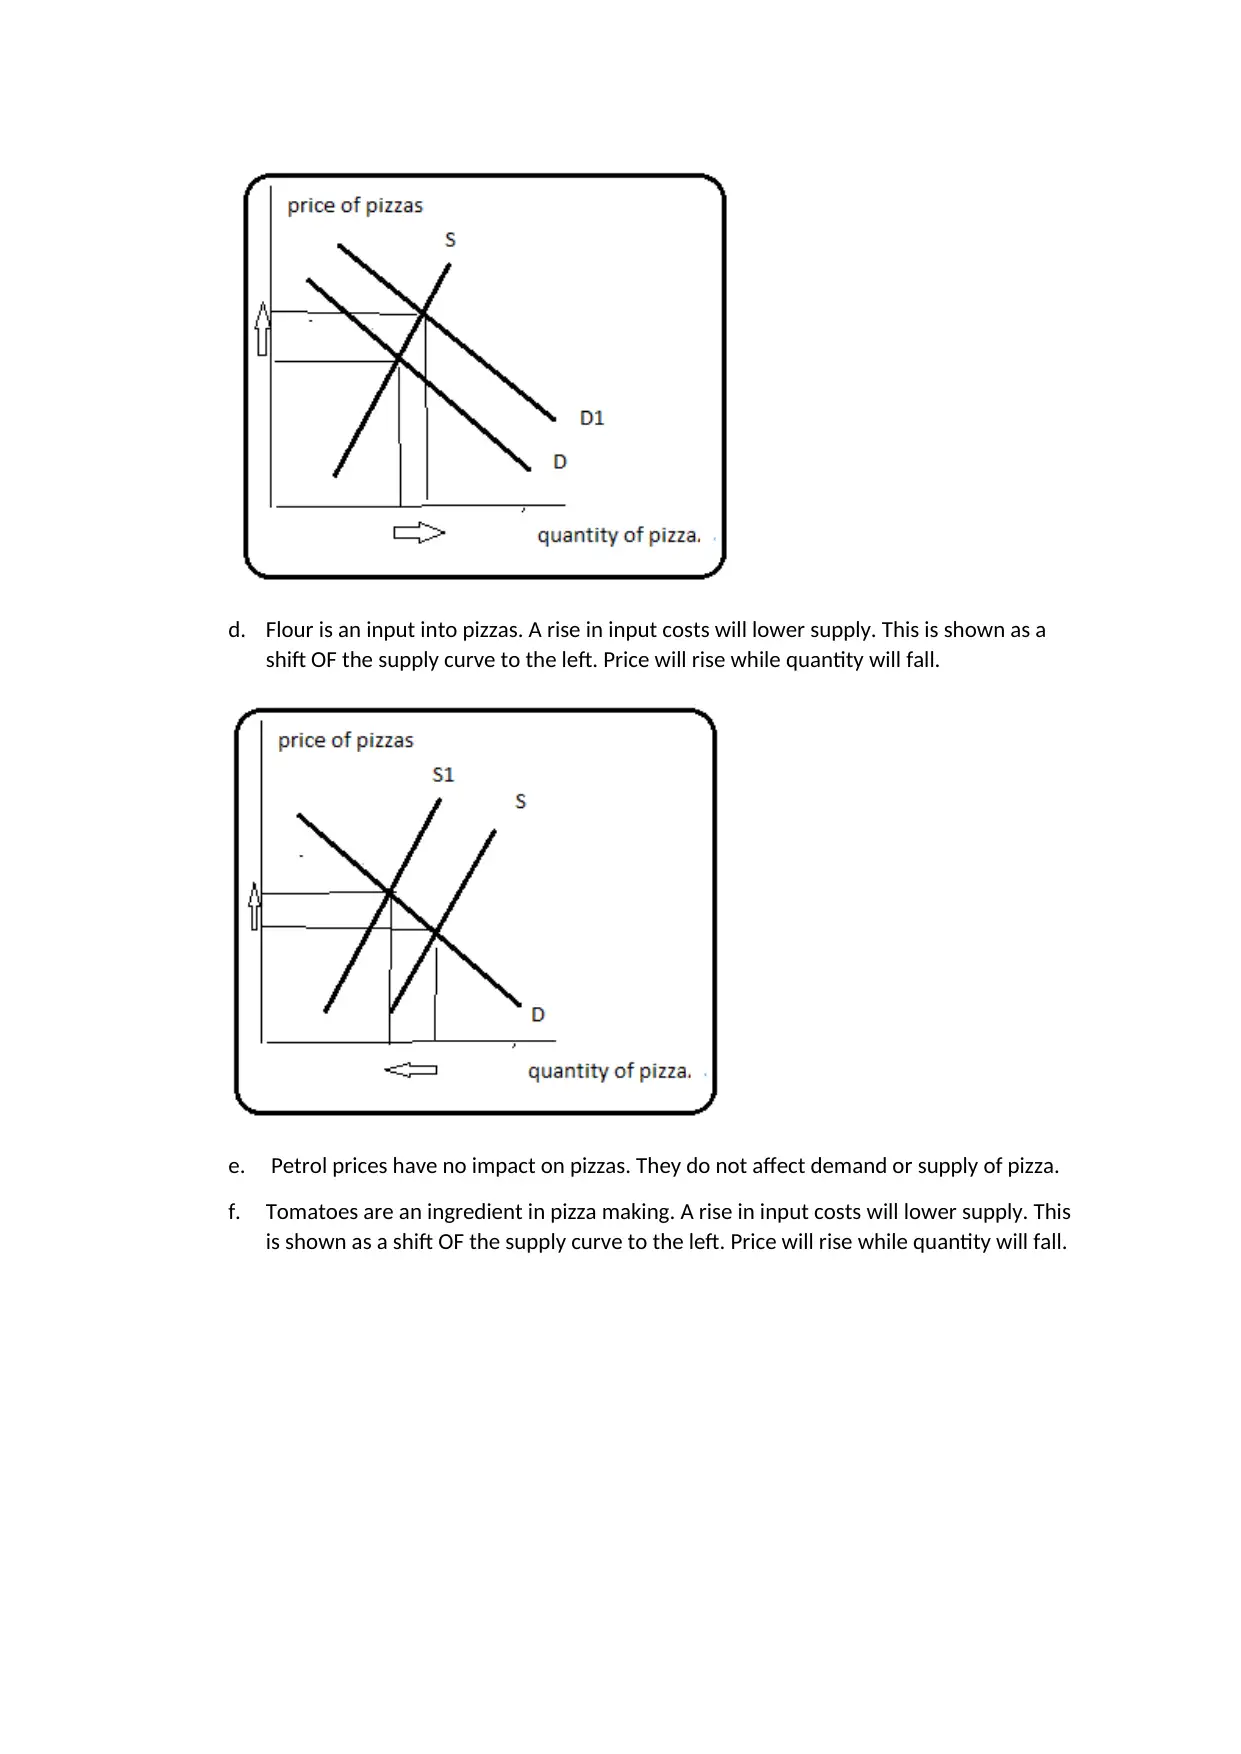
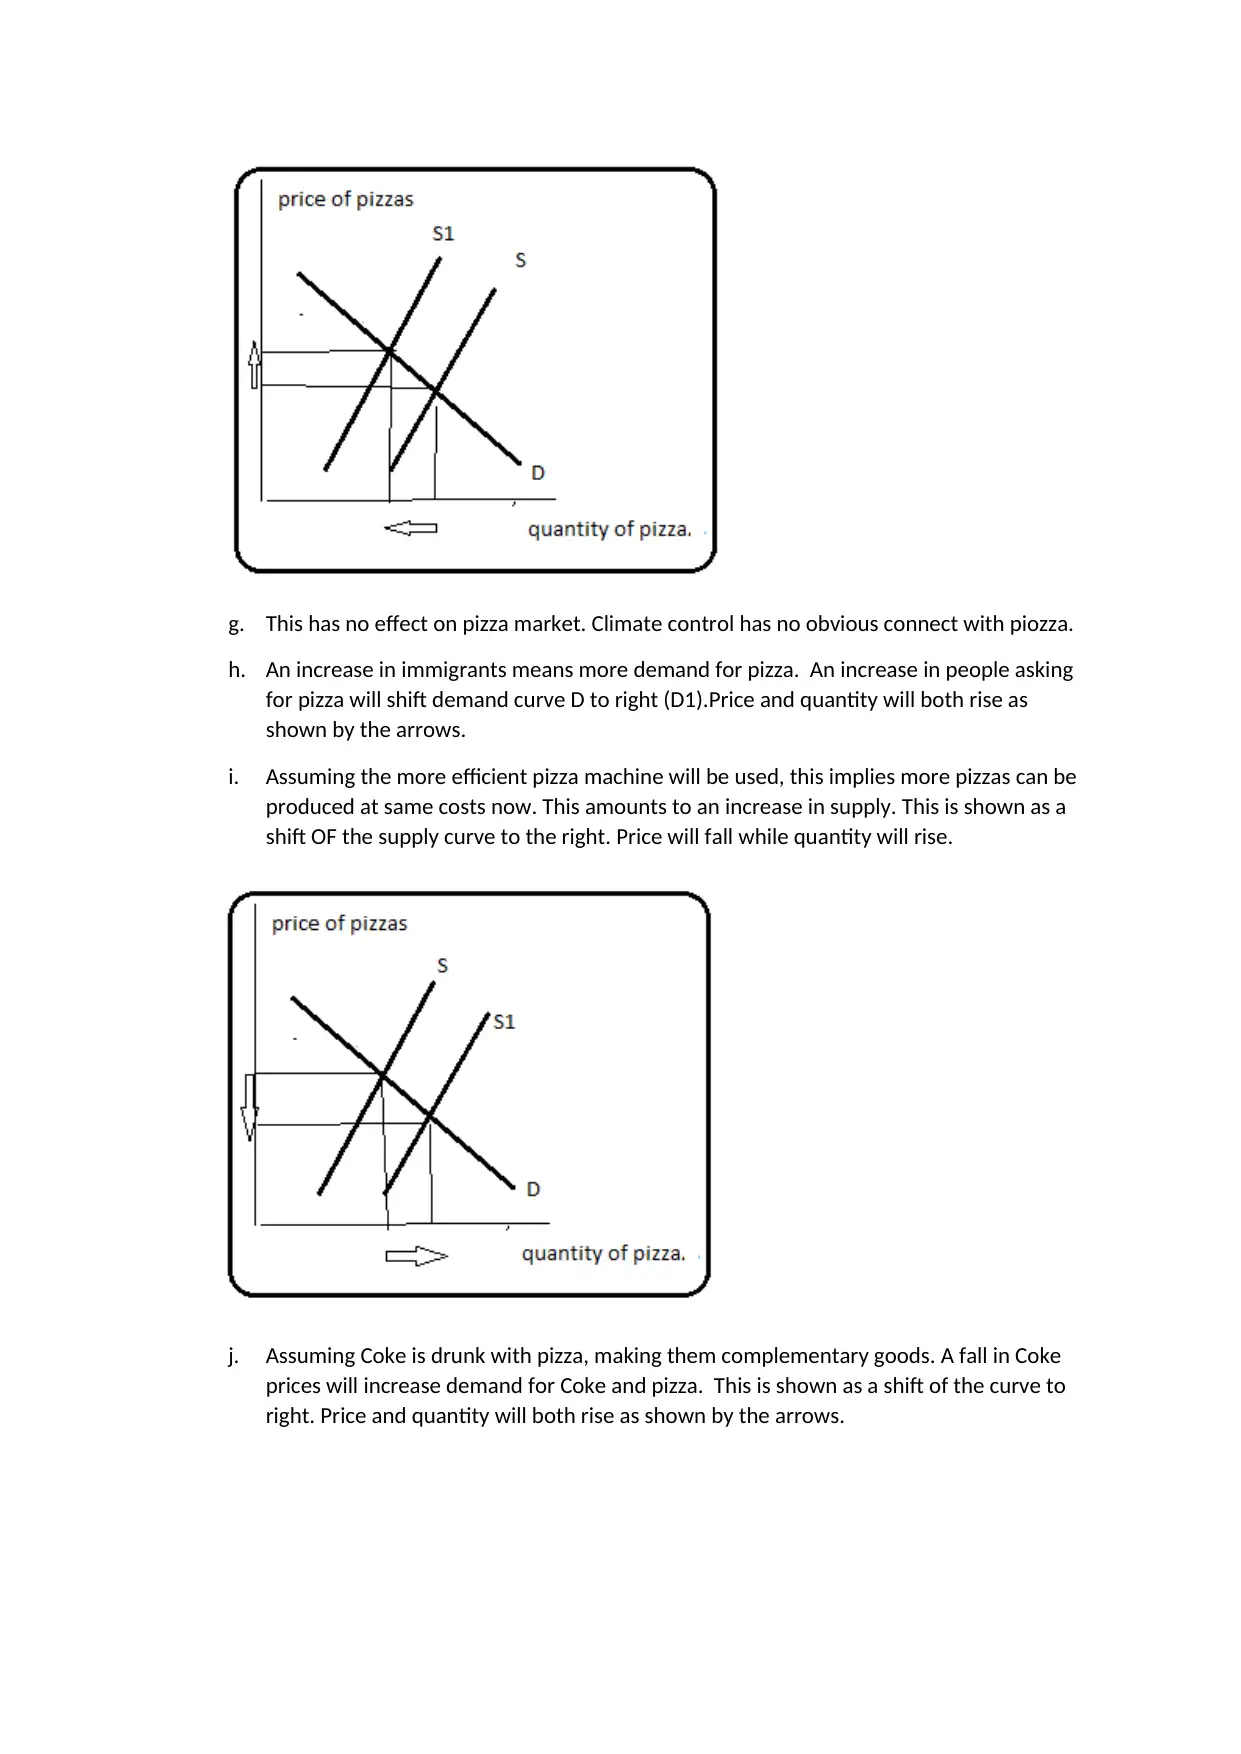
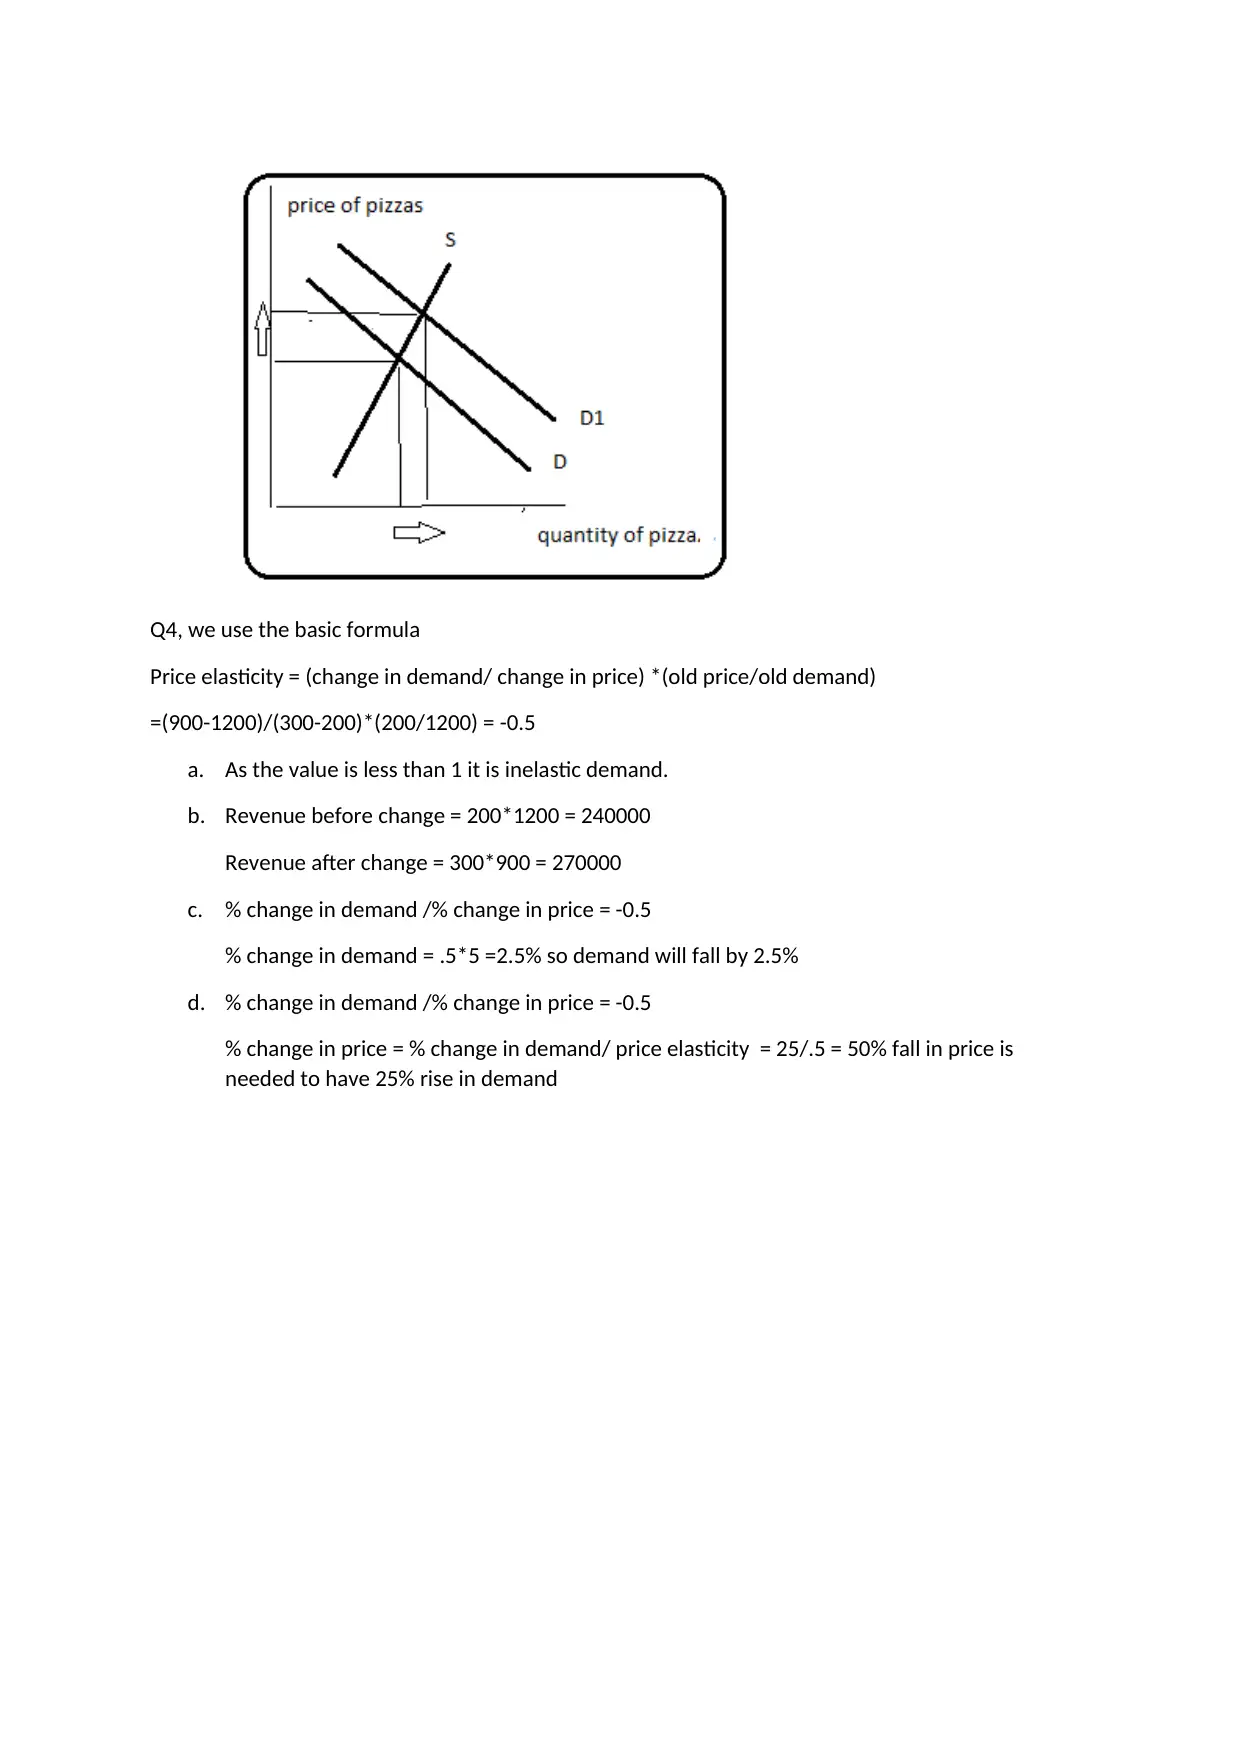
This document presents a detailed solution to an economics assignment, addressing questions related to demand and supply analysis, including shifts in demand and supply curves due to various factors. It analyzes the impact of changes in income, prices of substitute goods, input costs, and other determinants on market equilibrium. The solution also calculates and interprets price elasticity of demand, determining whether demand is elastic or inelastic and its effect on total revenue. The assignment covers different scenarios and provides graphical representations to illustrate the concepts, and the solution concludes with a calculation of the percentage change in demand and price based on the provided elasticity value. References from academic sources support the analysis.
Document Page
Q1
(Anon., n.d.)
a. We have a shift OF the demand curve, An increase in income will shift demand curve D
to right. Income is a demand determinant. Price and quantity will both rise as shown by
the arrows. (Gallo, 2015)
b. We have a shift along the demand curve from A to B .
c. Assuming pizzas and burgers are substitutes, we have an increase in demand for pizzas.
This is shown as a shift of the curve to right. Price and quantity will both rise as shown
by the arrows.
tabler-icon-diamond-filled.svg

Paraphrase This Document

Need a fresh take? Get an instant paraphrase of this document with our AI Paraphraser
Document Page
d. Flour is an input into pizzas. A rise in input costs will lower supply. This is shown as a
shift OF the supply curve to the left. Price will rise while quantity will fall.
e. Petrol prices have no impact on pizzas. They do not affect demand or supply of pizza.
f. Tomatoes are an ingredient in pizza making. A rise in input costs will lower supply. This
is shown as a shift OF the supply curve to the left. Price will rise while quantity will fall.
Document Page
g. This has no effect on pizza market. Climate control has no obvious connect with piozza.
h. An increase in immigrants means more demand for pizza. An increase in people asking
for pizza will shift demand curve D to right (D1).Price and quantity will both rise as
shown by the arrows.
i. Assuming the more efficient pizza machine will be used, this implies more pizzas can be
produced at same costs now. This amounts to an increase in supply. This is shown as a
shift OF the supply curve to the right. Price will fall while quantity will rise.
j. Assuming Coke is drunk with pizza, making them complementary goods. A fall in Coke
prices will increase demand for Coke and pizza. This is shown as a shift of the curve to
right. Price and quantity will both rise as shown by the arrows.
Document Page
Q4, we use the basic formula
Price elasticity = (change in demand/ change in price) *(old price/old demand)
=(900-1200)/(300-200)*(200/1200) = -0.5
a. As the value is less than 1 it is inelastic demand.
b. Revenue before change = 200*1200 = 240000
Revenue after change = 300*900 = 270000
c. % change in demand /% change in price = -0.5
% change in demand = .5*5 =2.5% so demand will fall by 2.5%
d. % change in demand /% change in price = -0.5
% change in price = % change in demand/ price elasticity = 25/.5 = 50% fall in price is
needed to have 25% rise in demand
tabler-icon-diamond-filled.svg

Paraphrase This Document

Need a fresh take? Get an instant paraphrase of this document with our AI Paraphraser
Document Page
REFERENCES
Gallo, A. (2015, August 21). A refresher of Price Elasticity . Retrieved August 20, 2017, from
https://hbr.org/2015/08/a-refresher-on-price-elasticity
harvest.cals.ncsu.edu. (n.d.). Retrieved August 19, 2017, from
https://harvest.cals.ncsu.edu/are201/lecture/lectur20.pdf
SSC.wisc.edu. (n.d.). Retrieved August 18, 2017, from
http://www.ssc.wisc.edu/~scholz/Teaching_101/Lecture3.pdf
Suman, S. (n.d.). Retrieved August 19, 2017, from
http://www.economicsdiscussion.net/demand/shifts-in-demand-and-supply-with-diagram/
12519
www3.nd.edu. (n.d.). Retrieved August 20, 2017, from
https://www3.nd.edu/~cwilber/econ504/504book/outln3a.html
chevron_up_icon
1 out of 5
circle_padding
hide_on_mobile
zoom_out_icon
[object Object]