Principles of Economics: Demand, Supply, and Elasticity Analysis

Verified

Added on  2022/09/30

|5
|736
|15
Homework Assignment
AI Summary
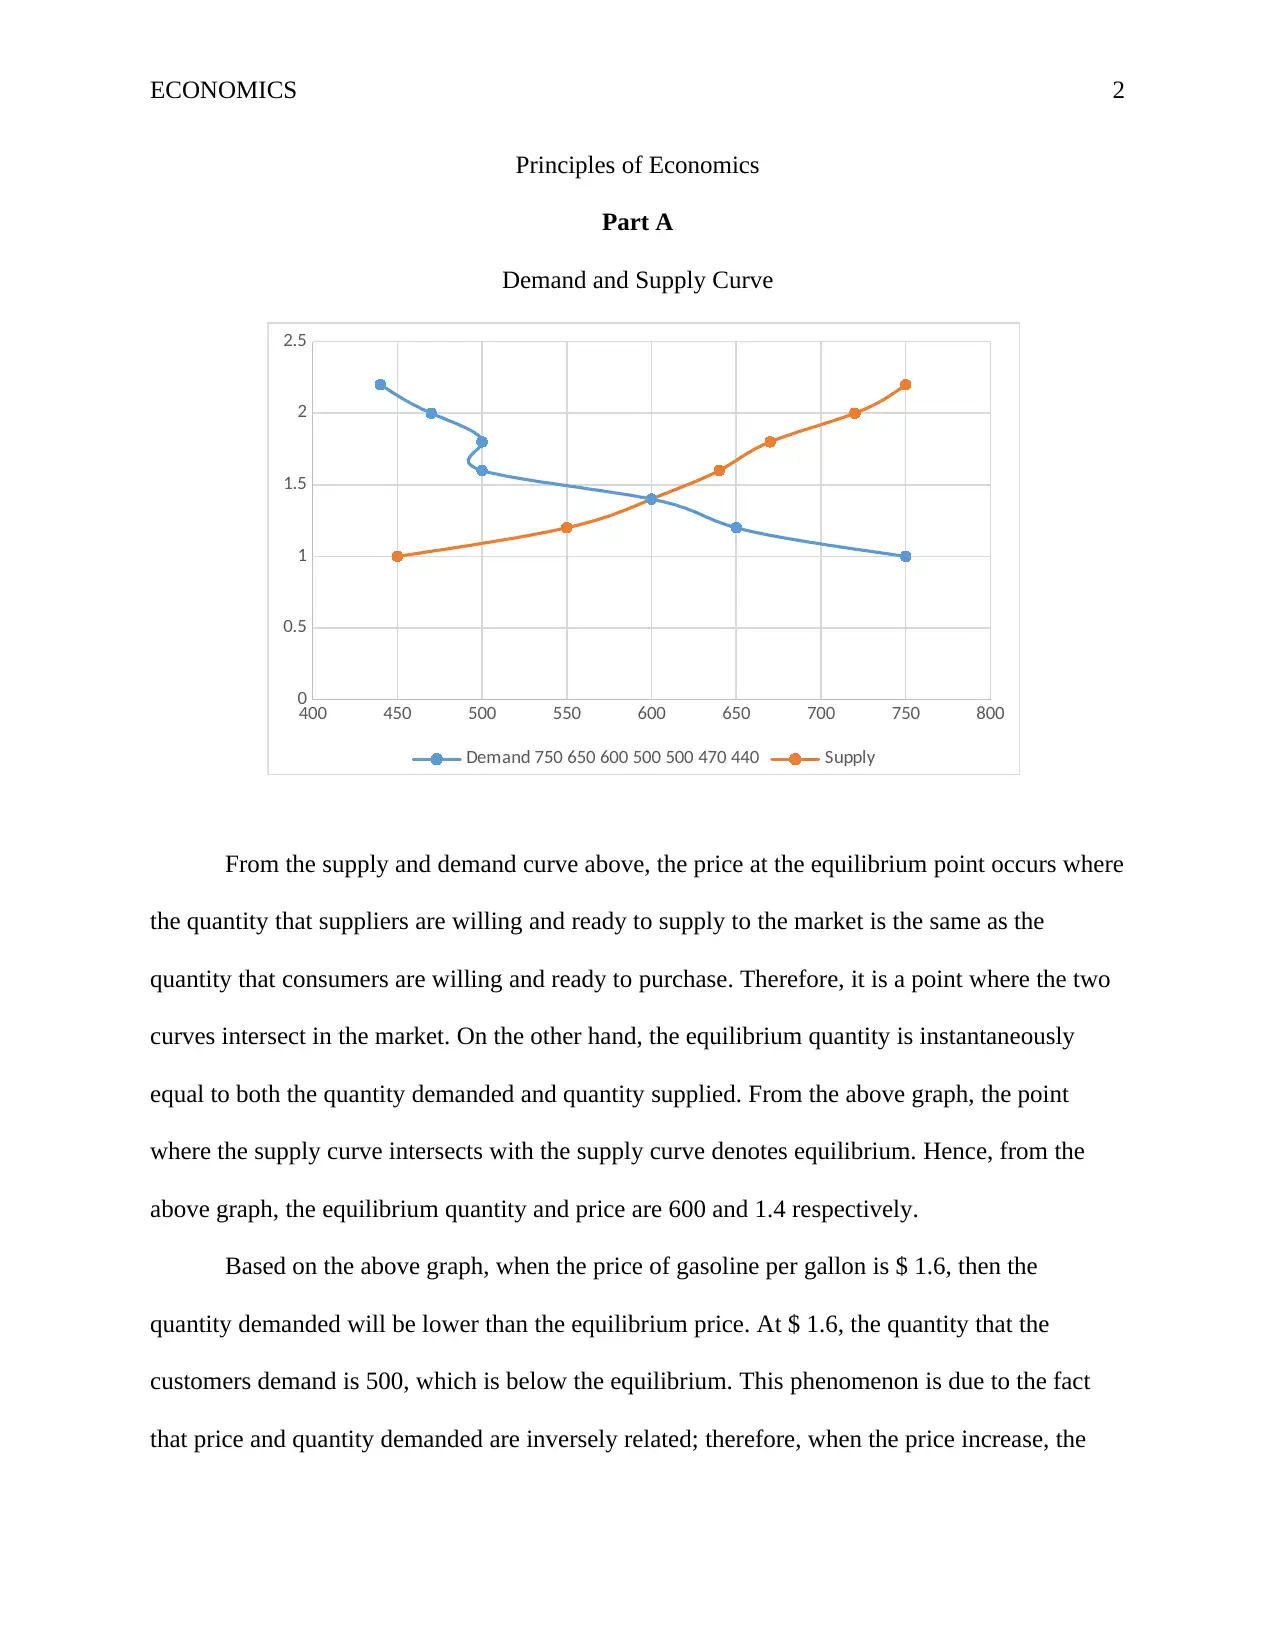
This economics assignment analyzes the relationship between demand and supply, determining the equilibrium price and quantity in the gasoline market. The assignment explores how changes in price affect the quantity demanded and supplied, identifying scenarios of surplus and shortage. Furthermore, the assignment delves into the concept of income elasticity of demand, examining how changes in consumer income influence the consumption of goods and services. It provides examples of income elastic, unit elastic, and income inelastic products, explaining the relationships between income and demand. The assignment uses a provided table to draw demand and supply schedules and analyze the market dynamics. The provided solution is a student submission to Desklib, a platform offering AI-powered study tools and resources for students.
Document Page
Running head: ECONOMICS 1
Principles of Economics
Student Name
Institution
tabler-icon-diamond-filled.svg

Paraphrase This Document

Need a fresh take? Get an instant paraphrase of this document with our AI Paraphraser
Document Page
ECONOMICS 2
Principles of Economics
Part A
Demand and Supply Curve
From the supply and demand curve above, the price at the equilibrium point occurs where
the quantity that suppliers are willing and ready to supply to the market is the same as the
quantity that consumers are willing and ready to purchase. Therefore, it is a point where the two
curves intersect in the market. On the other hand, the equilibrium quantity is instantaneously
equal to both the quantity demanded and quantity supplied. From the above graph, the point
where the supply curve intersects with the supply curve denotes equilibrium. Hence, from the
above graph, the equilibrium quantity and price are 600 and 1.4 respectively.
Based on the above graph, when the price of gasoline per gallon is $ 1.6, then the
quantity demanded will be lower than the equilibrium price. At $ 1.6, the quantity that the
customers demand is 500, which is below the equilibrium. This phenomenon is due to the fact
that price and quantity demanded are inversely related; therefore, when the price increase, the
400 450 500 550 600 650 700 750 800
0
0.5
1
1.5
2
2.5
Demand 750 650 600 500 500 470 440 Supply
Document Page
ECONOMICS 3
quantity that the consumers demand decreases. At $ 1.6, the quantity of gasoline at the market
will increase due to the direct relationship between the quantity supplied and the price. At higher
prices, the supplier will be willing to supply more. Hence, at a price of $1.6, suppliers are willing
to supply 640 units of gasoline, which is above the equilibrium point. If the suppliers are willing
and ready to supply 640 units of gasoline at $1.6, the market will have a surplus of (640-600) 40
units of gasoline. It is obtained by getting the difference between the surplus quantity supplied
and the equilibrium quantity.
Part B
Income elasticity of demand measures how the quantity that the consumer demand
change due to the changes in the real-time income of the consumer who consumes these goods or
services keeping all other factor constants (Havranek & Kokes, 2015). It is calculated by taking
the proportion change in the quantity demanded and dividing it by proportion variation in salary.
For instance, a product is said to be income elastic when there is a direct relationship between the
consumer income and the quantity which is demanded. In the scenario of elastic demand, the
relationship is positive. An example is a car. As the consumer income increase, one will increase
the consumption of the luxurious such as cars.
On the other hand, unit elastic occurs where the proportion change in the amount
demanded of a particular commodity is the same as the proportion change in the salary of the
consumer (Cherchye, Demuynck, & De Rock, 2018). Hence, the income elastic is equal to one.
For instance, when there is a 7% rise in the income of the consumer, the demand will also rise by
7%. Examples of commodities in this category include necessities. Lastly, in the case of the
income inelastic products, there is less change in the proportion of the amount demanded due to
the proportion change in the salary of the consumer. For example, a 6% rise in the income leads
Document Page
ECONOMICS 4
to a 2% rise in the quantity demanded. Examples of goods in this category include inferior
goods.
tabler-icon-diamond-filled.svg

Paraphrase This Document

Need a fresh take? Get an instant paraphrase of this document with our AI Paraphraser
Document Page
ECONOMICS 5
References
Azevedo, E. M., & Leshno, J. D. (2016). A supply and demand framework for two-sided
matching markets. Journal of Political Economy, 124(5), 1235-1268.
Burfisher, M. E. (2017). Introduction to computable general equilibrium models. Cambridge
University Press.
Cherchye, L., Demuynck, T., & De Rock, B. (2018). Normality of demand in a two-goods
setting. Journal of economic theory, 173, 361-382.
Havranek, T., & Kokes, O. (2015). Income elasticity of gasoline demand: A meta-
analysis. Energy Economics, 47, 77-86.
chevron_up_icon
1 out of 5
circle_padding
hide_on_mobile
zoom_out_icon
[object Object]