Impact of Demand & Supply on UK Food Industry: A Market Analysis
VerifiedAdded on 2022/12/27
|16
|3624
|72
Report
AI Summary
This report provides an in-depth analysis of the UK food industry, focusing on the interplay of demand and supply dynamics, particularly during the 2020 pandemic. It examines the impact of government interventions, such as lockdowns, on food production, distribution, and consumption. The report explores the concepts of supply and demand curves, illustrating movements and shifts with graphical representations. It highlights market failures, including food wastage and shortages, and discusses the factors contributing to these issues. Furthermore, the report analyzes equilibrium price and quantity, surplus, and shortage scenarios. It concludes by assessing the government policies implemented to mitigate market failures and stabilize the food industry. The report uses examples to provide a thorough understanding of the economic principles affecting the UK food sector.
Economics for Business
Paraphrase This Document
Need a fresh take? Get an instant paraphrase of this document with our AI Paraphraser
Table of Contents
INTRODUCTION...........................................................................................................................3
MAIN BODY..................................................................................................................................3
Task 1...............................................................................................................................................3
Task 2.............................................................................................................................................10
CONCLUSION..............................................................................................................................12
REFERENCES................................................................................................................................1
Executive Summary
The report has been indicating that how the demand and supply curve affect the food
industry of the UK. The report has been state that during this pandemic situation, the food
industries of UK faces the excess production of the products which are unable to reach to the
ultimate customers. It is because of the non-availability of transportation facility in the lock-
down. The food industries face lots of challenges and loss in this situation. The report has been
also state that the demand of the food products goes high after the lock-down lifted by the
government. And the food industries are unable to meet and fulfil their demand because of the
lack of material available with them. The report has been highlighting the reason behind the
market failure of UK and the different policies which the government of UK launches in order to
cope with the market failures.
⊘ This is a preview!⊘
Do you want full access?
Subscribe today to unlock all pages.
Trusted by 1+ million students worldwide
INTRODUCTION
During this pandemic situation in the year 2020, because of the government intervention
to close all the industry including food services business in order to minimize the spread of
COVID-19 lead to wastage of various food supplies. Because of this wide wastage of food
supplies in the UK causes that the manufacturer and retailers of the UK country being left with
the surplus stock. So, the report will discuss the demand and supply principles with the help of
demand and supply graphs and market failures along with the implementation of government
policies to correct the market failures.
MAIN BODY
Task 1
Supply curve
It is present in the graphical format which shows the relationship between the quantity
supplied and price of the goods and services. Quantity supplied and price of goods and services
have a direct relation with each other (Xu, Z Yin, and Ye, 2020). For example, higher quantity
will produce, if the price of the commodity is high and lesser quantity will produce, if the price
of the commodity is low.
Movement along a supply curve
When changes occur in the quantity supplied and the price of the commodity (estimating
all other non-price factors remain constant), then presentation of such changes on the graphical
format is known as the movement along a supply curve (Butt, and et.al 2020). As there is a direct
relation between the quantity supplied and price, so the graph shows the upward slope.
The movement on supply curve is of two type i.e. extension and contraction. If the
quantity supplied and the price of the commodity increases, then it is known as extension in the
supply curve. If the quantity supplied and price of the commodity decreases, then it is known as
contraction in the supply curve.
Example of a supply schedule of UK food industry and graphical presentation of supply curve.
Fig. I: Illustration
Price of Rice per Kg Quantity supplied in
Kg
Fall in quantity supplied
due to increase in cost
of production
Rise in quantity
supplied due to
technology
Paraphrase This Document
Need a fresh take? Get an instant paraphrase of this document with our AI Paraphraser
improvement
100 100 90 110
110 120 100 130
120 130 110 140
130 140 120 150
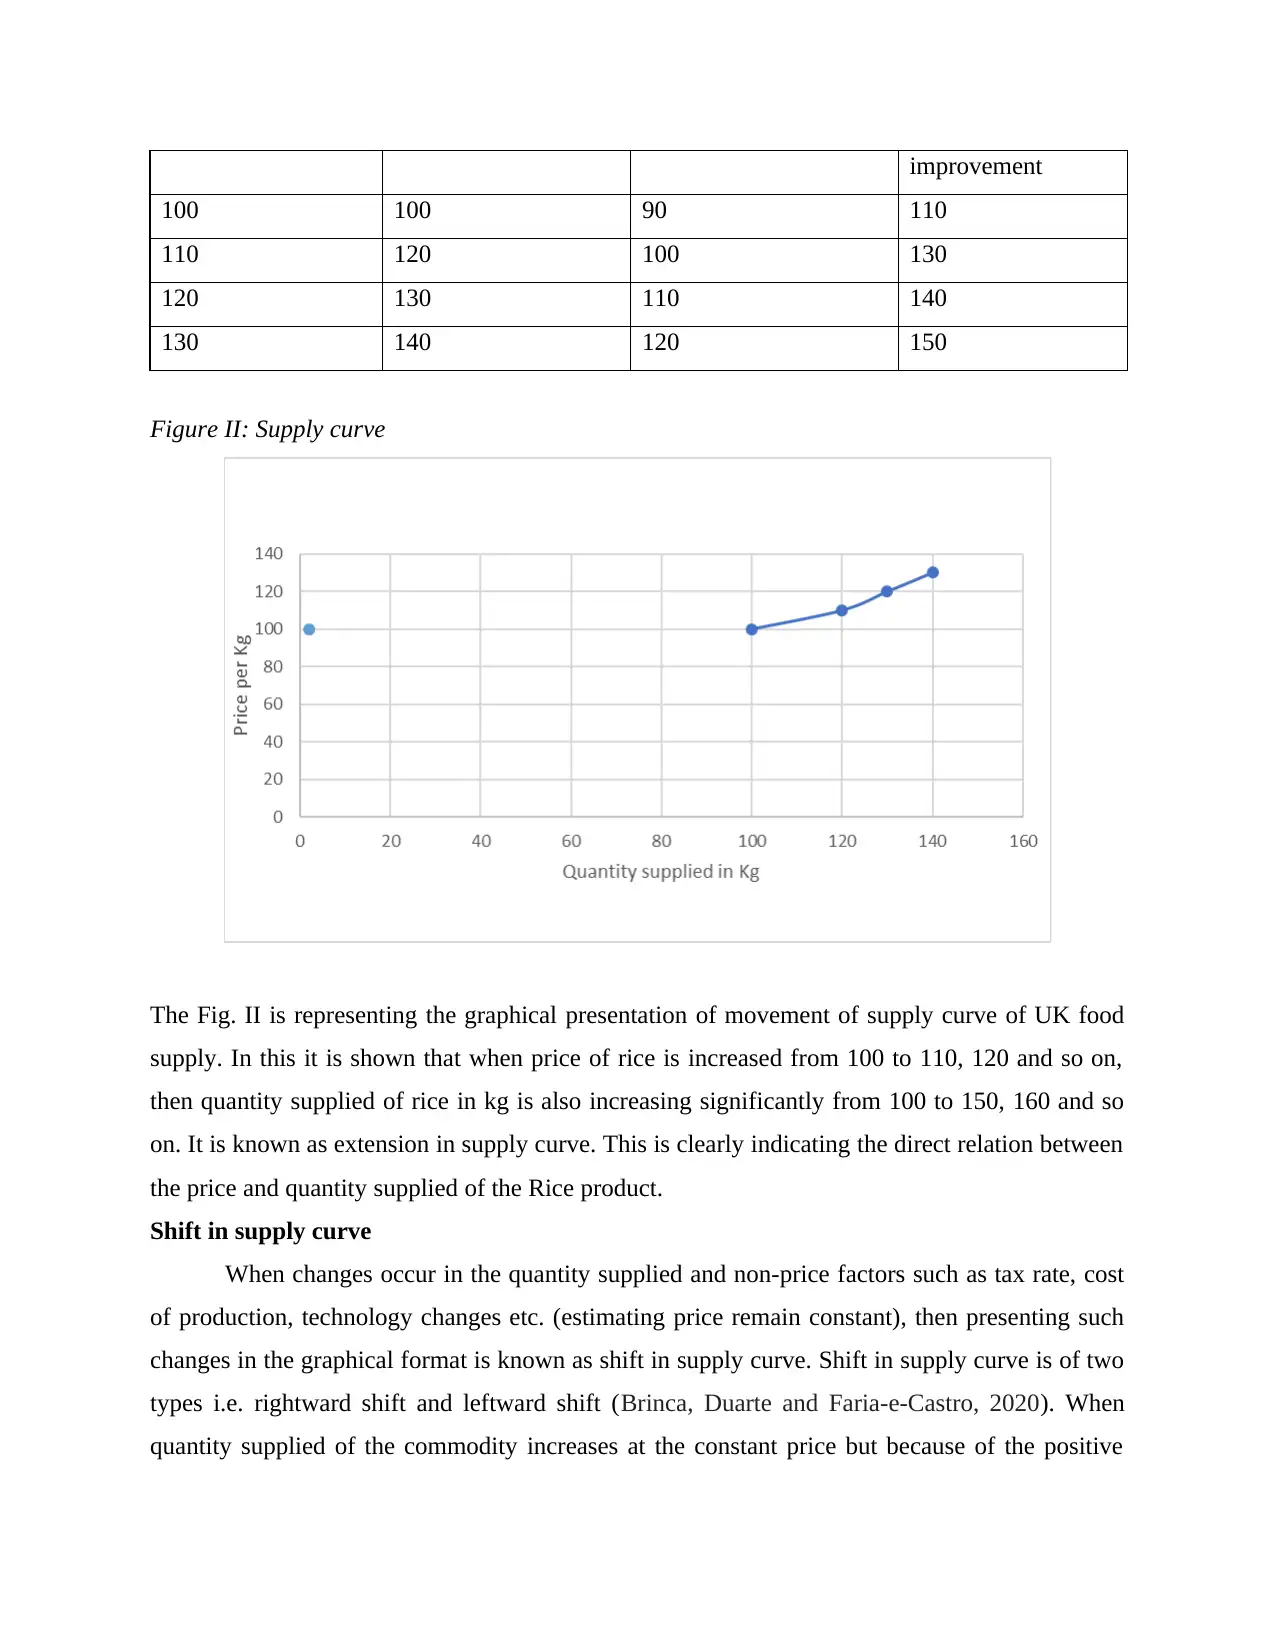
Figure II: Supply curve
The Fig. II is representing the graphical presentation of movement of supply curve of UK food
supply. In this it is shown that when price of rice is increased from 100 to 110, 120 and so on,
then quantity supplied of rice in kg is also increasing significantly from 100 to 150, 160 and so
on. It is known as extension in supply curve. This is clearly indicating the direct relation between
the price and quantity supplied of the Rice product.
Shift in supply curve
When changes occur in the quantity supplied and non-price factors such as tax rate, cost
of production, technology changes etc. (estimating price remain constant), then presenting such
changes in the graphical format is known as shift in supply curve. Shift in supply curve is of two
types i.e. rightward shift and leftward shift (Brinca, Duarte and Faria-e-Castro, 2020). When
quantity supplied of the commodity increases at the constant price but because of the positive
100 100 90 110
110 120 100 130
120 130 110 140
130 140 120 150
Figure II: Supply curve
The Fig. II is representing the graphical presentation of movement of supply curve of UK food
supply. In this it is shown that when price of rice is increased from 100 to 110, 120 and so on,
then quantity supplied of rice in kg is also increasing significantly from 100 to 150, 160 and so
on. It is known as extension in supply curve. This is clearly indicating the direct relation between
the price and quantity supplied of the Rice product.
Shift in supply curve
When changes occur in the quantity supplied and non-price factors such as tax rate, cost
of production, technology changes etc. (estimating price remain constant), then presenting such
changes in the graphical format is known as shift in supply curve. Shift in supply curve is of two
types i.e. rightward shift and leftward shift (Brinca, Duarte and Faria-e-Castro, 2020). When
quantity supplied of the commodity increases at the constant price but because of the positive
changes in the non-price factor, then it is known as rightward shift in supply curve. And when
quantity supplied decreases at the same price but because of negative changes in the non-price
factor, then it is known as leftward shift.
Example of graphical presentation of Rightward shift and leftward shift in supply curve.
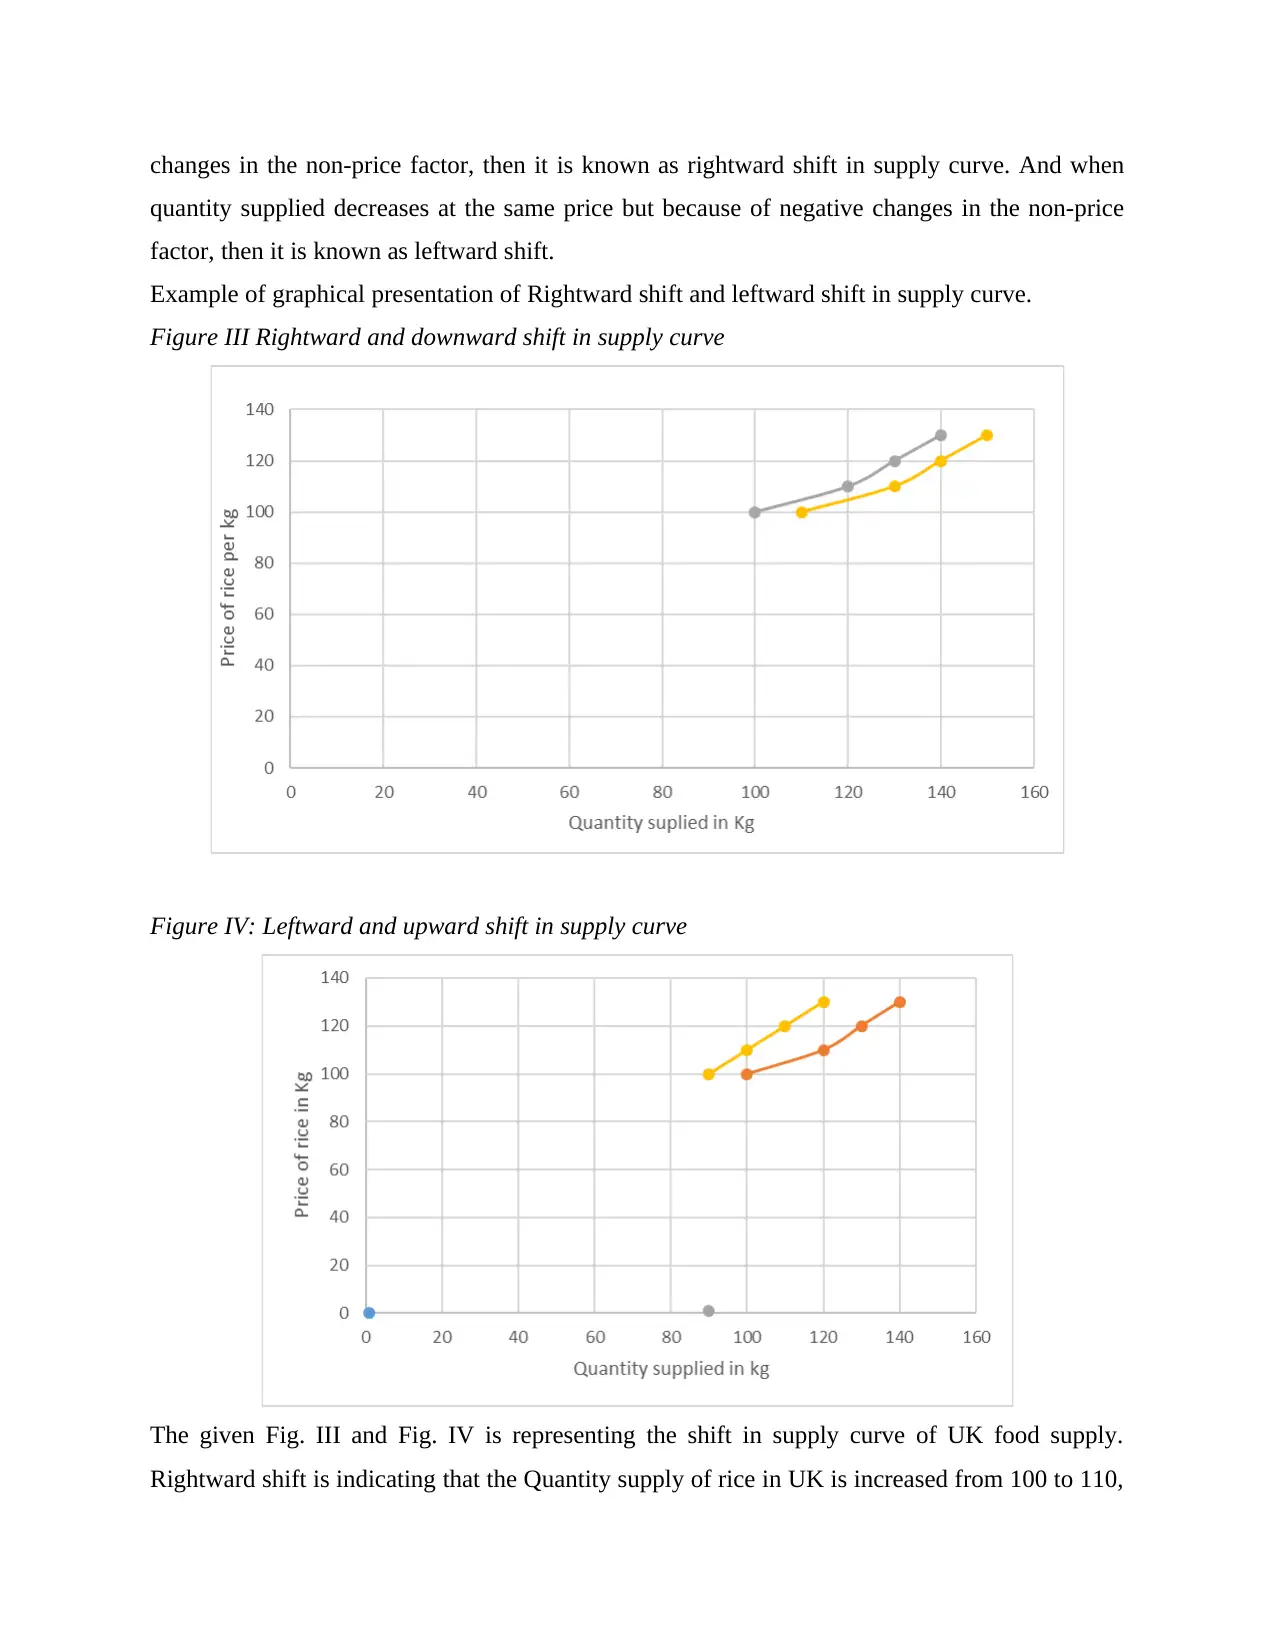
Figure III Rightward and downward shift in supply curve
Figure IV: Leftward and upward shift in supply curve
The given Fig. III and Fig. IV is representing the shift in supply curve of UK food supply.
Rightward shift is indicating that the Quantity supply of rice in UK is increased from 100 to 110,
quantity supplied decreases at the same price but because of negative changes in the non-price
factor, then it is known as leftward shift.
Example of graphical presentation of Rightward shift and leftward shift in supply curve.
Figure III Rightward and downward shift in supply curve
Figure IV: Leftward and upward shift in supply curve
The given Fig. III and Fig. IV is representing the shift in supply curve of UK food supply.
Rightward shift is indicating that the Quantity supply of rice in UK is increased from 100 to 110,
⊘ This is a preview!⊘
Do you want full access?
Subscribe today to unlock all pages.
Trusted by 1+ million students worldwide
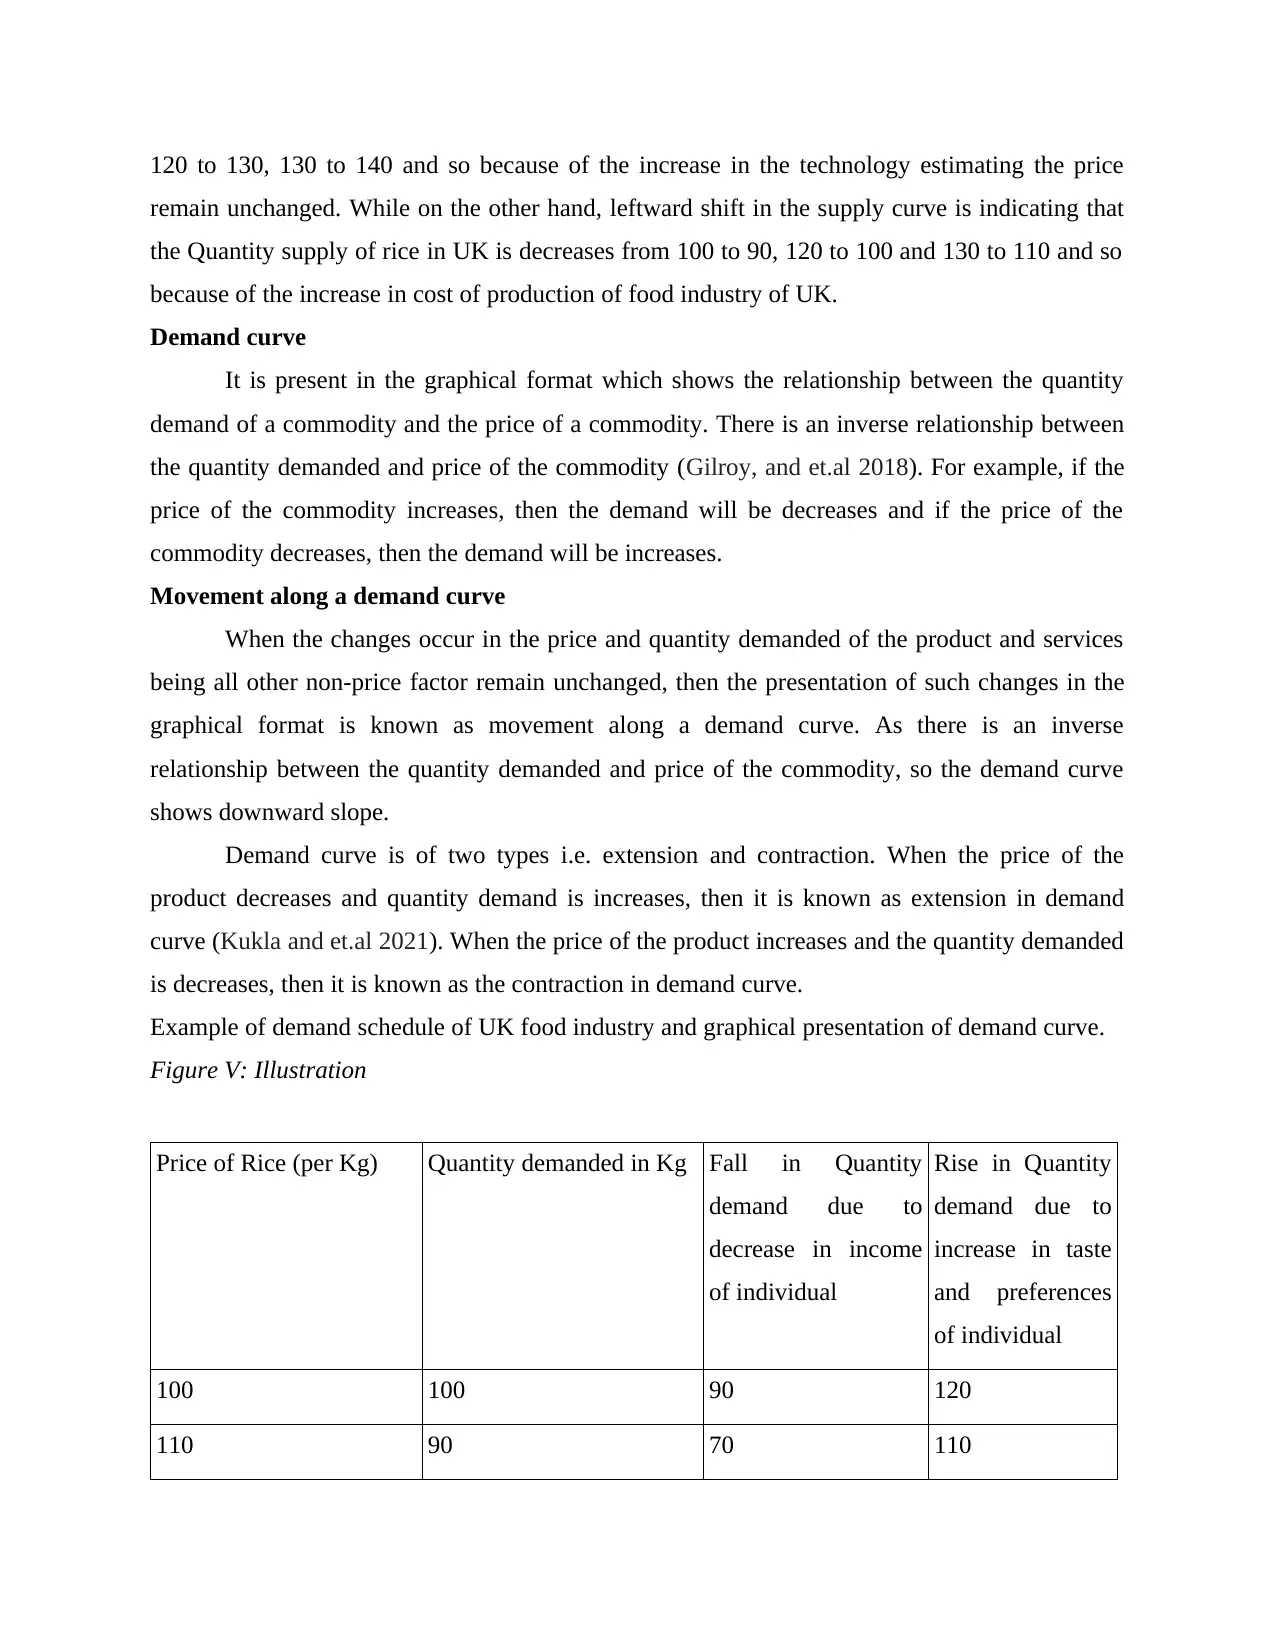
120 to 130, 130 to 140 and so because of the increase in the technology estimating the price
remain unchanged. While on the other hand, leftward shift in the supply curve is indicating that
the Quantity supply of rice in UK is decreases from 100 to 90, 120 to 100 and 130 to 110 and so
because of the increase in cost of production of food industry of UK.
Demand curve
It is present in the graphical format which shows the relationship between the quantity
demand of a commodity and the price of a commodity. There is an inverse relationship between
the quantity demanded and price of the commodity (Gilroy, and et.al 2018). For example, if the
price of the commodity increases, then the demand will be decreases and if the price of the
commodity decreases, then the demand will be increases.
Movement along a demand curve
When the changes occur in the price and quantity demanded of the product and services
being all other non-price factor remain unchanged, then the presentation of such changes in the
graphical format is known as movement along a demand curve. As there is an inverse
relationship between the quantity demanded and price of the commodity, so the demand curve
shows downward slope.
Demand curve is of two types i.e. extension and contraction. When the price of the
product decreases and quantity demand is increases, then it is known as extension in demand
curve (Kukla and et.al 2021). When the price of the product increases and the quantity demanded
is decreases, then it is known as the contraction in demand curve.
Example of demand schedule of UK food industry and graphical presentation of demand curve.
Figure V: Illustration
Price of Rice (per Kg) Quantity demanded in Kg Fall in Quantity
demand due to
decrease in income
of individual
Rise in Quantity
demand due to
increase in taste
and preferences
of individual
100 100 90 120
110 90 70 110
Paraphrase This Document
Need a fresh take? Get an instant paraphrase of this document with our AI Paraphraser
120 80 60 90
130 70 50 80
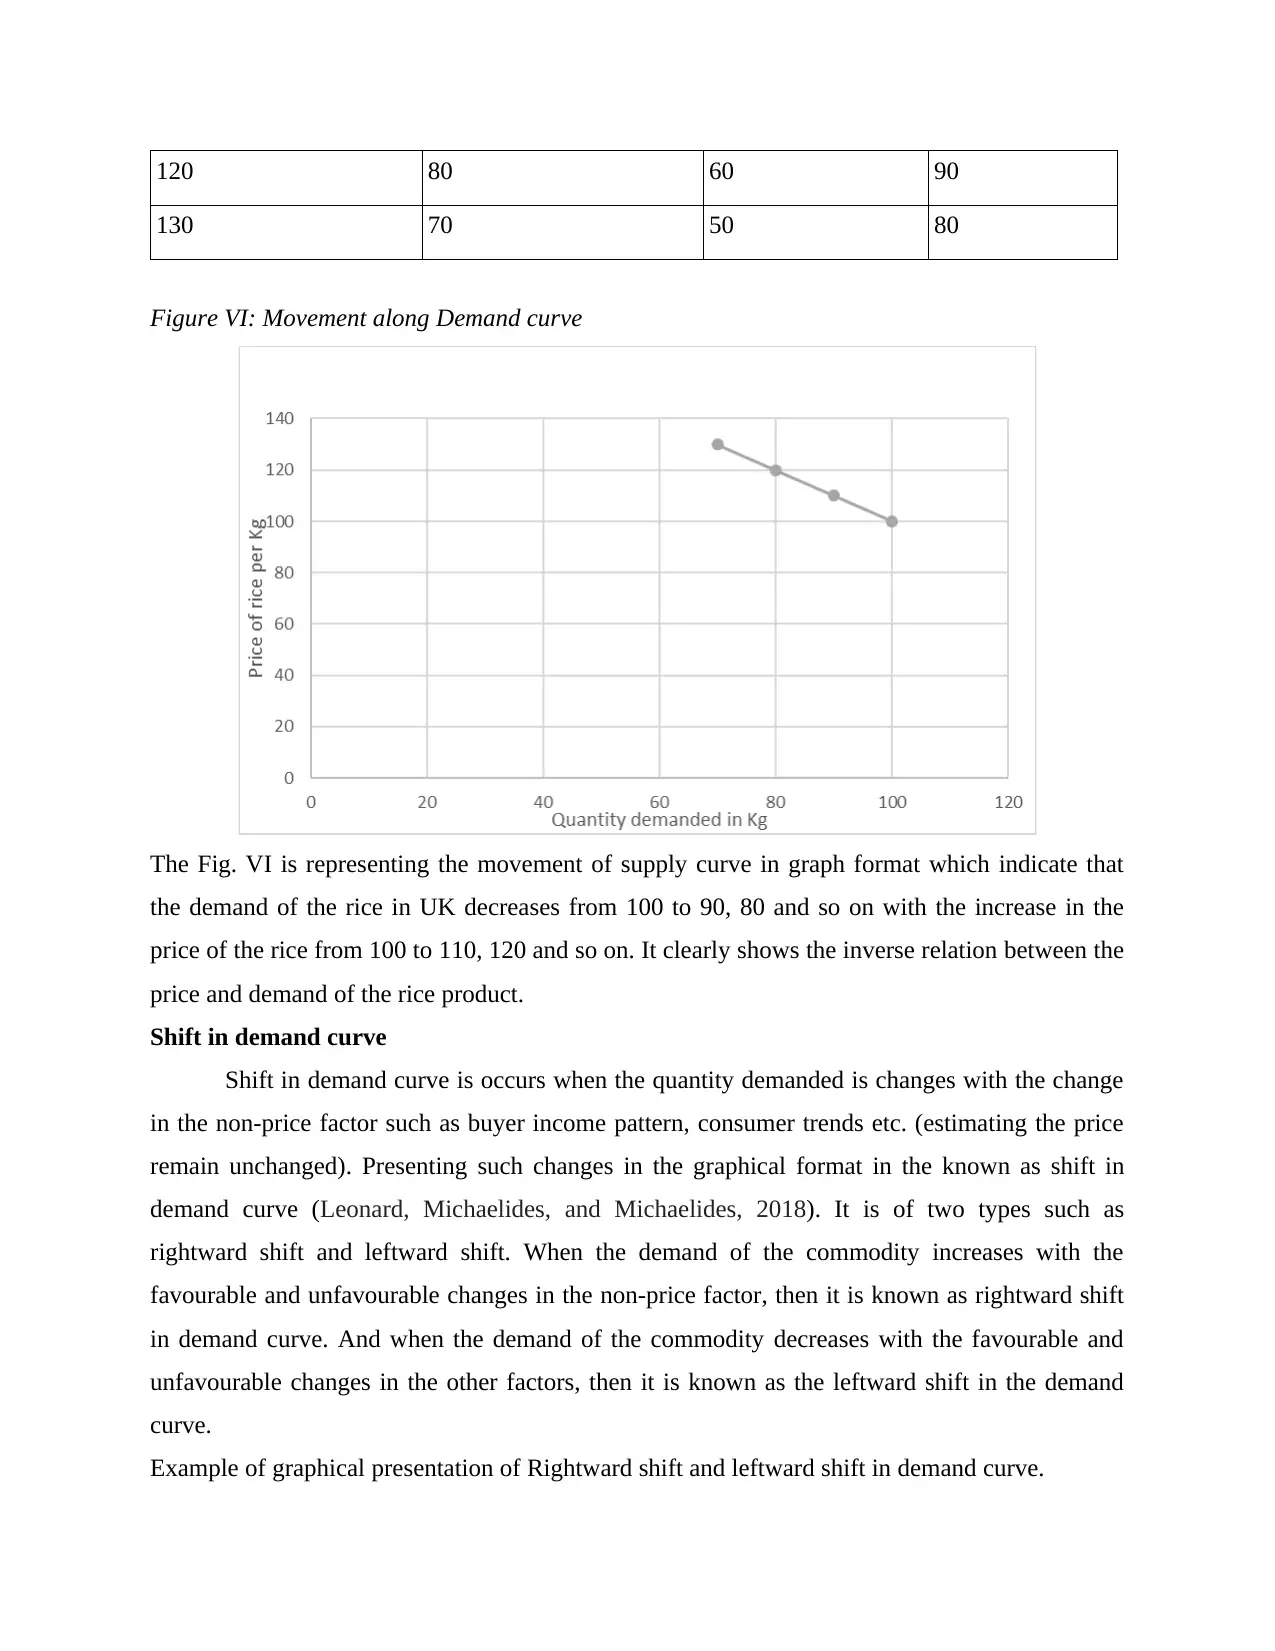
Figure VI: Movement along Demand curve
The Fig. VI is representing the movement of supply curve in graph format which indicate that
the demand of the rice in UK decreases from 100 to 90, 80 and so on with the increase in the
price of the rice from 100 to 110, 120 and so on. It clearly shows the inverse relation between the
price and demand of the rice product.
Shift in demand curve
Shift in demand curve is occurs when the quantity demanded is changes with the change
in the non-price factor such as buyer income pattern, consumer trends etc. (estimating the price
remain unchanged). Presenting such changes in the graphical format in the known as shift in
demand curve (Leonard, Michaelides, and Michaelides, 2018). It is of two types such as
rightward shift and leftward shift. When the demand of the commodity increases with the
favourable and unfavourable changes in the non-price factor, then it is known as rightward shift
in demand curve. And when the demand of the commodity decreases with the favourable and
unfavourable changes in the other factors, then it is known as the leftward shift in the demand
curve.
Example of graphical presentation of Rightward shift and leftward shift in demand curve.
130 70 50 80
Figure VI: Movement along Demand curve
The Fig. VI is representing the movement of supply curve in graph format which indicate that
the demand of the rice in UK decreases from 100 to 90, 80 and so on with the increase in the
price of the rice from 100 to 110, 120 and so on. It clearly shows the inverse relation between the
price and demand of the rice product.
Shift in demand curve
Shift in demand curve is occurs when the quantity demanded is changes with the change
in the non-price factor such as buyer income pattern, consumer trends etc. (estimating the price
remain unchanged). Presenting such changes in the graphical format in the known as shift in
demand curve (Leonard, Michaelides, and Michaelides, 2018). It is of two types such as
rightward shift and leftward shift. When the demand of the commodity increases with the
favourable and unfavourable changes in the non-price factor, then it is known as rightward shift
in demand curve. And when the demand of the commodity decreases with the favourable and
unfavourable changes in the other factors, then it is known as the leftward shift in the demand
curve.
Example of graphical presentation of Rightward shift and leftward shift in demand curve.
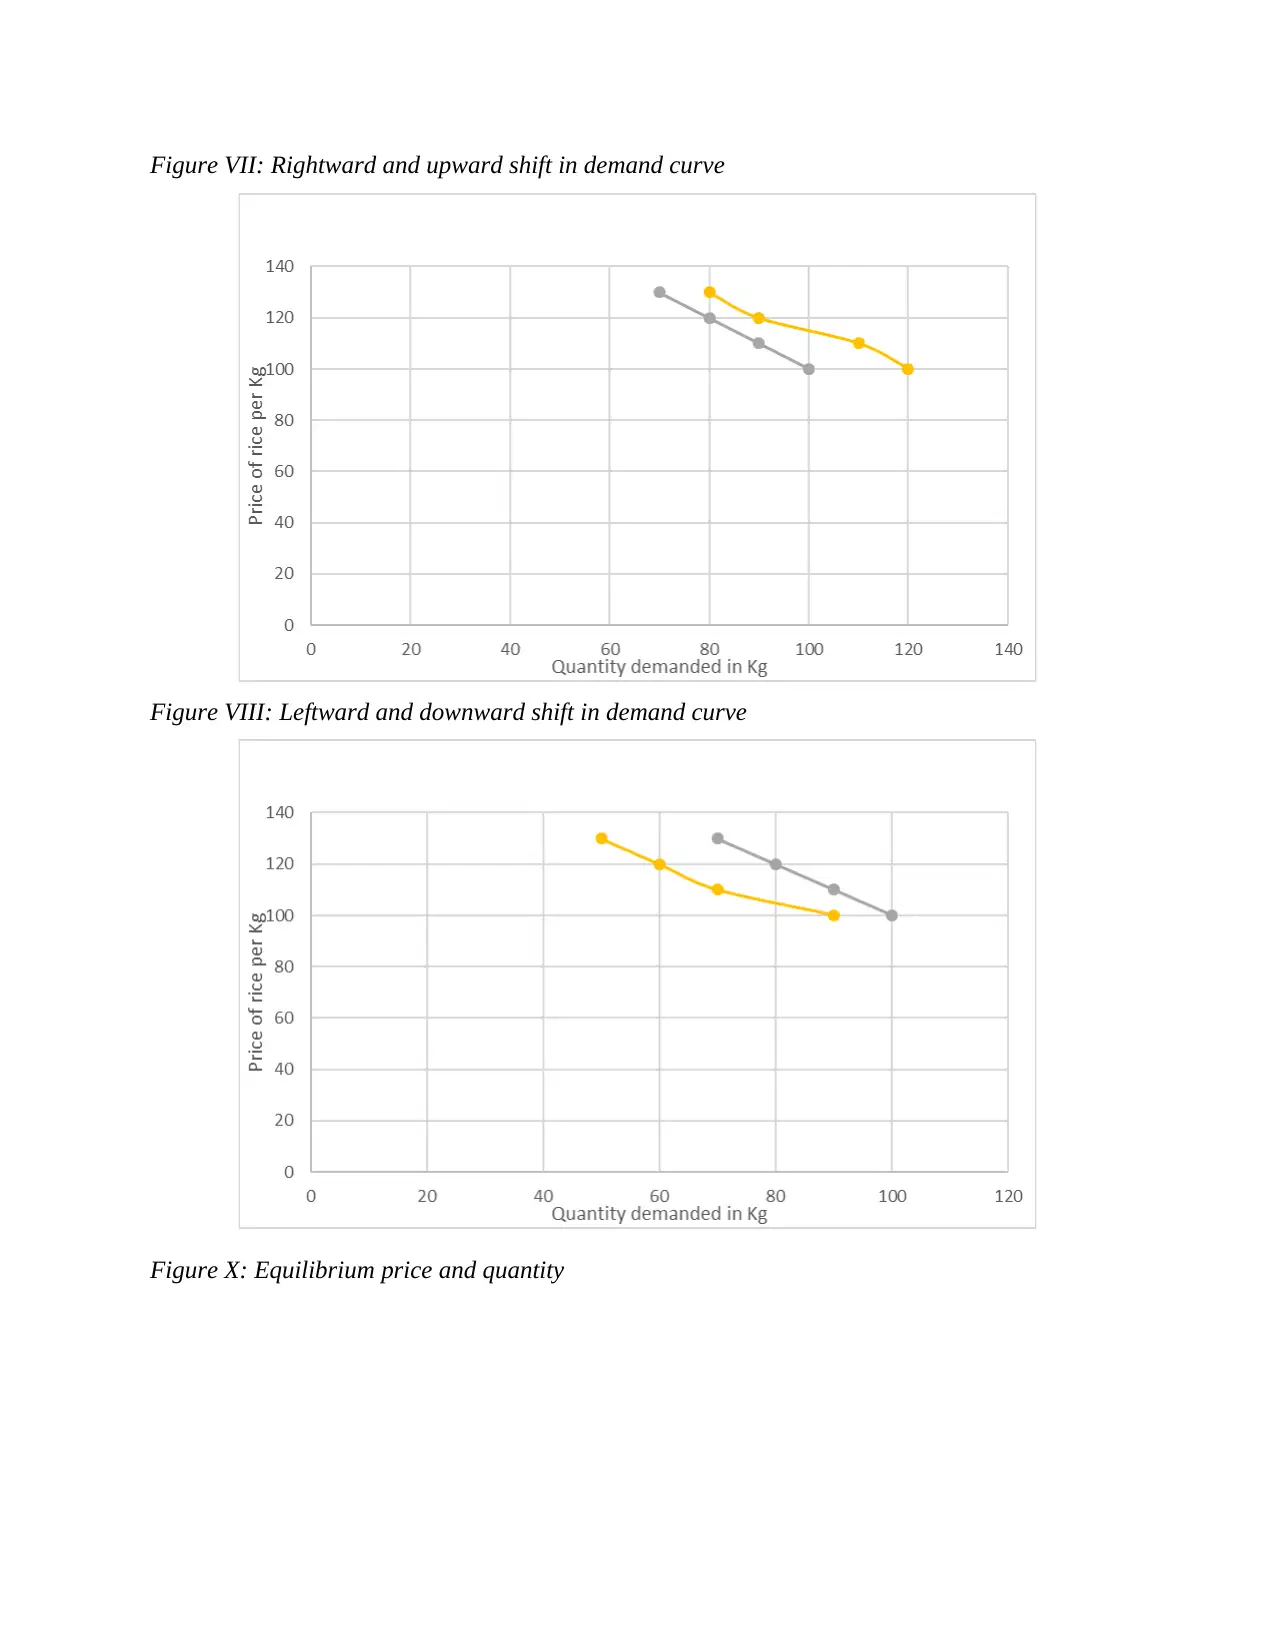
Figure VII: Rightward and upward shift in demand curve
Figure VIII: Leftward and downward shift in demand curve
Figure X: Equilibrium price and quantity
Figure VIII: Leftward and downward shift in demand curve
Figure X: Equilibrium price and quantity
⊘ This is a preview!⊘
Do you want full access?
Subscribe today to unlock all pages.
Trusted by 1+ million students worldwide
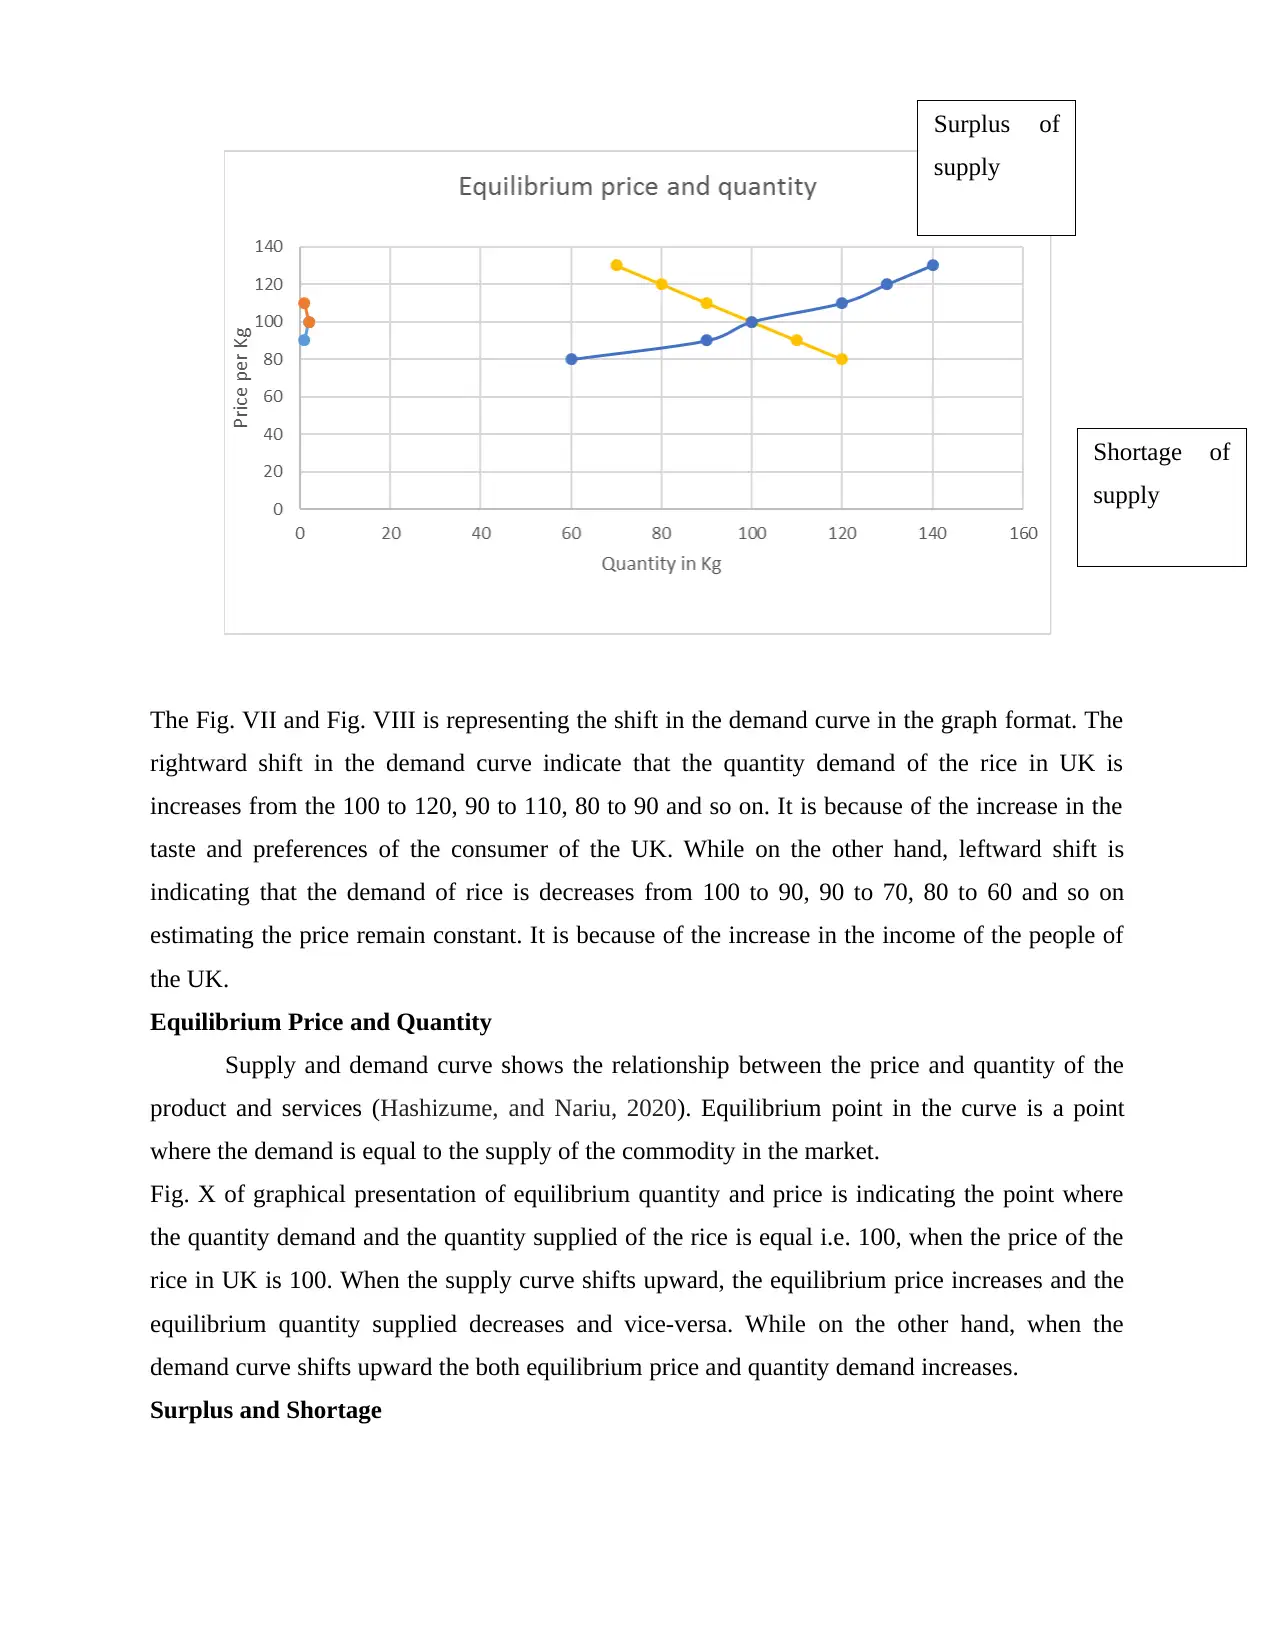
The Fig. VII and Fig. VIII is representing the shift in the demand curve in the graph format. The
rightward shift in the demand curve indicate that the quantity demand of the rice in UK is
increases from the 100 to 120, 90 to 110, 80 to 90 and so on. It is because of the increase in the
taste and preferences of the consumer of the UK. While on the other hand, leftward shift is
indicating that the demand of rice is decreases from 100 to 90, 90 to 70, 80 to 60 and so on
estimating the price remain constant. It is because of the increase in the income of the people of
the UK.
Equilibrium Price and Quantity
Supply and demand curve shows the relationship between the price and quantity of the
product and services (Hashizume, and Nariu, 2020). Equilibrium point in the curve is a point
where the demand is equal to the supply of the commodity in the market.
Fig. X of graphical presentation of equilibrium quantity and price is indicating the point where
the quantity demand and the quantity supplied of the rice is equal i.e. 100, when the price of the
rice in UK is 100. When the supply curve shifts upward, the equilibrium price increases and the
equilibrium quantity supplied decreases and vice-versa. While on the other hand, when the
demand curve shifts upward the both equilibrium price and quantity demand increases.
Surplus and Shortage
Surplus of
supply
Shortage of
supply
Paraphrase This Document
Need a fresh take? Get an instant paraphrase of this document with our AI Paraphraser
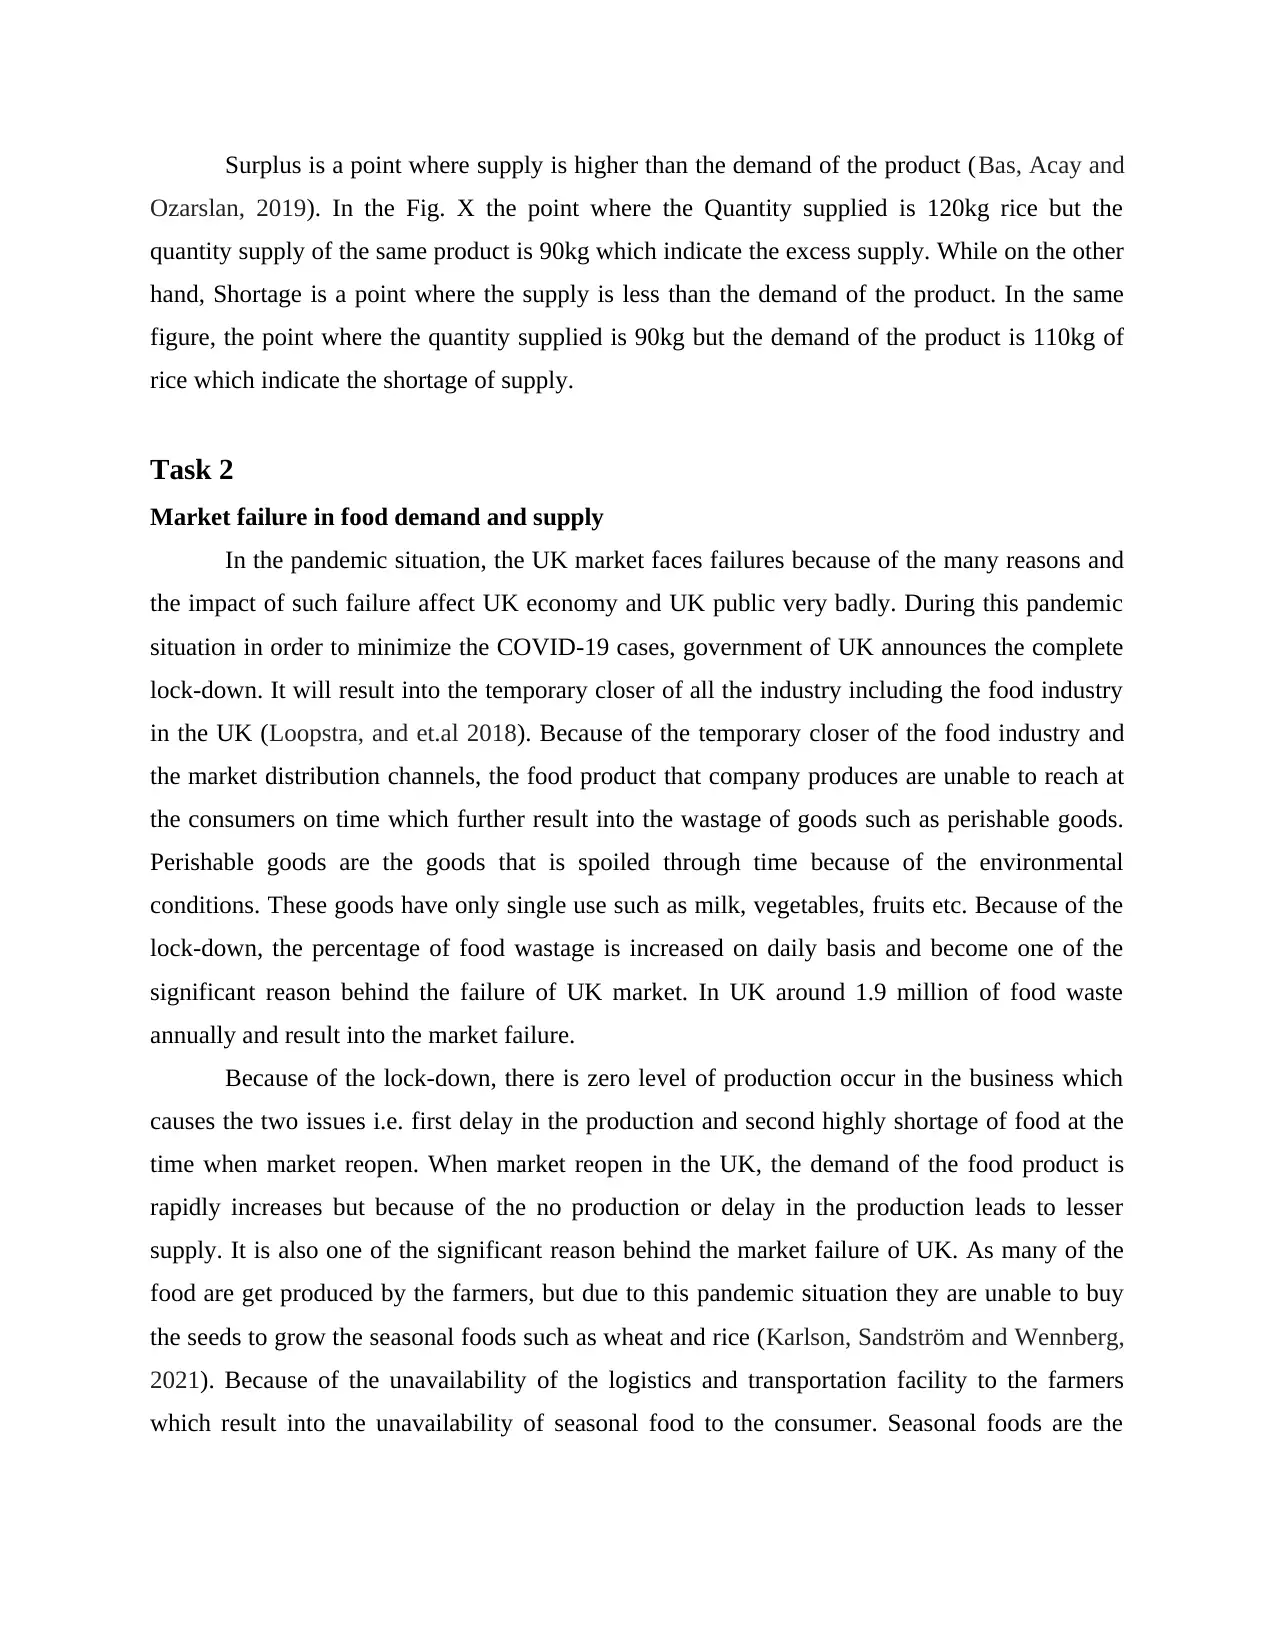
Surplus is a point where supply is higher than the demand of the product (Bas, Acay and
Ozarslan, 2019). In the Fig. X the point where the Quantity supplied is 120kg rice but the
quantity supply of the same product is 90kg which indicate the excess supply. While on the other
hand, Shortage is a point where the supply is less than the demand of the product. In the same
figure, the point where the quantity supplied is 90kg but the demand of the product is 110kg of
rice which indicate the shortage of supply.
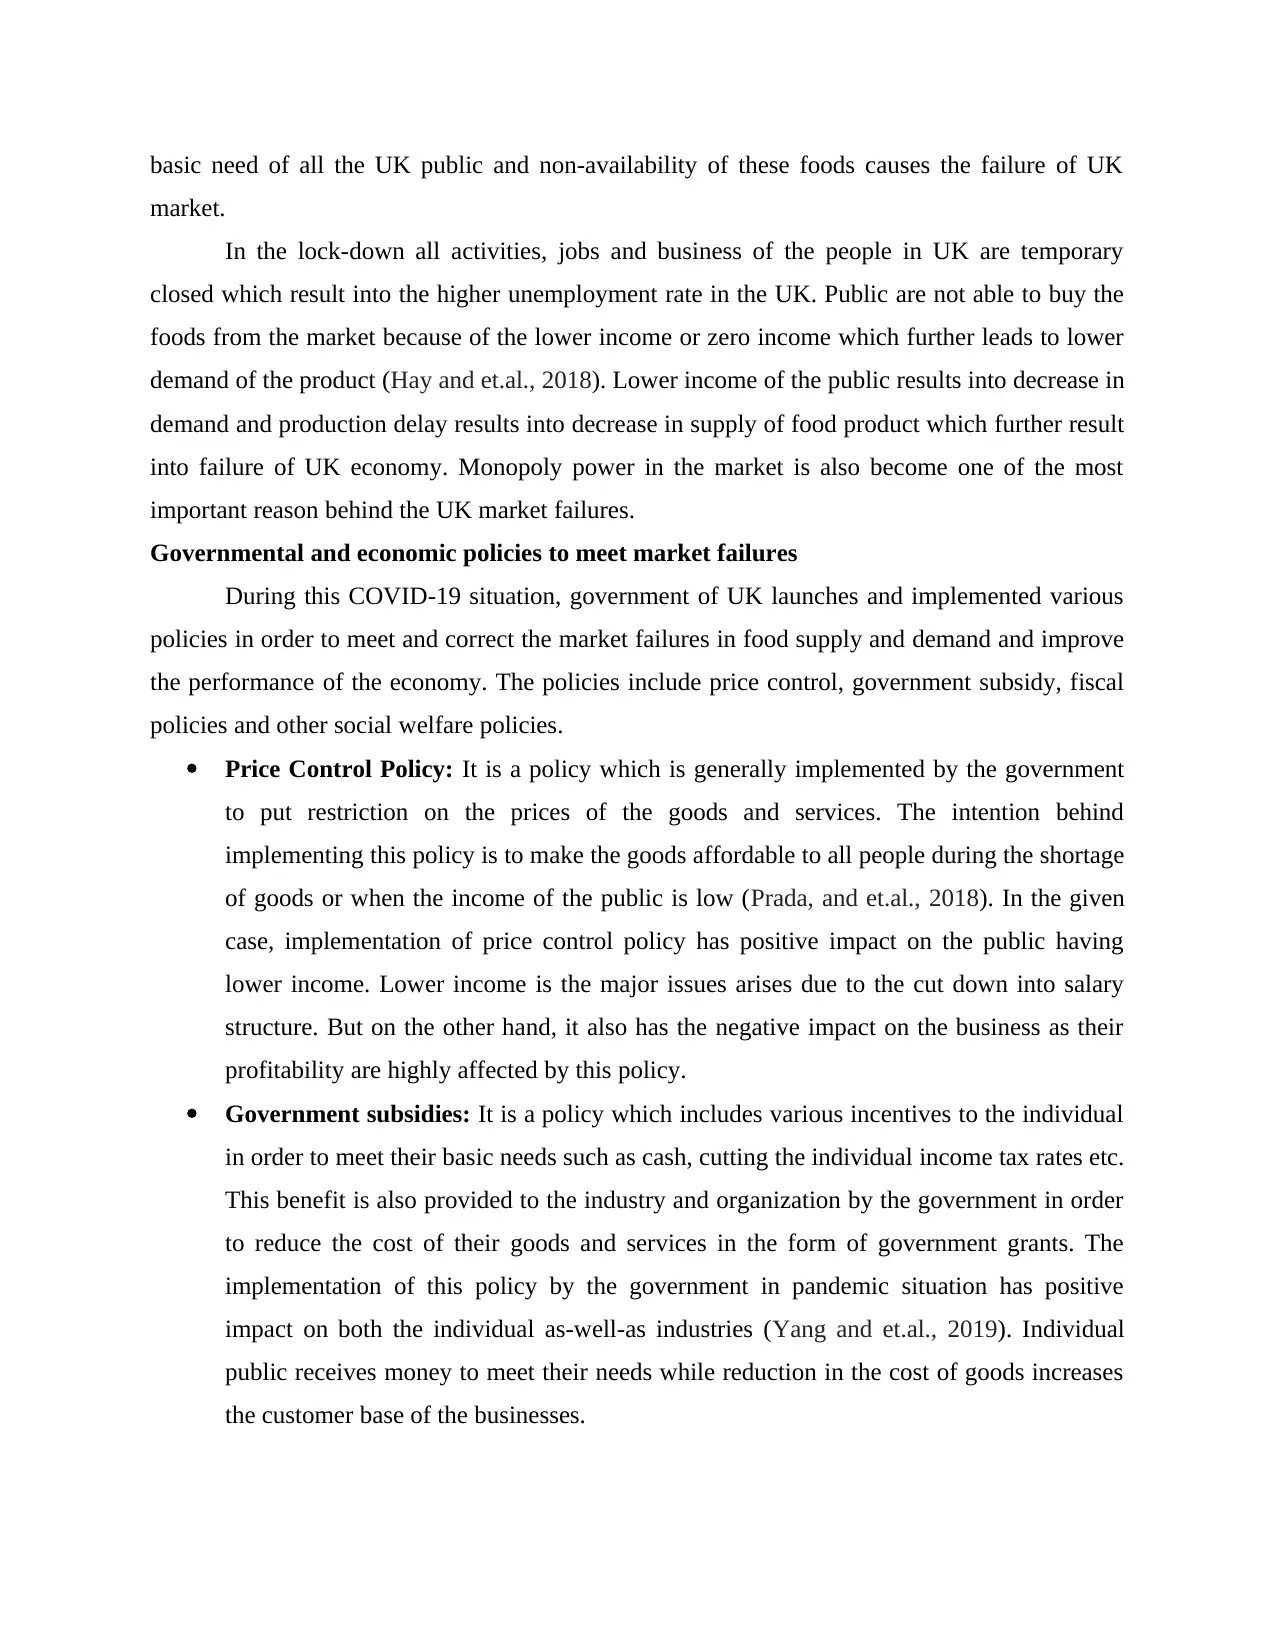
Task 2
Market failure in food demand and supply
In the pandemic situation, the UK market faces failures because of the many reasons and
the impact of such failure affect UK economy and UK public very badly. During this pandemic
situation in order to minimize the COVID-19 cases, government of UK announces the complete
lock-down. It will result into the temporary closer of all the industry including the food industry
in the UK (Loopstra, and et.al 2018). Because of the temporary closer of the food industry and
the market distribution channels, the food product that company produces are unable to reach at
the consumers on time which further result into the wastage of goods such as perishable goods.
Perishable goods are the goods that is spoiled through time because of the environmental
conditions. These goods have only single use such as milk, vegetables, fruits etc. Because of the
lock-down, the percentage of food wastage is increased on daily basis and become one of the
significant reason behind the failure of UK market. In UK around 1.9 million of food waste
annually and result into the market failure.
Because of the lock-down, there is zero level of production occur in the business which
causes the two issues i.e. first delay in the production and second highly shortage of food at the
time when market reopen. When market reopen in the UK, the demand of the food product is
rapidly increases but because of the no production or delay in the production leads to lesser
supply. It is also one of the significant reason behind the market failure of UK. As many of the
food are get produced by the farmers, but due to this pandemic situation they are unable to buy
the seeds to grow the seasonal foods such as wheat and rice (Karlson, Sandström and Wennberg,
2021). Because of the unavailability of the logistics and transportation facility to the farmers
which result into the unavailability of seasonal food to the consumer. Seasonal foods are the
Ozarslan, 2019). In the Fig. X the point where the Quantity supplied is 120kg rice but the
quantity supply of the same product is 90kg which indicate the excess supply. While on the other
hand, Shortage is a point where the supply is less than the demand of the product. In the same
figure, the point where the quantity supplied is 90kg but the demand of the product is 110kg of
rice which indicate the shortage of supply.
Task 2
Market failure in food demand and supply
In the pandemic situation, the UK market faces failures because of the many reasons and
the impact of such failure affect UK economy and UK public very badly. During this pandemic
situation in order to minimize the COVID-19 cases, government of UK announces the complete
lock-down. It will result into the temporary closer of all the industry including the food industry
in the UK (Loopstra, and et.al 2018). Because of the temporary closer of the food industry and
the market distribution channels, the food product that company produces are unable to reach at
the consumers on time which further result into the wastage of goods such as perishable goods.
Perishable goods are the goods that is spoiled through time because of the environmental
conditions. These goods have only single use such as milk, vegetables, fruits etc. Because of the
lock-down, the percentage of food wastage is increased on daily basis and become one of the
significant reason behind the failure of UK market. In UK around 1.9 million of food waste
annually and result into the market failure.
Because of the lock-down, there is zero level of production occur in the business which
causes the two issues i.e. first delay in the production and second highly shortage of food at the
time when market reopen. When market reopen in the UK, the demand of the food product is
rapidly increases but because of the no production or delay in the production leads to lesser
supply. It is also one of the significant reason behind the market failure of UK. As many of the
food are get produced by the farmers, but due to this pandemic situation they are unable to buy
the seeds to grow the seasonal foods such as wheat and rice (Karlson, Sandström and Wennberg,
2021). Because of the unavailability of the logistics and transportation facility to the farmers
which result into the unavailability of seasonal food to the consumer. Seasonal foods are the
basic need of all the UK public and non-availability of these foods causes the failure of UK
market.
In the lock-down all activities, jobs and business of the people in UK are temporary
closed which result into the higher unemployment rate in the UK. Public are not able to buy the
foods from the market because of the lower income or zero income which further leads to lower
demand of the product (Hay and et.al., 2018). Lower income of the public results into decrease in
demand and production delay results into decrease in supply of food product which further result
into failure of UK economy. Monopoly power in the market is also become one of the most
important reason behind the UK market failures.
Governmental and economic policies to meet market failures
During this COVID-19 situation, government of UK launches and implemented various
policies in order to meet and correct the market failures in food supply and demand and improve
the performance of the economy. The policies include price control, government subsidy, fiscal
policies and other social welfare policies.
Price Control Policy: It is a policy which is generally implemented by the government
to put restriction on the prices of the goods and services. The intention behind
implementing this policy is to make the goods affordable to all people during the shortage
of goods or when the income of the public is low (Prada, and et.al., 2018). In the given
case, implementation of price control policy has positive impact on the public having
lower income. Lower income is the major issues arises due to the cut down into salary
structure. But on the other hand, it also has the negative impact on the business as their
profitability are highly affected by this policy.
Government subsidies: It is a policy which includes various incentives to the individual
in order to meet their basic needs such as cash, cutting the individual income tax rates etc.
This benefit is also provided to the industry and organization by the government in order
to reduce the cost of their goods and services in the form of government grants. The
implementation of this policy by the government in pandemic situation has positive
impact on both the individual as-well-as industries (Yang and et.al., 2019). Individual
public receives money to meet their needs while reduction in the cost of goods increases
the customer base of the businesses.
⊘ This is a preview!⊘
Do you want full access?
Subscribe today to unlock all pages.
Trusted by 1+ million students worldwide
1 out of 16
Related Documents


Your All-in-One AI-Powered Toolkit for Academic Success.
+13062052269
info@desklib.com
Available 24*7 on WhatsApp / Email
![[object Object]](/_next/static/media/star-bottom.7253800d.svg)
Unlock your academic potential
Copyright © 2020–2026 A2Z Services. All Rights Reserved. Developed and managed by ZUCOL.