Economic Principles: Demand, Supply, Market Analysis & Externalities
VerifiedAdded on 2023/06/18
|8
|1339
|271
Report
AI Summary
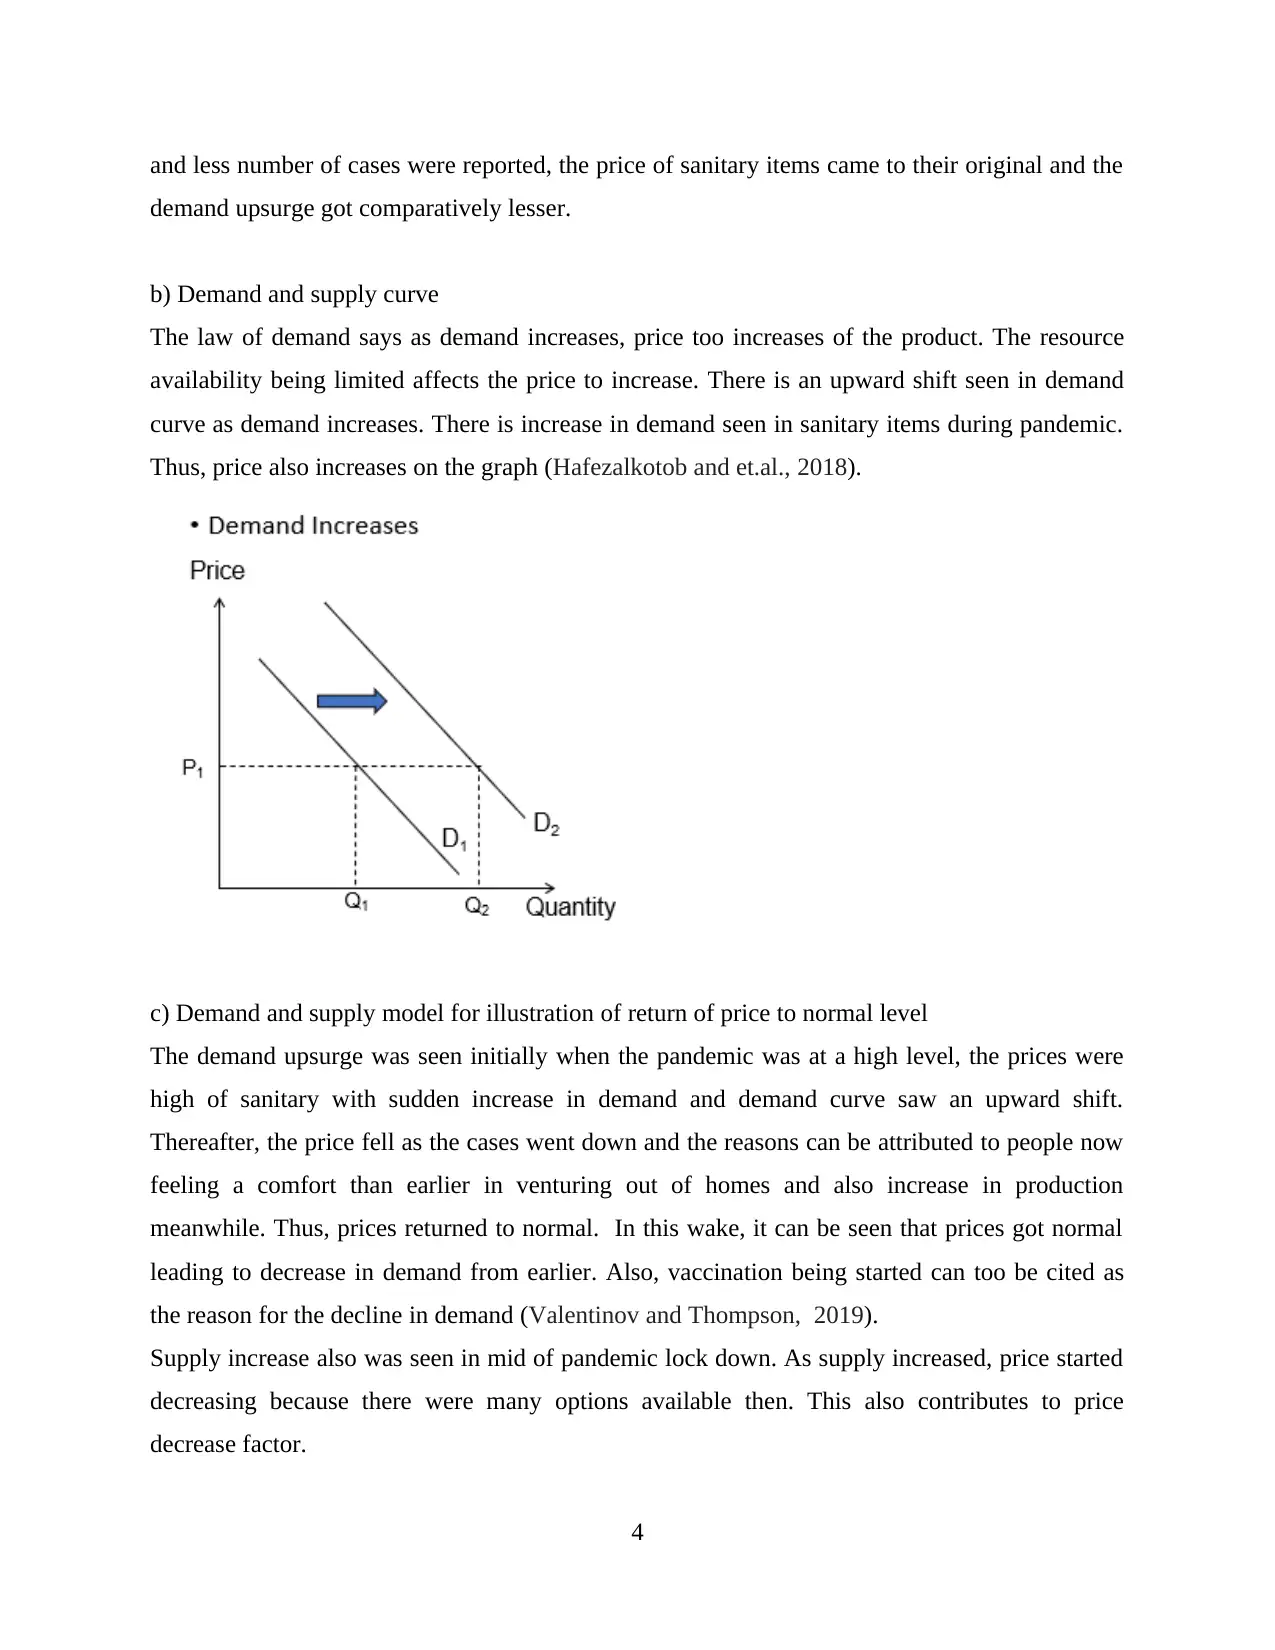
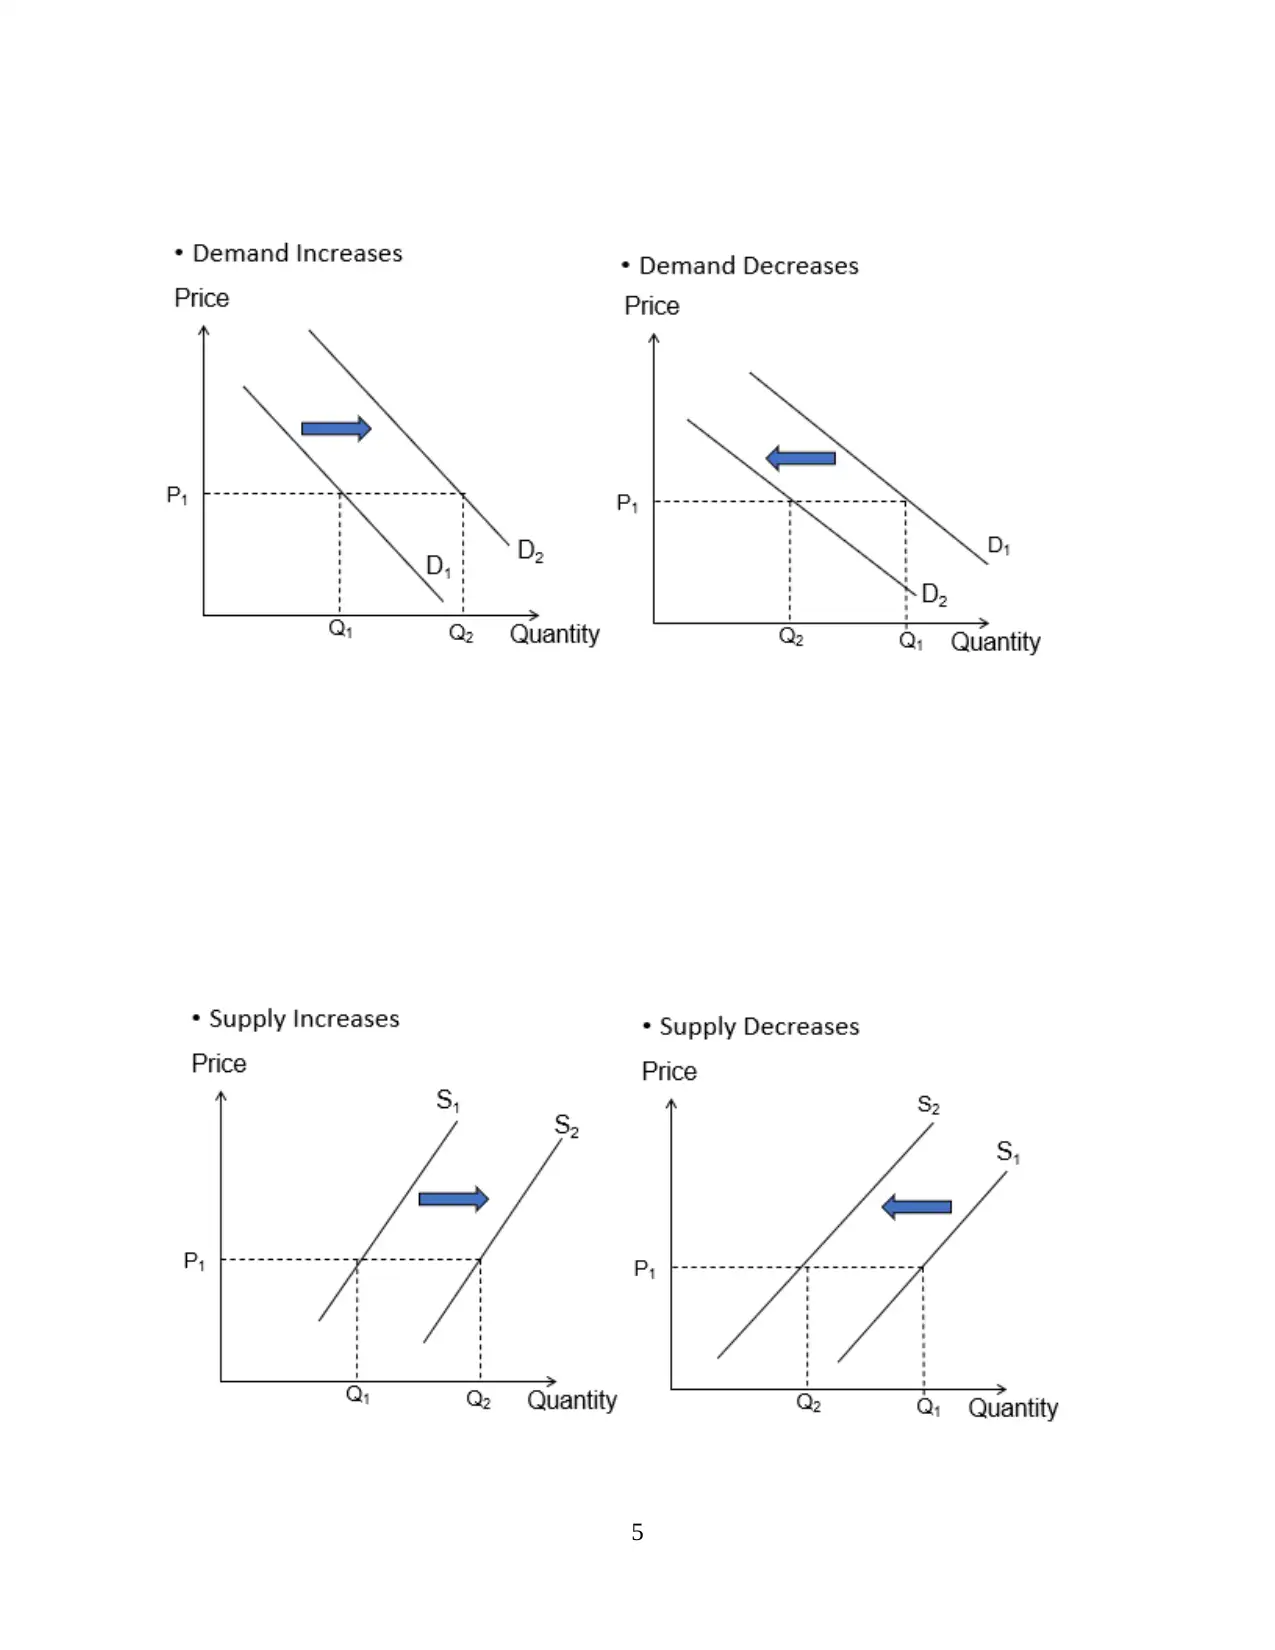
This report explores the principles of economics, focusing on demand and supply dynamics. It examines factors affecting the demand and supply of sanitary items, including the impact of political tensions, income growth, and substitute goods. The report analyzes optimal output quantity and profit, considering scenarios with and without panic buying. Furthermore, it assesses negative production externalities and monopoly market structures using relevant graphs. The analysis includes a discussion of market equilibrium, external costs, and socially efficient equilibrium prices and quantities. The report also utilizes demand and supply curves to illustrate price fluctuations during a pandemic and the return to normal price levels. This document is available on Desklib, a platform offering a wide array of study tools and solved assignments for students.
1 out of 8

Your All-in-One AI-Powered Toolkit for Academic Success.
+13062052269
info@desklib.com
Available 24*7 on WhatsApp / Email
![[object Object]](/_next/static/media/star-bottom.7253800d.svg)
Copyright © 2020–2026 A2Z Services. All Rights Reserved. Developed and managed by ZUCOL.