An In-Depth Analysis of Demand and Supply in the Retail Sector

Verified

Added on  2023/01/06

|11
|2089
|58
Report
AI Summary
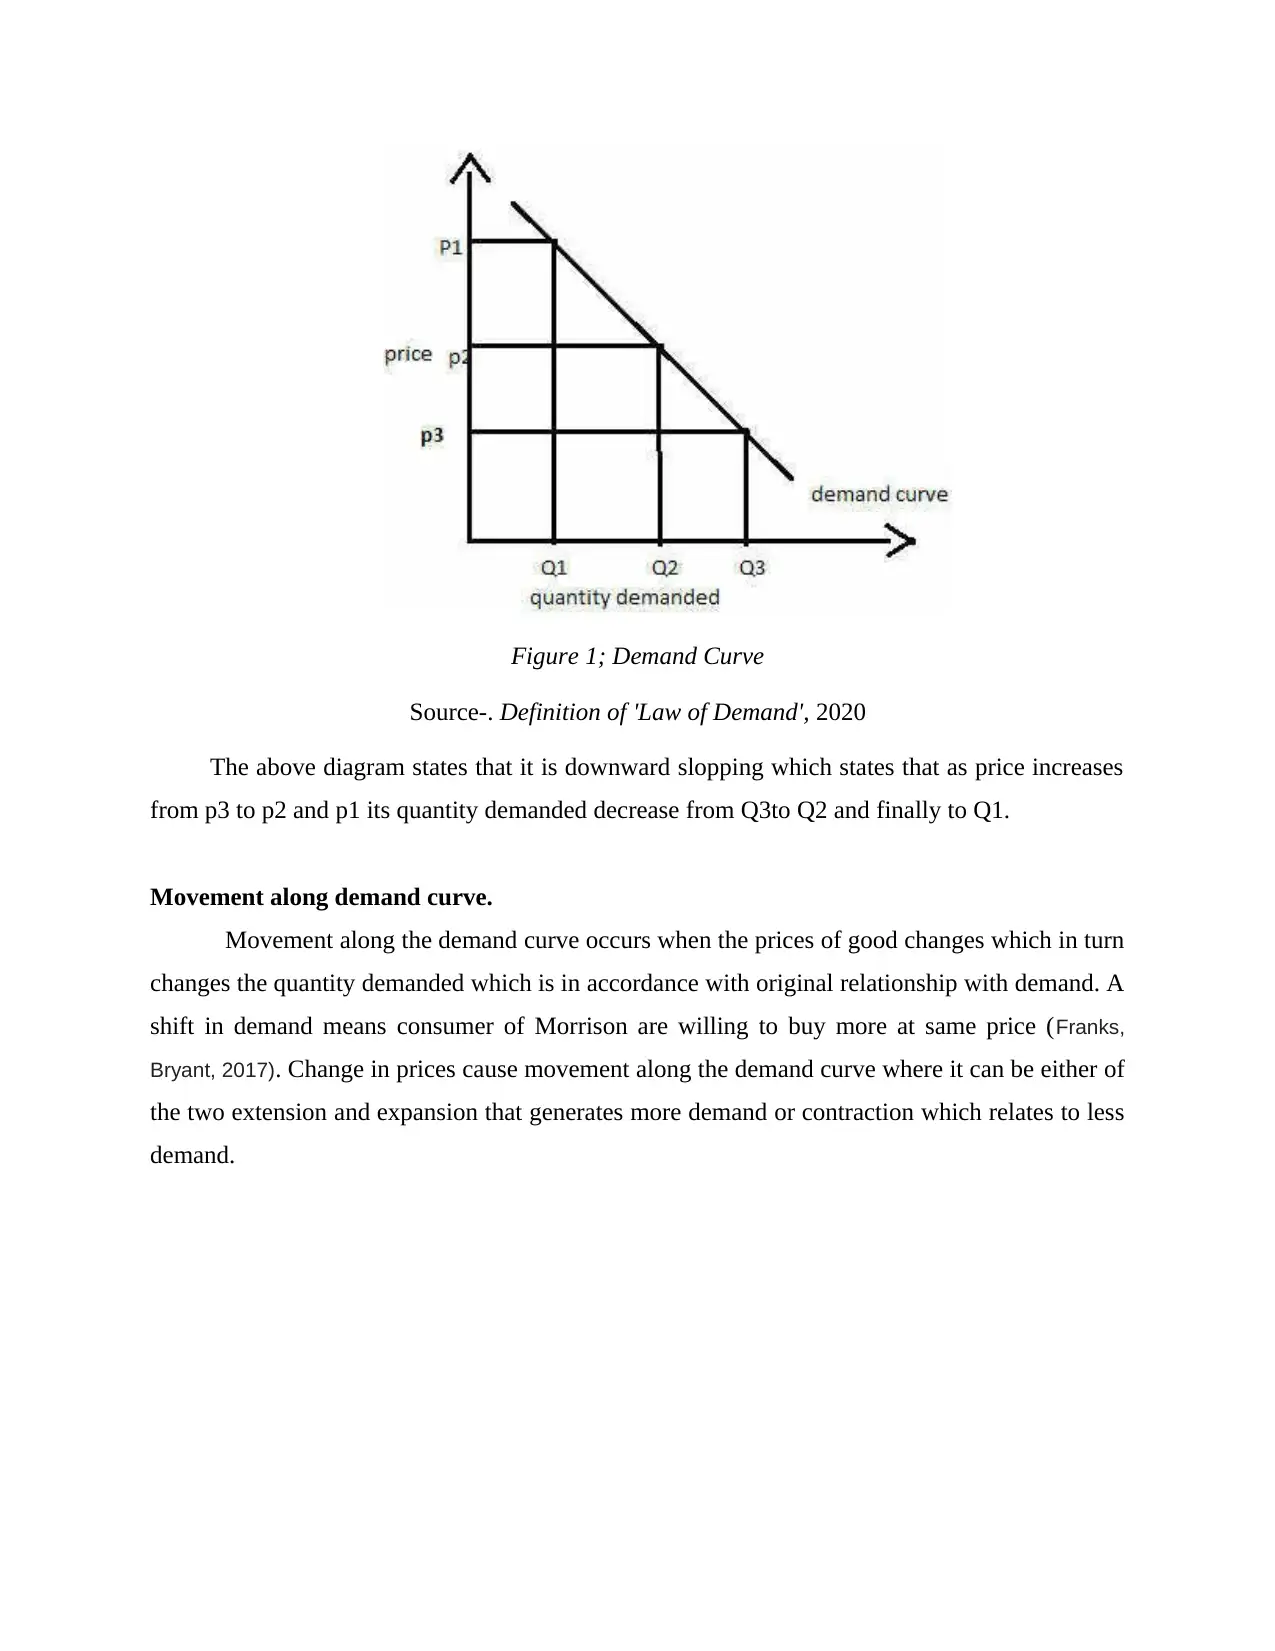
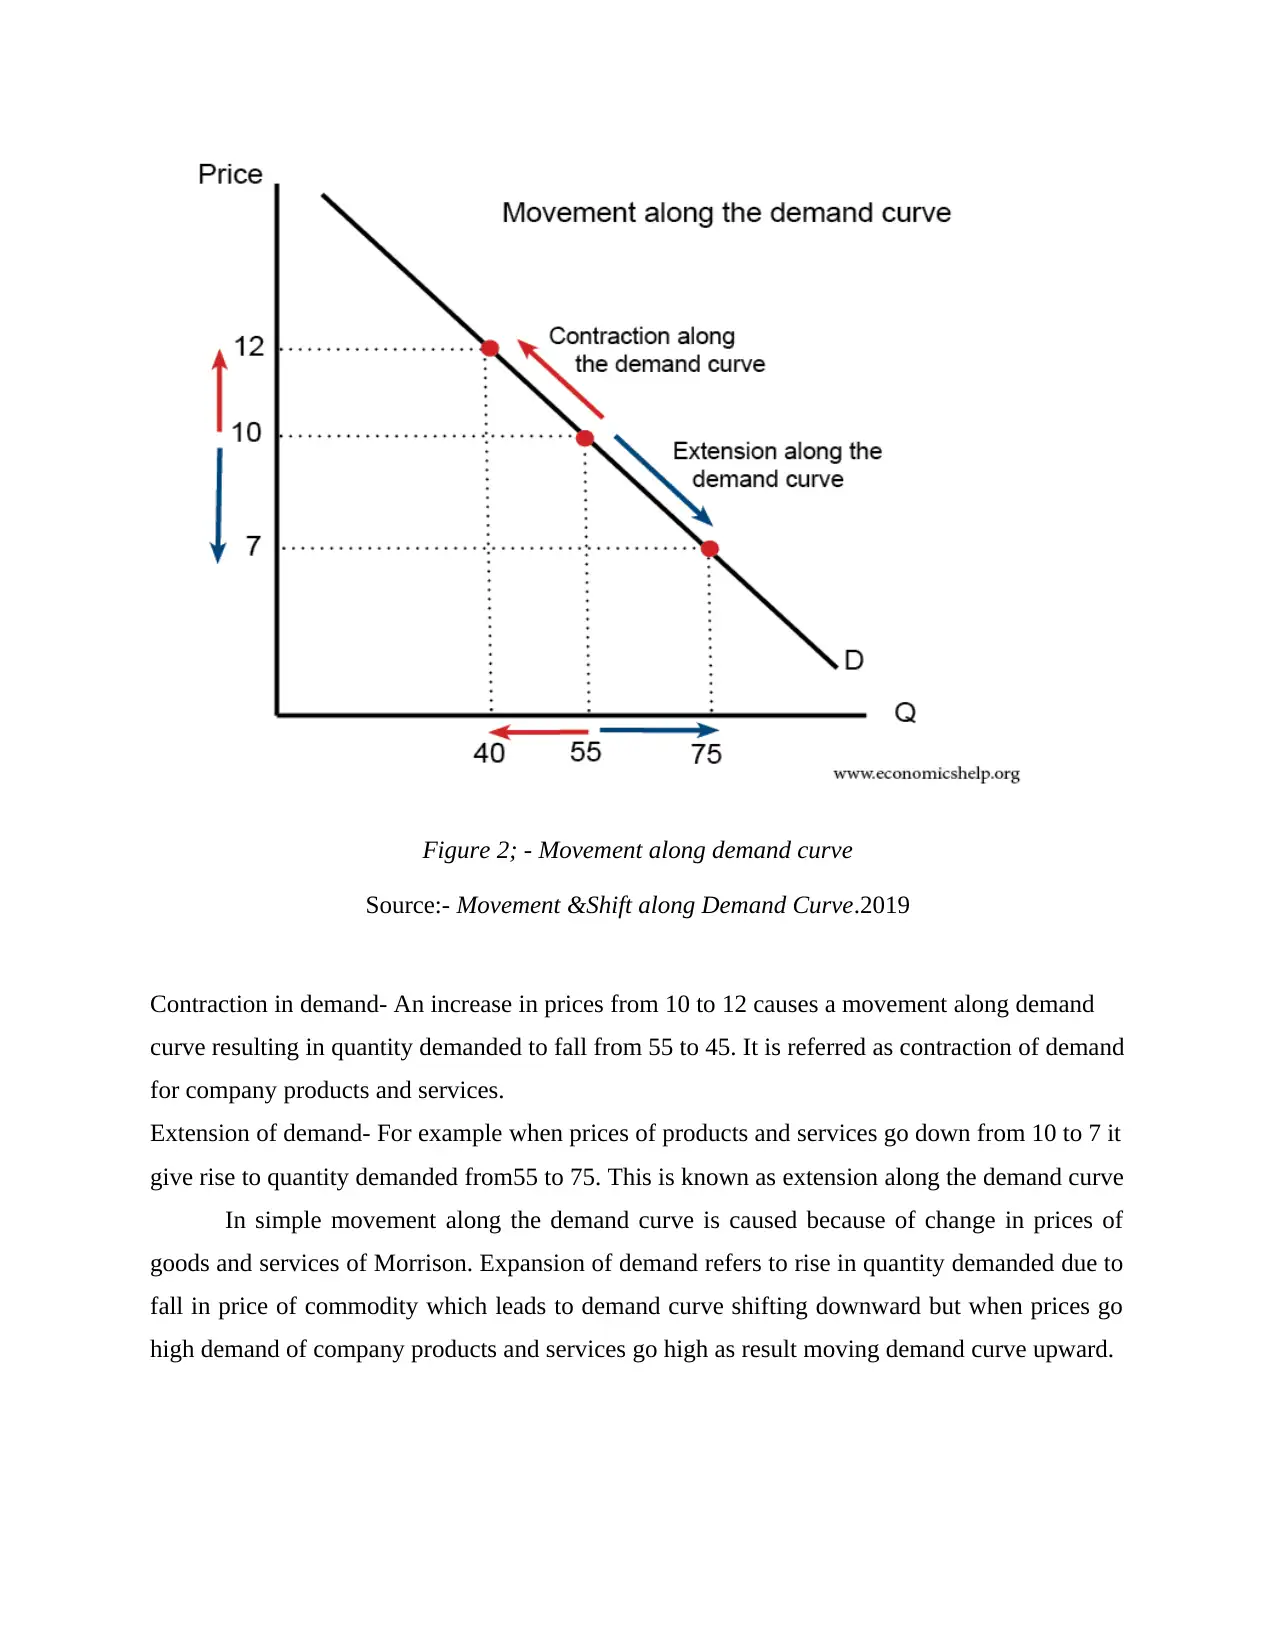
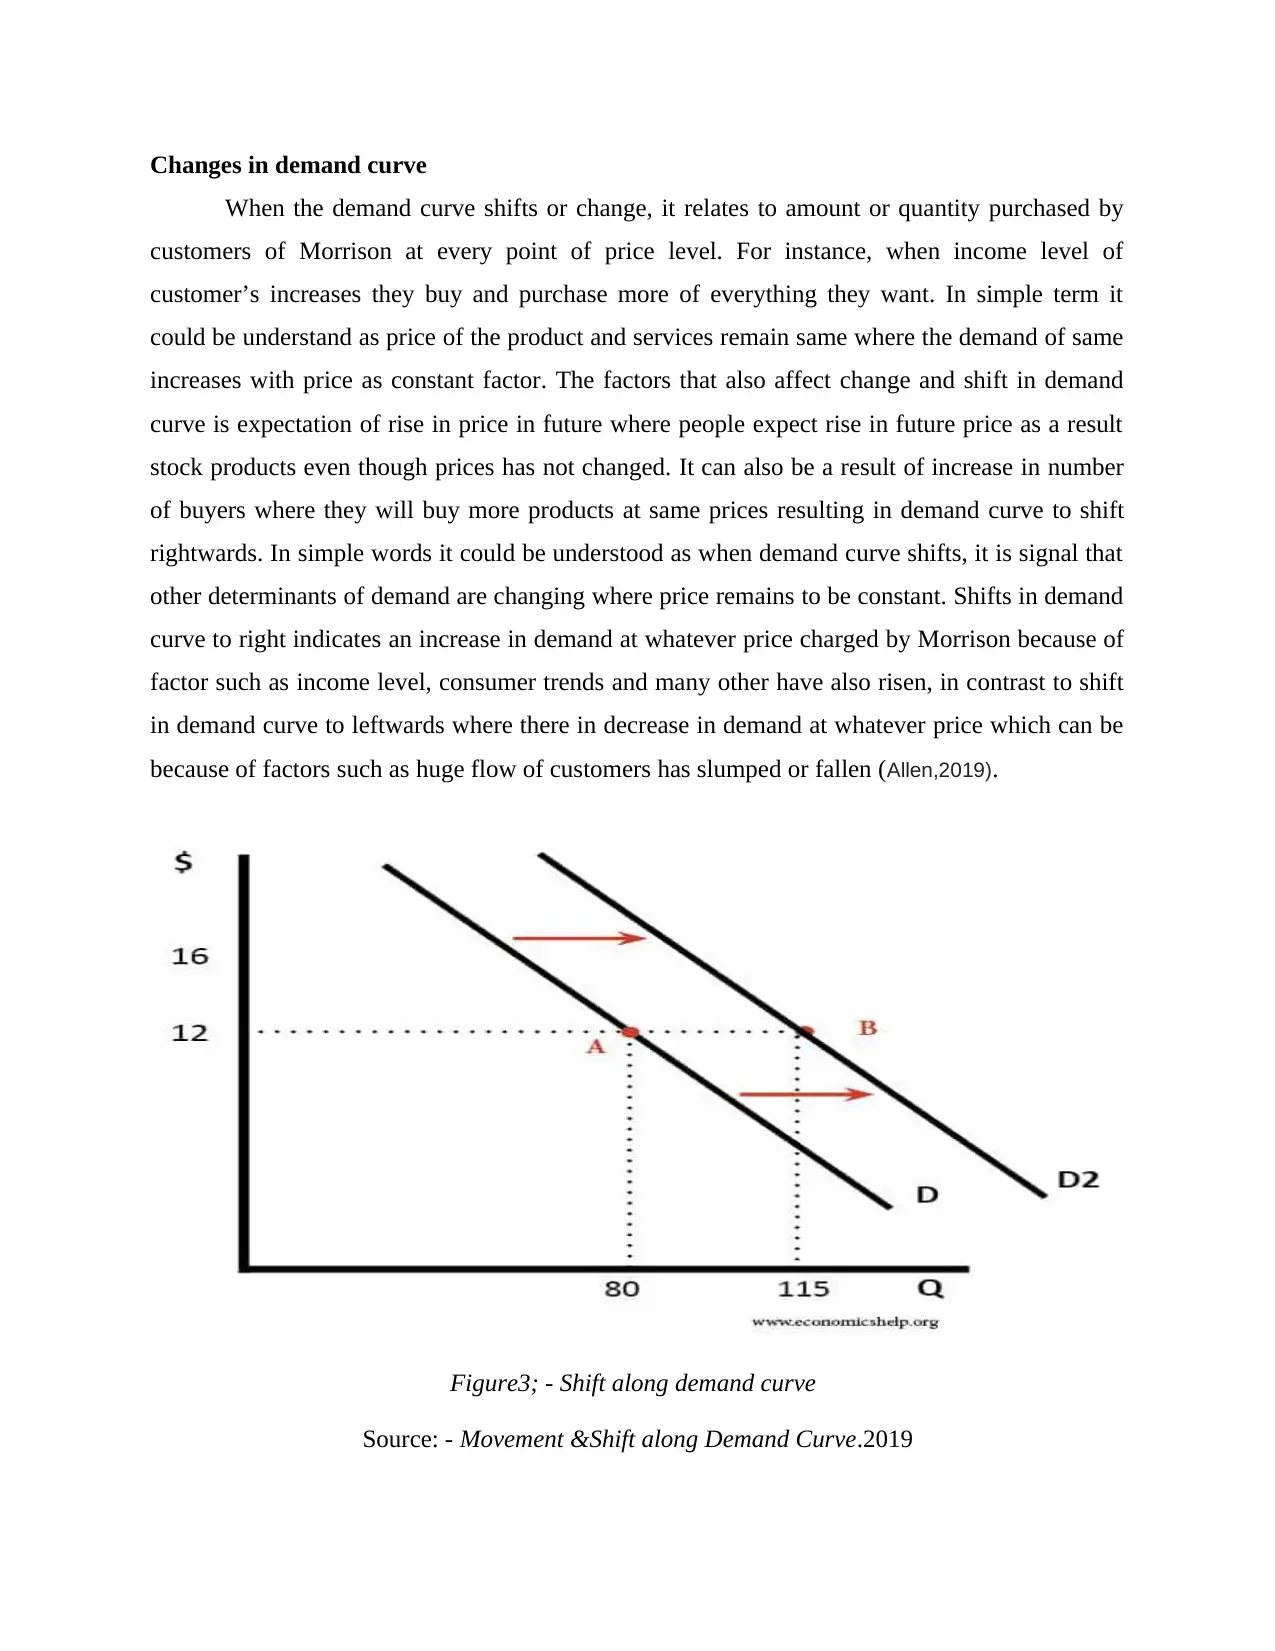
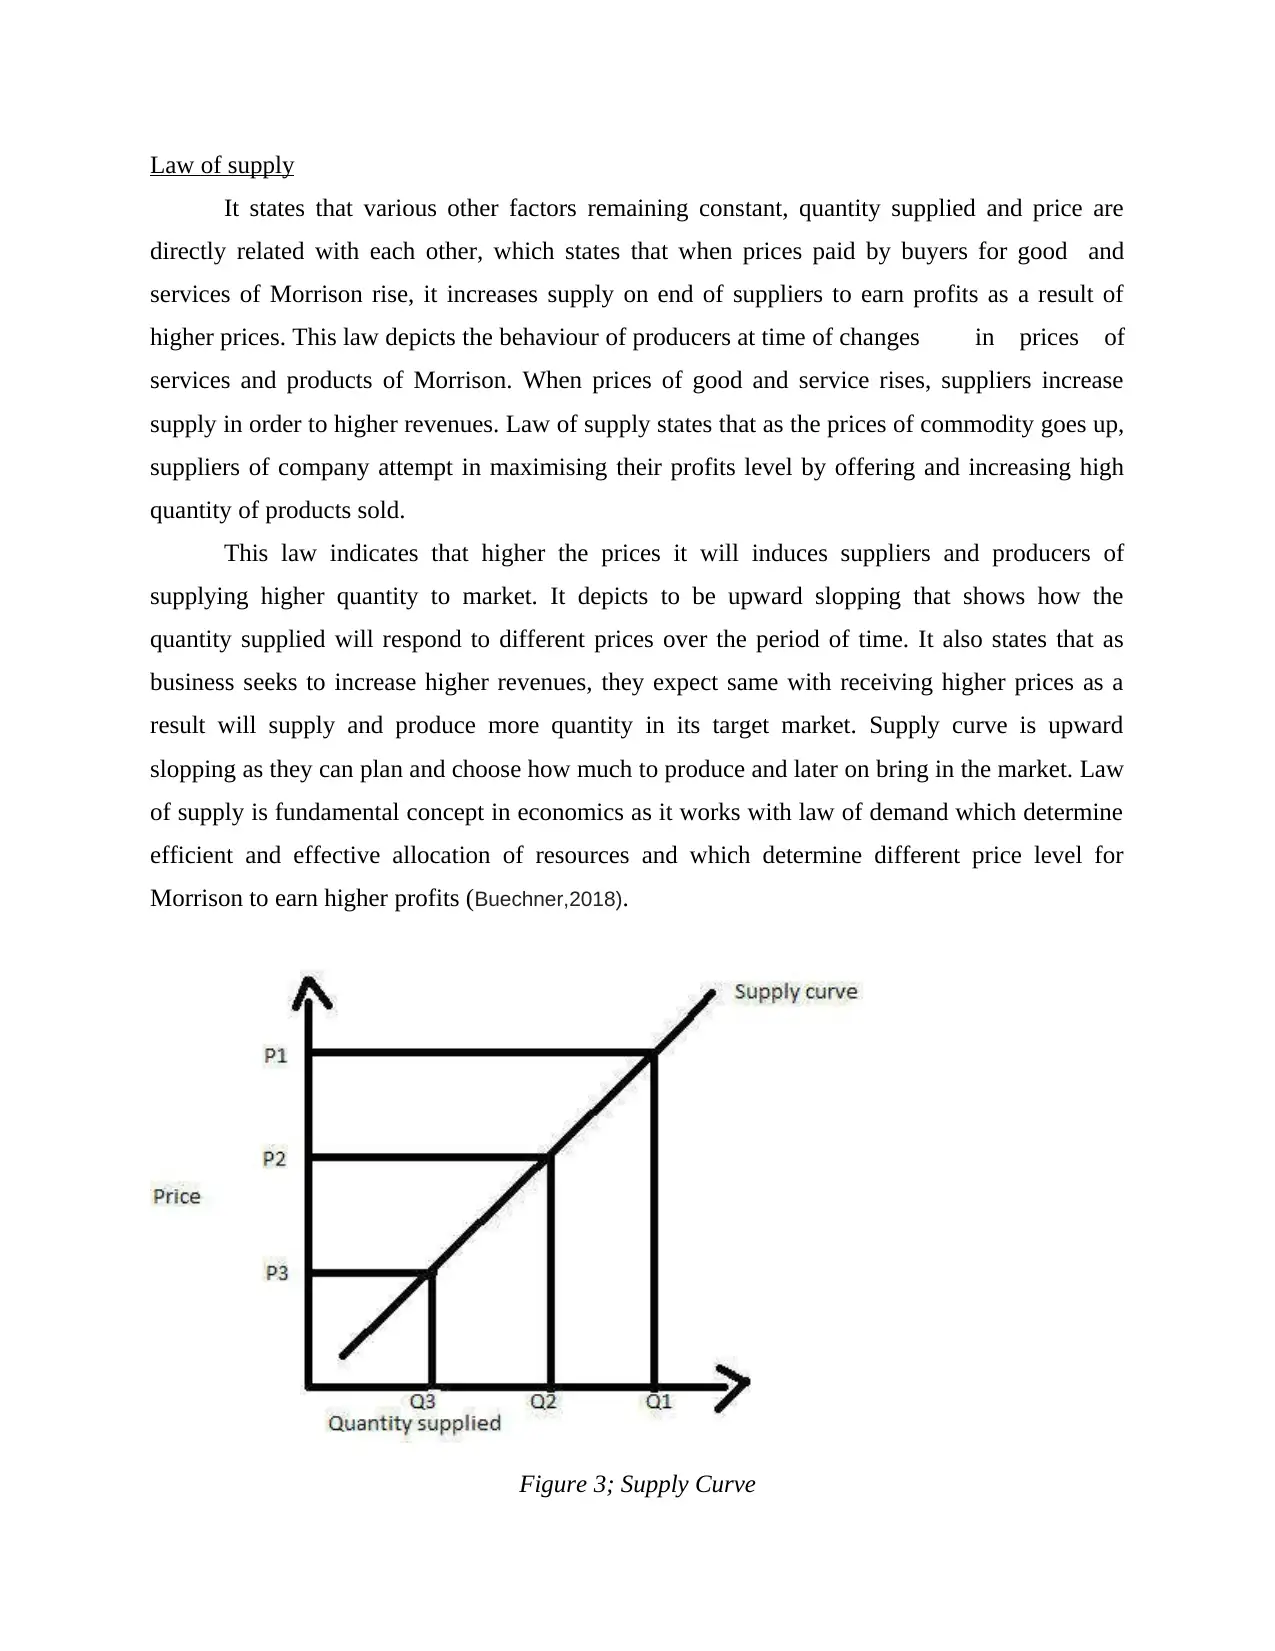
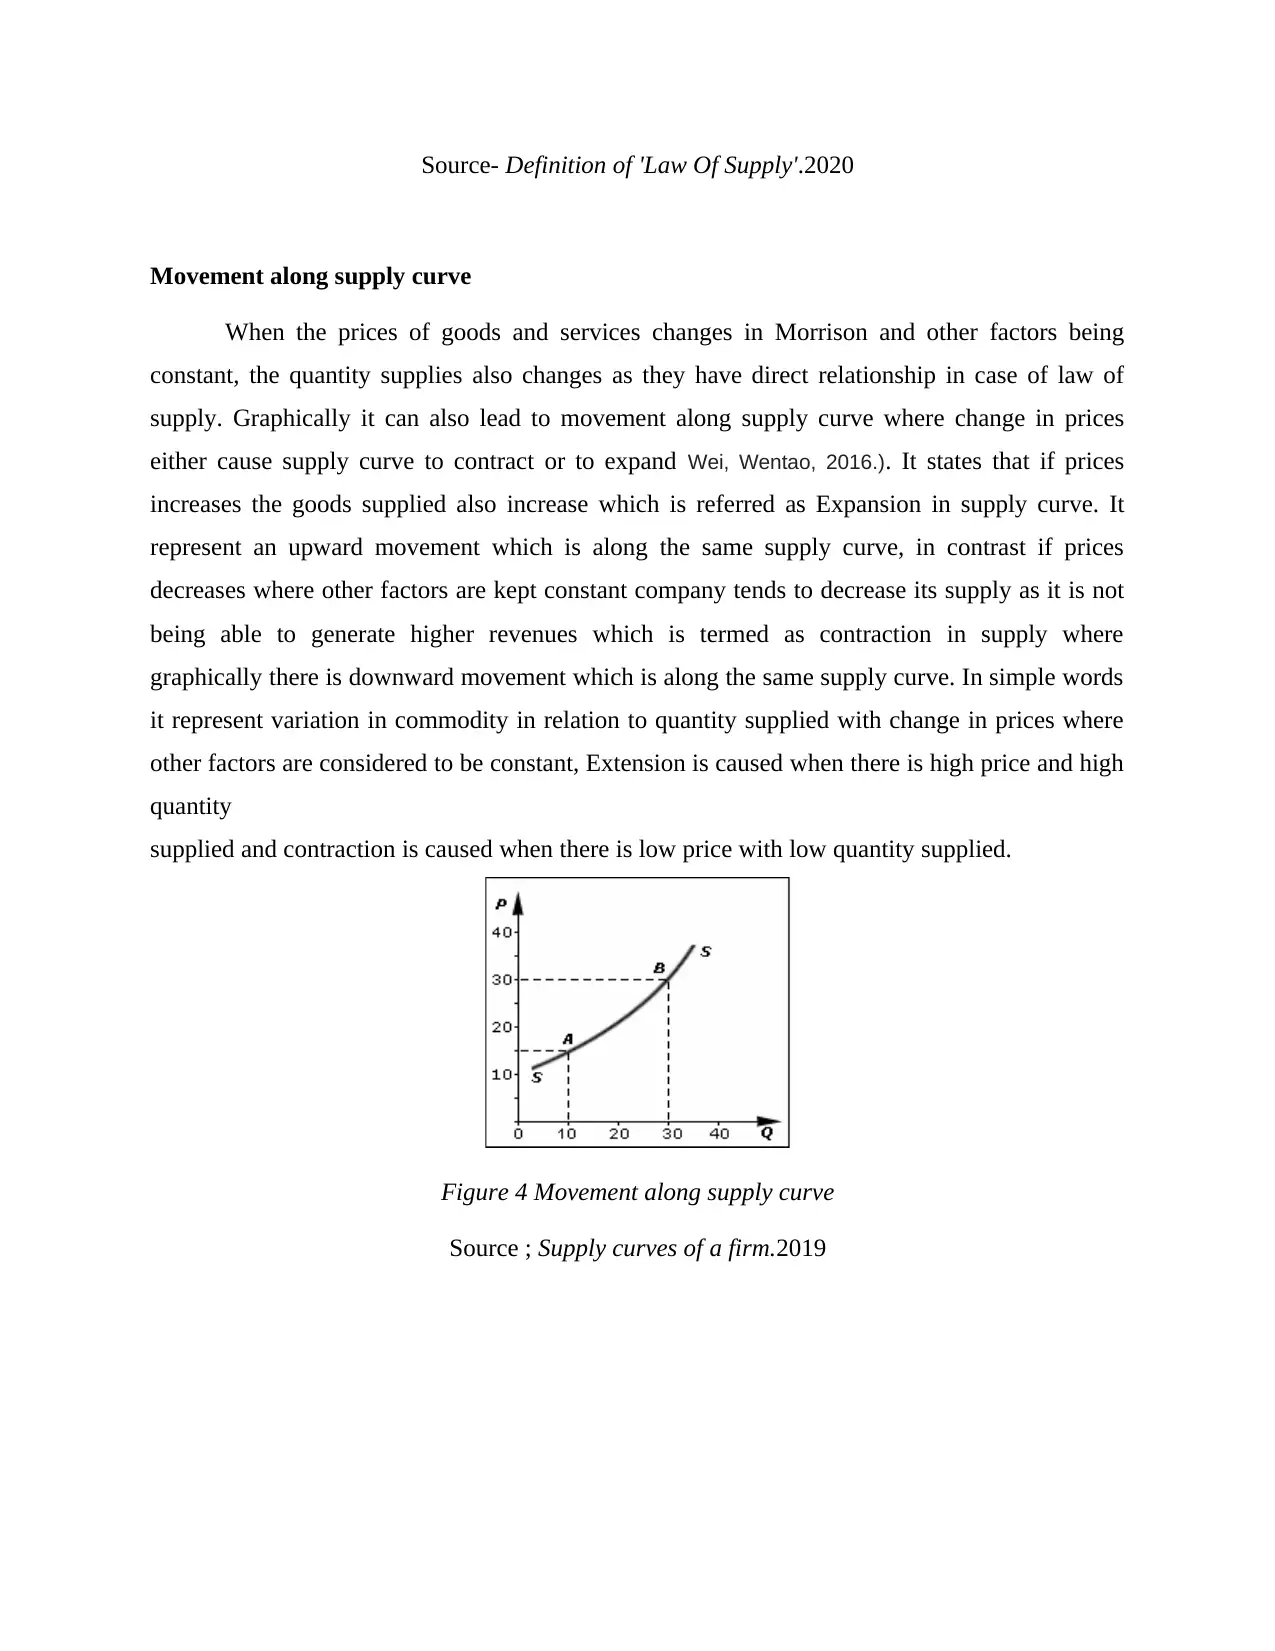
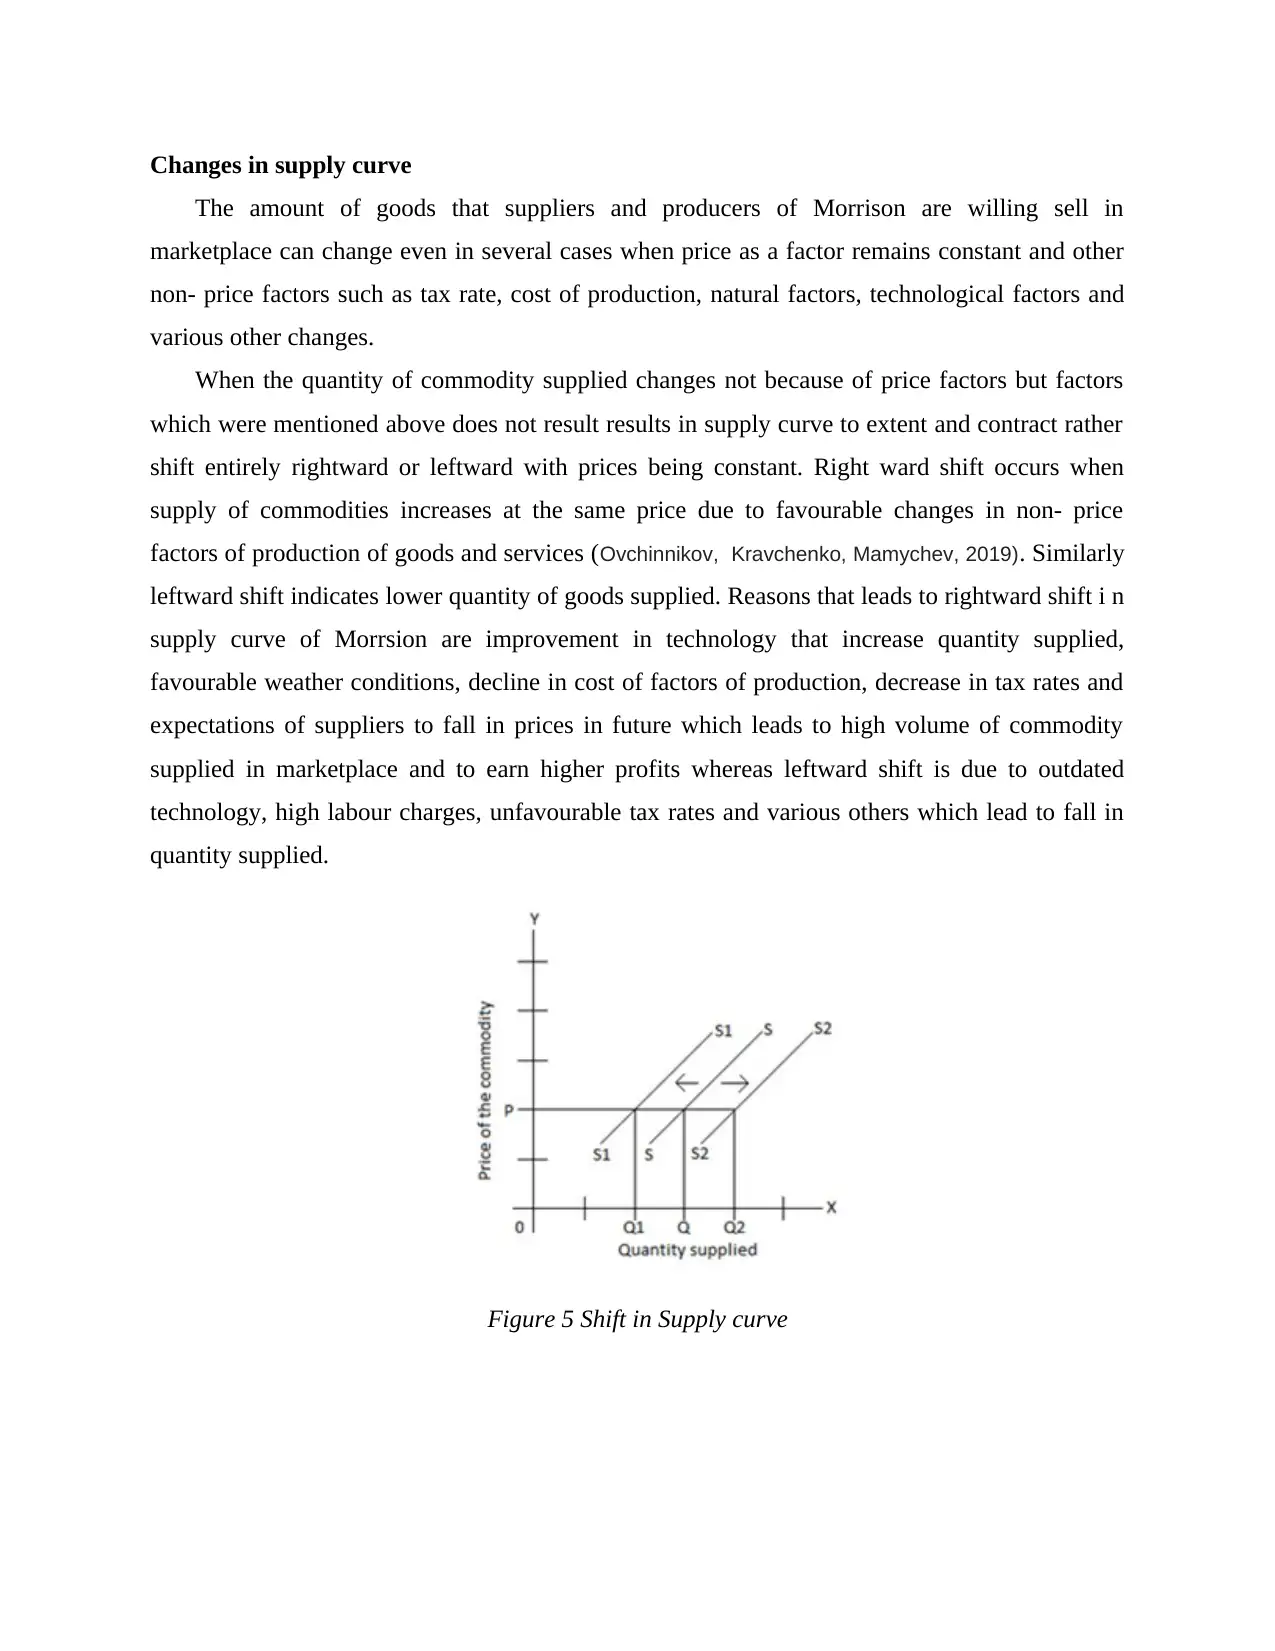
This report provides a comprehensive analysis of demand and supply principles within the context of the retail sector, specifically using Morrison's supermarket chain as a case study. It begins with an introduction to the fundamental concepts of demand and supply, defining their roles in influencing market dynamics. The main body delves into the law of demand, explaining the inverse relationship between price and quantity demanded, and the factors that cause shifts in the demand curve. It also explores the law of supply, highlighting the direct relationship between price and quantity supplied, and the factors that influence supply curve shifts. The report examines the movements along and shifts in both demand and supply curves, illustrating how changes in price and other determinants impact consumer and producer behavior. The analysis incorporates relevant diagrams to visually represent these concepts. The report concludes by summarizing the key findings and emphasizing the significance of demand and supply in understanding market behavior and business success. The report uses the example of Morrison's to explain these concepts.
Document Page
DEMAND AND SUPPLY
ANALYSIS
tabler-icon-diamond-filled.svg

Paraphrase This Document

Need a fresh take? Get an instant paraphrase of this document with our AI Paraphraser
Document Page
TABLE OF CONTENTS
INTRODUCTION...........................................................................................................................3
MAIN BODY..................................................................................................................................3
TASK 1............................................................................................................................................3
Law of Demand...........................................................................................................................3
Law of supply..............................................................................................................................7
CONCLUSION................................................................................................................................7
REFERENCES................................................................................................................................1
Document Page
INTRODUCTION
Demand and supply refers to quantity of goods the company wishes to sell at various
prices and for which its customers are willing to buy. Demand refers to how much of that item,
products or commodity consumers are willing and able to purchase at a given price whereas
supply pertains to how much company is willing to produce and can give it in market.
Morrison’s is fourth largest chain of supermarket in UK where it provides wide range of
products and service in food, electronics, home-wares and others. Present report will throw some
light on demand and supply which are fundamental to any business and helps in understanding
its impact on growth and success of company.
MAIN BODY
TASK 1
Law of Demand
This law related to various factors that are being constant in Morrison, quantity demanded
of commodity and price of goods and services are inversely related to each other which states
that when price of product of Morrsion increases it subsequently decreases the demand of its
product and vice- versa. This law explains choices of consumer behaviour in relation to changes
in price level of company products and services. It refers to other factors affecting demand to be
highly constant but when prices of goods and services rise it leads to fall in demand of company
goods and services. This is natural behaviour on side of consumers as they fear to spend more on
products and services and which left them out with doubt about the quality of same. It states that
quantity purchased inversely varies with price.
It is a fundamental principle of economics which states that at higher price of goods and
services of Morrison consumer will demand lower/ less quantity of products and services. It is
derived from law of diminishing marginal utility which states that consumer’s uses first unit of
products and services to satisfy their urgent needs first and uses additional units of products/
services to satisfy their lower value of needs (Mazurek, García, Rico, 2019.).
Document Page
Figure 1; Demand Curve
Source-. Definition of 'Law of Demand', 2020
The above diagram states that it is downward slopping which states that as price increases
from p3 to p2 and p1 its quantity demanded decrease from Q3to Q2 and finally to Q1.
Movement along demand curve.
Movement along the demand curve occurs when the prices of good changes which in turn
changes the quantity demanded which is in accordance with original relationship with demand. A
shift in demand means consumer of Morrison are willing to buy more at same price (Franks,
Bryant, 2017). Change in prices cause movement along the demand curve where it can be either of
the two extension and expansion that generates more demand or contraction which relates to less
demand.
tabler-icon-diamond-filled.svg

Paraphrase This Document

Need a fresh take? Get an instant paraphrase of this document with our AI Paraphraser
Document Page
Figure 2; - Movement along demand curve
Source:- Movement &Shift along Demand Curve.2019
Contraction in demand- An increase in prices from 10 to 12 causes a movement along demand
curve resulting in quantity demanded to fall from 55 to 45. It is referred as contraction of demand
for company products and services.
Extension of demand- For example when prices of products and services go down from 10 to 7 it
give rise to quantity demanded from55 to 75. This is known as extension along the demand curve
In simple movement along the demand curve is caused because of change in prices of
goods and services of Morrison. Expansion of demand refers to rise in quantity demanded due to
fall in price of commodity which leads to demand curve shifting downward but when prices go
high demand of company products and services go high as result moving demand curve upward.
Document Page
Changes in demand curve
When the demand curve shifts or change, it relates to amount or quantity purchased by
customers of Morrison at every point of price level. For instance, when income level of
customer’s increases they buy and purchase more of everything they want. In simple term it
could be understand as price of the product and services remain same where the demand of same
increases with price as constant factor. The factors that also affect change and shift in demand
curve is expectation of rise in price in future where people expect rise in future price as a result
stock products even though prices has not changed. It can also be a result of increase in number
of buyers where they will buy more products at same prices resulting in demand curve to shift
rightwards. In simple words it could be understood as when demand curve shifts, it is signal that
other determinants of demand are changing where price remains to be constant. Shifts in demand
curve to right indicates an increase in demand at whatever price charged by Morrison because of
factor such as income level, consumer trends and many other have also risen, in contrast to shift
in demand curve to leftwards where there in decrease in demand at whatever price which can be
because of factors such as huge flow of customers has slumped or fallen (Allen,2019).
Figure3; - Shift along demand curve
Source: - Movement &Shift along Demand Curve.2019
Document Page
Law of supply
It states that various other factors remaining constant, quantity supplied and price are
directly related with each other, which states that when prices paid by buyers for good and
services of Morrison rise, it increases supply on end of suppliers to earn profits as a result of
higher prices. This law depicts the behaviour of producers at time of changes in prices of
services and products of Morrison. When prices of good and service rises, suppliers increase
supply in order to higher revenues. Law of supply states that as the prices of commodity goes up,
suppliers of company attempt in maximising their profits level by offering and increasing high
quantity of products sold.
This law indicates that higher the prices it will induces suppliers and producers of
supplying higher quantity to market. It depicts to be upward slopping that shows how the
quantity supplied will respond to different prices over the period of time. It also states that as
business seeks to increase higher revenues, they expect same with receiving higher prices as a
result will supply and produce more quantity in its target market. Supply curve is upward
slopping as they can plan and choose how much to produce and later on bring in the market. Law
of supply is fundamental concept in economics as it works with law of demand which determine
efficient and effective allocation of resources and which determine different price level for
Morrison to earn higher profits (Buechner,2018).
Figure 3; Supply Curve
tabler-icon-diamond-filled.svg

Paraphrase This Document

Need a fresh take? Get an instant paraphrase of this document with our AI Paraphraser
Document Page
Source- Definition of 'Law Of Supply'.2020
Movement along supply curve
When the prices of goods and services changes in Morrison and other factors being
constant, the quantity supplies also changes as they have direct relationship in case of law of
supply. Graphically it can also lead to movement along supply curve where change in prices
either cause supply curve to contract or to expand Wei, Wentao, 2016.). It states that if prices
increases the goods supplied also increase which is referred as Expansion in supply curve. It
represent an upward movement which is along the same supply curve, in contrast if prices
decreases where other factors are kept constant company tends to decrease its supply as it is not
being able to generate higher revenues which is termed as contraction in supply where
graphically there is downward movement which is along the same supply curve. In simple words
it represent variation in commodity in relation to quantity supplied with change in prices where
other factors are considered to be constant, Extension is caused when there is high price and high
quantity
supplied and contraction is caused when there is low price with low quantity supplied.
Figure 4 Movement along supply curve
Source ; Supply curves of a firm.2019
Document Page
Changes in supply curve
The amount of goods that suppliers and producers of Morrison are willing sell in
marketplace can change even in several cases when price as a factor remains constant and other
non- price factors such as tax rate, cost of production, natural factors, technological factors and
various other changes.
When the quantity of commodity supplied changes not because of price factors but factors
which were mentioned above does not result results in supply curve to extent and contract rather
shift entirely rightward or leftward with prices being constant. Right ward shift occurs when
supply of commodities increases at the same price due to favourable changes in non- price
factors of production of goods and services (Ovchinnikov, Kravchenko, Mamychev, 2019). Similarly
leftward shift indicates lower quantity of goods supplied. Reasons that leads to rightward shift i n
supply curve of Morrsion are improvement in technology that increase quantity supplied,
favourable weather conditions, decline in cost of factors of production, decrease in tax rates and
expectations of suppliers to fall in prices in future which leads to high volume of commodity
supplied in marketplace and to earn higher profits whereas leftward shift is due to outdated
technology, high labour charges, unfavourable tax rates and various others which lead to fall in
quantity supplied.
Figure 5 Shift in Supply curve
Document Page
Source: - Shifts in Supply Curve, 2018
CONCLUSION
From the above analysis it is being understood that in Law of demand prices are being
inversely related with quantity demanded which laid that consumers to do consider prices as
important aspect while considering to purchase products which lays down quantity demanded of
company product and services. It also laid down various factors which affect the supply of
company product and services such as technology, natural resources and various other and helps
to understand what result in movement of demand and supply curve and shift in same.
tabler-icon-diamond-filled.svg

Paraphrase This Document

Need a fresh take? Get an instant paraphrase of this document with our AI Paraphraser
Document Page
REFERENCES
Books and journals
Allen, R., 2019. Injectivity and the Law of Demand. arXiv preprint arXiv:1908.05714.
Buechner, M.N., 2018. A comment on the law of supply and demand. Journal of Philosophical
Economics. 11(2). pp.67-80.
Franks, E. and Bryant, W.D., 2017. The Uncompensated Law of Demand: A ‘Revealed
Preference’approach. Economics Letters .152. pp.105-111.
Mazurek, J., García, C.F. and Rico, C.P., 2019. The law of demand and the loss of confidence effect: An
experimental study. Heliyon. 5(11). p.e02685.
Ovchinnikov, A.I., Kravchenko, A.G. and Mamychev, A.Y., 2019. Risks in the Processes of Digitalization
of Law and Supply Chain Strategy in Economic Relations. Int. J Sup. Chain. Mgt Vol. 8(6).
p.513.
Wei, J. and Wentao, Y., 2016. The enforcement of the property law and supply chain finance: Empirical
evidence from bank loans pledged by accounts receivable. Economic Research Journal,.1.
p.12.
Online
Definition of 'Law of Demand'.2020 [Online].
Available through: <definition/law-of-demand#:~:text=Definition%3A%20The%20law%20of
%20demand,inversely%20related%20to%20each%20other.&text=The%20ab>
Definition of 'Law Of Supply'.2020[Online]. Available through<
https://economictimes.indiatimes.com/definition/law-of-supply>
Movement& Shift along Demand Curve.2019[Online]. Available through<
https://www.economicshelp.org/blog/581/economics/changes-in-demand/>
Shifts in Supply Curve.2018[Online]. Available through<
https://www.businesstopia.net/economics/micro/supply-curve-movement-shift>
Supply curves of a firm.2019[Online]. Available
through<https://www.toppr.com/guides/economics/the-theory-of-firm-under-perfect-
competition/supply-curve-of-a-firm/>
1
chevron_up_icon
1 out of 11
circle_padding
hide_on_mobile
zoom_out_icon
[object Object]