Economic Analysis: Demand and Supply Dynamics of Polo Mint
VerifiedAdded on 2020/10/22
|13
|3303
|201
Report
AI Summary
This report provides an economic analysis of the Polo Mint brand, focusing on the principles of demand and supply within a business context. It begins with an introduction to managerial economics and its application to the UK-based company, Polo Mint. The main body delves into comparative statics, illustrating how changes in demand and supply affect equilibrium prices using diagrams. The report examines the factors influencing demand and supply, including income, product price, consumer preferences, and the impact of the law of demand and supply. It further explores the equilibrium point, emphasizing its significance for business strategy and resource allocation. Diagrams are used to illustrate shifts in demand and supply curves and their impact on price and quantity. The report concludes by summarizing the key findings regarding the market dynamics of Polo Mint and the importance of understanding economic principles for business decision-making.
Economics for Business
Paraphrase This Document
Need a fresh take? Get an instant paraphrase of this document with our AI Paraphraser
Table of Contents
INTRODUCTION...........................................................................................................................1
MAIN BODY ..................................................................................................................................1
CONCLUSION ...............................................................................................................................9
REFERENCE ................................................................................................................................10
INTRODUCTION
Economics for business clearly explain the principles within organisational context. It is
also called managerial economics because it include the various methodology or theories in their
business (Assous, Bruno and Legrand, 2014). It will help the business to choose better
alternatives among the various options and help the organisation to meet with their needs &
demands of the business. Economics help to determined the government, society, households &
individuals allocated resources. Polo Mint is the brand product of Breath Mint and UK based
company. It is the first peppermint manufacturing company which established in 1948. In this
report, topics are going to be covered is analysis of demand & supply and the main factors which
determined the price of Polo Mint.
MAIN BODY
In the economic business environment, comparative statics plays very important role to
identify different economy and the changes before & after. It will compare the two equilibrium
points with the help of statics analysis. In the other words, change in the demand & supply will
be done due to the factors. Comparison will be done on the basis of diagram because it will
provide the clear picture of change in demand & supply of Polo Mint. For example: - Demand
of Mind product is 50 pc and supply also in same quantity. Price of the product is £5 and suppose
demand will increase by 10 pc but supply was still same. So the price of the product will be
increase by £1 and the currents price is £6 of each product. Basically the comparison among the
two equilibrium price is called comparative economics statics. It involve the comparative
analysis of new equilibrium point with the original one and it will happen because of some
variable changes in the business (Azevedo and Leshno, 2016).
According to Baumol, static supply & demand analysis will show the equilibrium
changes before and after change in variables on the basis required time. Equilibrium point is that
point where price of product in the market develop the equal demand as well as supply of
product & services in the market for the consumers. With the help of equilibrium point Polo
Mints can develop strategies according to the requirement. Further explanation of the will be
shown in the below figure and it will help for the better analysis.
1
⊘ This is a preview!⊘
Do you want full access?
Subscribe today to unlock all pages.
Trusted by 1+ million students worldwide
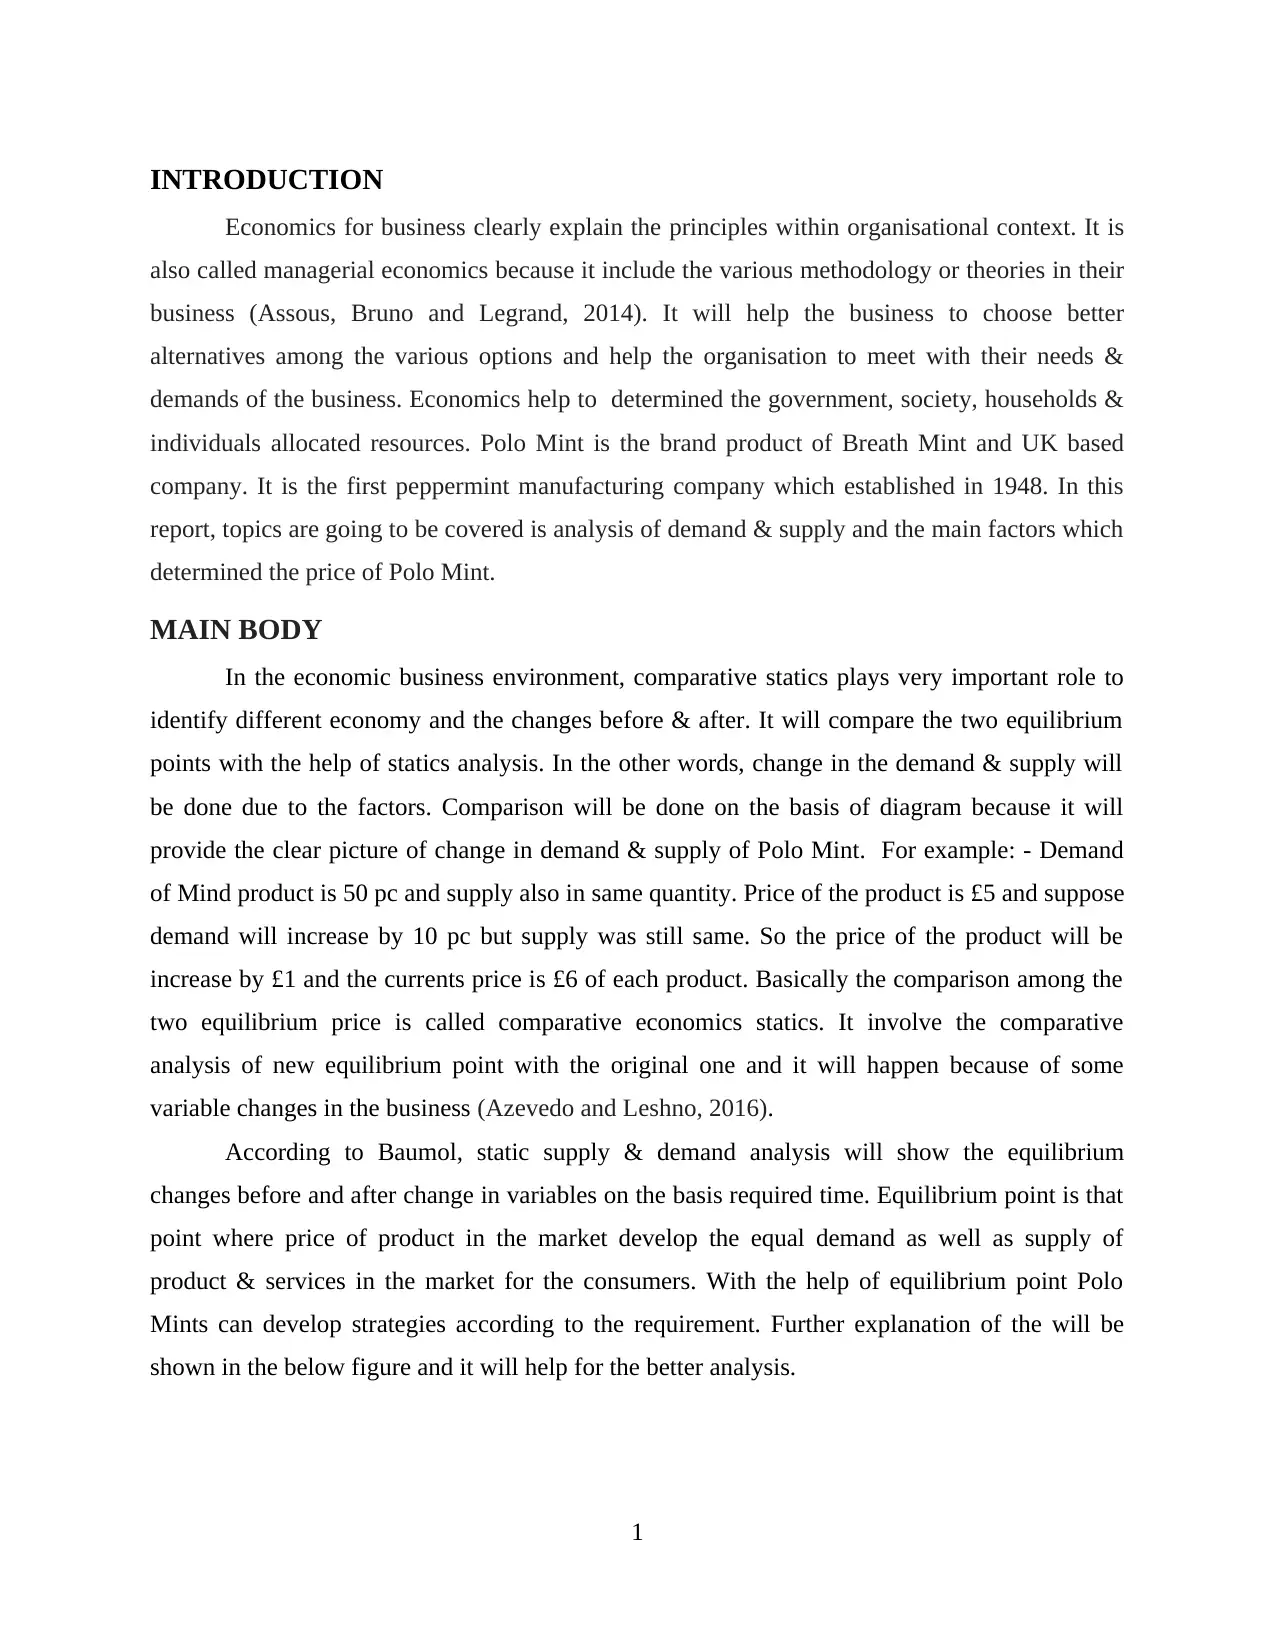
This diagram will clearly show the shift of E (Equilibrium point) from E to E1 and in the
above discussion demand of the product will increase by 10 pc which will clearly shown in the
diagram. Where D (Demand) will shift to the right side D1 so because of that Equilibrium point
also shift and it will provide effective comparison. It also applied Law of supply & demand in
the Polo Mint for the identification of resources.
With the help of theoretical concept such as demand & supply analyst or researcher
measure the factors which determined the price of Polo Mint in the UK. Demand & supply of
Polo product by an individual will affect the business. There are various factors which affect the
both market such as microeconomics & macroeconomics level and force them to shift according
to the variable changes. It include the average income of an individual, price of product, demand
or taste & preference according to consumers which will change the entire curve or shift the
demand from right to left or left to right (Bohi, 2013).
From the above diagram, demand will shift toward right due to increase product demand
but supply still the same. Diagram will clearly show the that, demand of Polo product will
increase the price (P) as well as quantity (M) which is mentioned. Due to this reason, equilibrium
point shift from E to E1.
Biggest reason to change in the supply & demand curve is the product price, average
income, taste & preference, future demand or price, related goods etc. These factors will change
the demand of Polo Mint and it will further affect the demand which already shown in he above
digram.
2
Paraphrase This Document
Need a fresh take? Get an instant paraphrase of this document with our AI Paraphraser
Demand and supply is the basic fundamental concept of economics and it the base of
market which help the business to identify product demand and their supply level. Demand is
refer to the quantity which is demanded by the consumers for the satisfying their need & wants.
For their demand people are willing to pay demanded price due to the need of that item (Kaiser,
2016). So the price of Polo Mint product will set according to the willingness of consumers to
pay. Supply will represent the quantity which will offer in the market at certain price.
Relationship among the demand or price and supply or price is the reflection of demand &
supply of the Polo Mint product in the UK market. Demand & supply theories will help in
allocating resources and use them in the most suitable way. For this it required to discuss the
Law of Demand & Law of Supply and it will be discuss below:
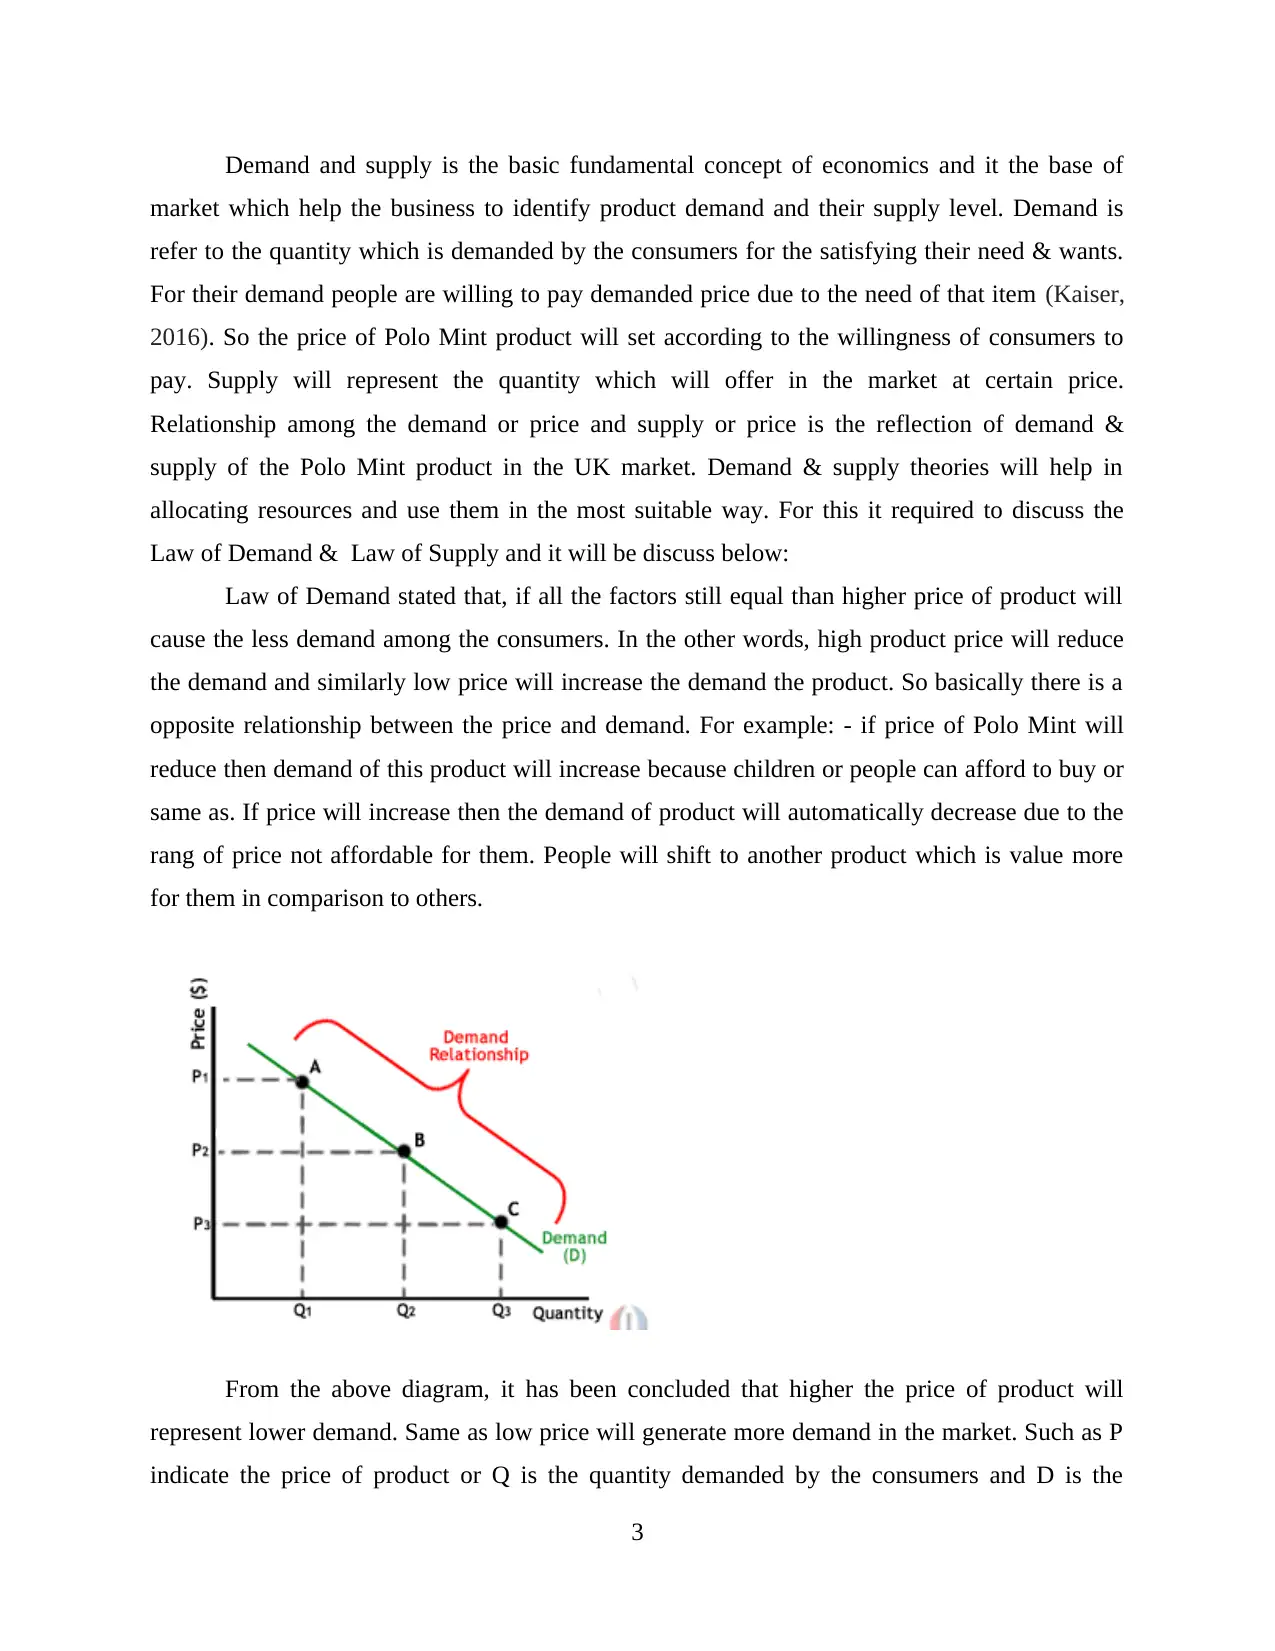
Law of Demand stated that, if all the factors still equal than higher price of product will
cause the less demand among the consumers. In the other words, high product price will reduce
the demand and similarly low price will increase the demand the product. So basically there is a
opposite relationship between the price and demand. For example: - if price of Polo Mint will
reduce then demand of this product will increase because children or people can afford to buy or
same as. If price will increase then the demand of product will automatically decrease due to the
rang of price not affordable for them. People will shift to another product which is value more
for them in comparison to others.
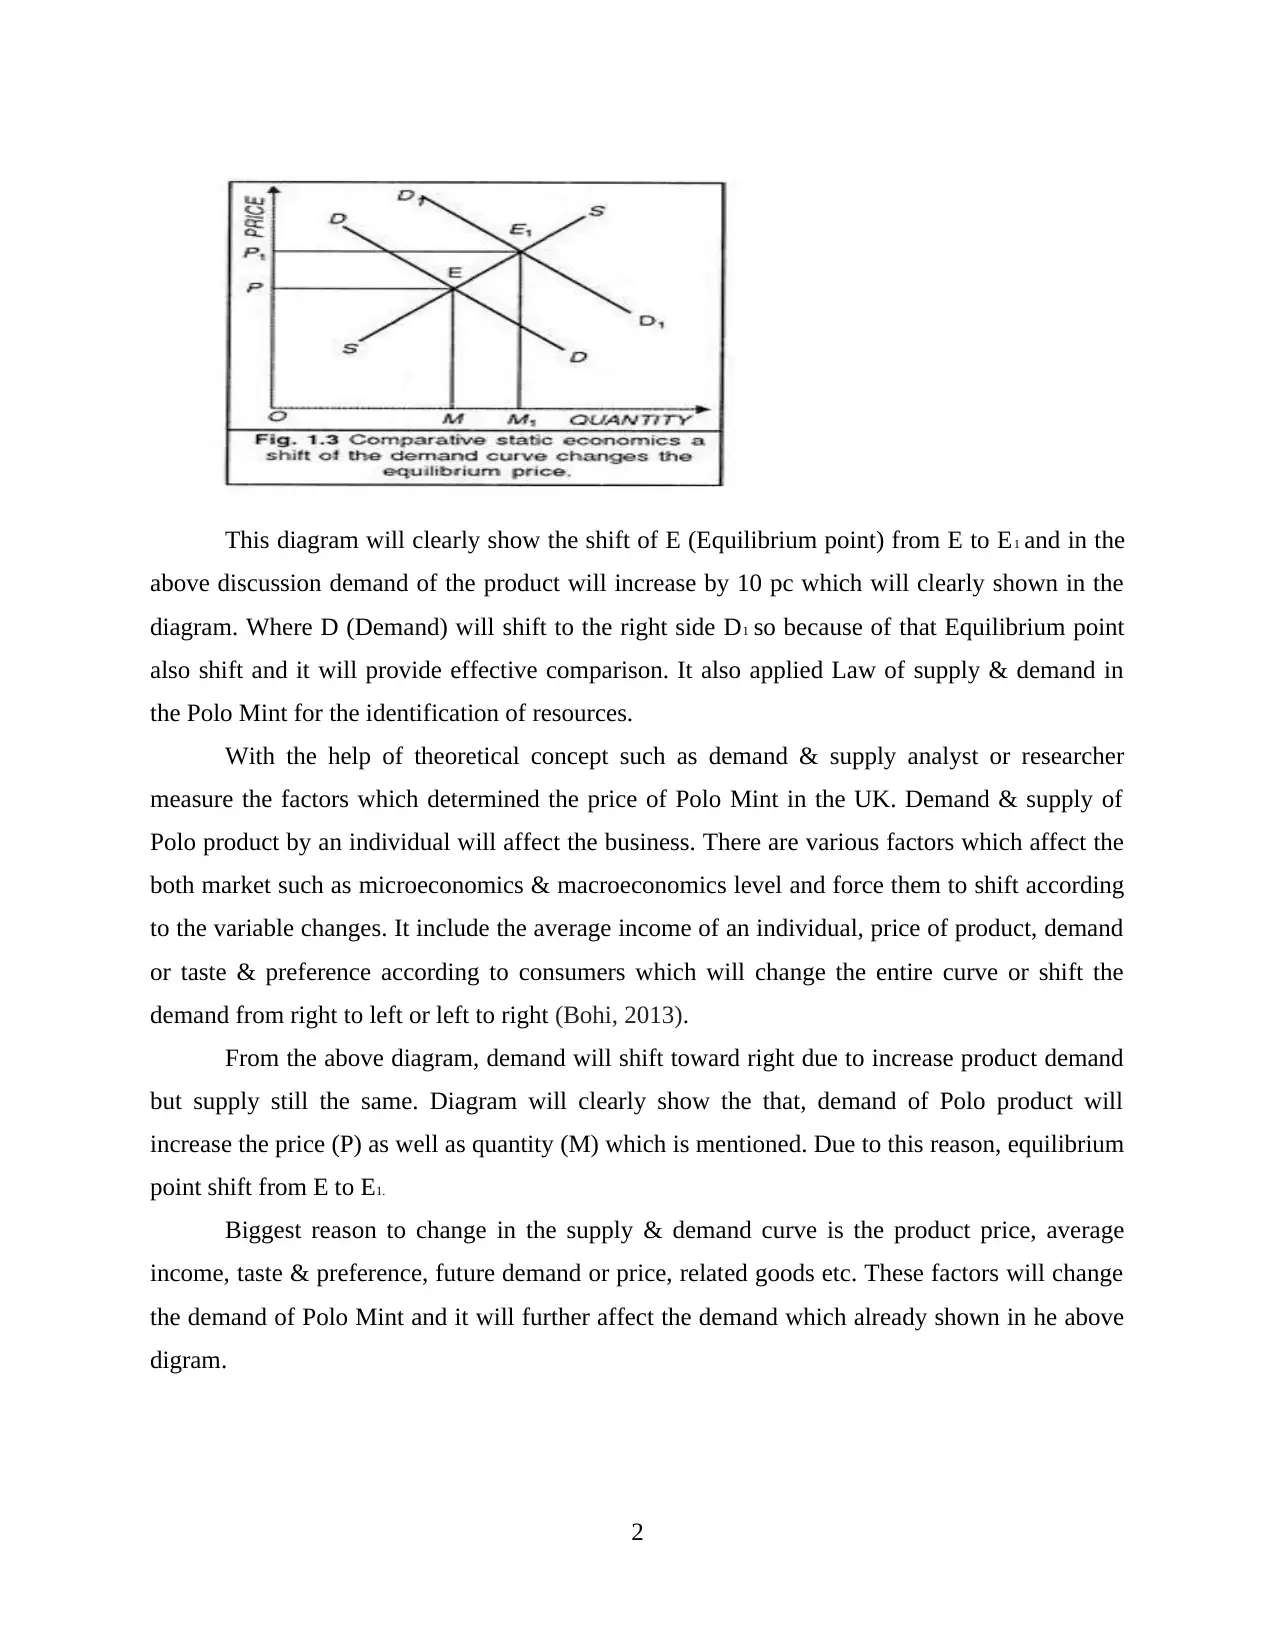
From the above diagram, it has been concluded that higher the price of product will
represent lower demand. Same as low price will generate more demand in the market. Such as P
indicate the price of product or Q is the quantity demanded by the consumers and D is the
3
market which help the business to identify product demand and their supply level. Demand is
refer to the quantity which is demanded by the consumers for the satisfying their need & wants.
For their demand people are willing to pay demanded price due to the need of that item (Kaiser,
2016). So the price of Polo Mint product will set according to the willingness of consumers to
pay. Supply will represent the quantity which will offer in the market at certain price.
Relationship among the demand or price and supply or price is the reflection of demand &
supply of the Polo Mint product in the UK market. Demand & supply theories will help in
allocating resources and use them in the most suitable way. For this it required to discuss the
Law of Demand & Law of Supply and it will be discuss below:
Law of Demand stated that, if all the factors still equal than higher price of product will
cause the less demand among the consumers. In the other words, high product price will reduce
the demand and similarly low price will increase the demand the product. So basically there is a
opposite relationship between the price and demand. For example: - if price of Polo Mint will
reduce then demand of this product will increase because children or people can afford to buy or
same as. If price will increase then the demand of product will automatically decrease due to the
rang of price not affordable for them. People will shift to another product which is value more
for them in comparison to others.
From the above diagram, it has been concluded that higher the price of product will
represent lower demand. Same as low price will generate more demand in the market. Such as P
indicate the price of product or Q is the quantity demanded by the consumers and D is the
3
demand curve. Demand curve represent the relationship between price and quantity through the
points such as A,B or C. These points are the combinations which represents the demand of
product according to it's price. Demand relationship show the opposite or negative interaction of
price and quantity for the each other (Heakal, 2015). Point A show the high price & low quantity
demanded by the consumers and same as Point C represent the low product price & high demand
in term of quantity. Relationship of piece and quantity will be shown in the downward directions
same as represent in above diagram.
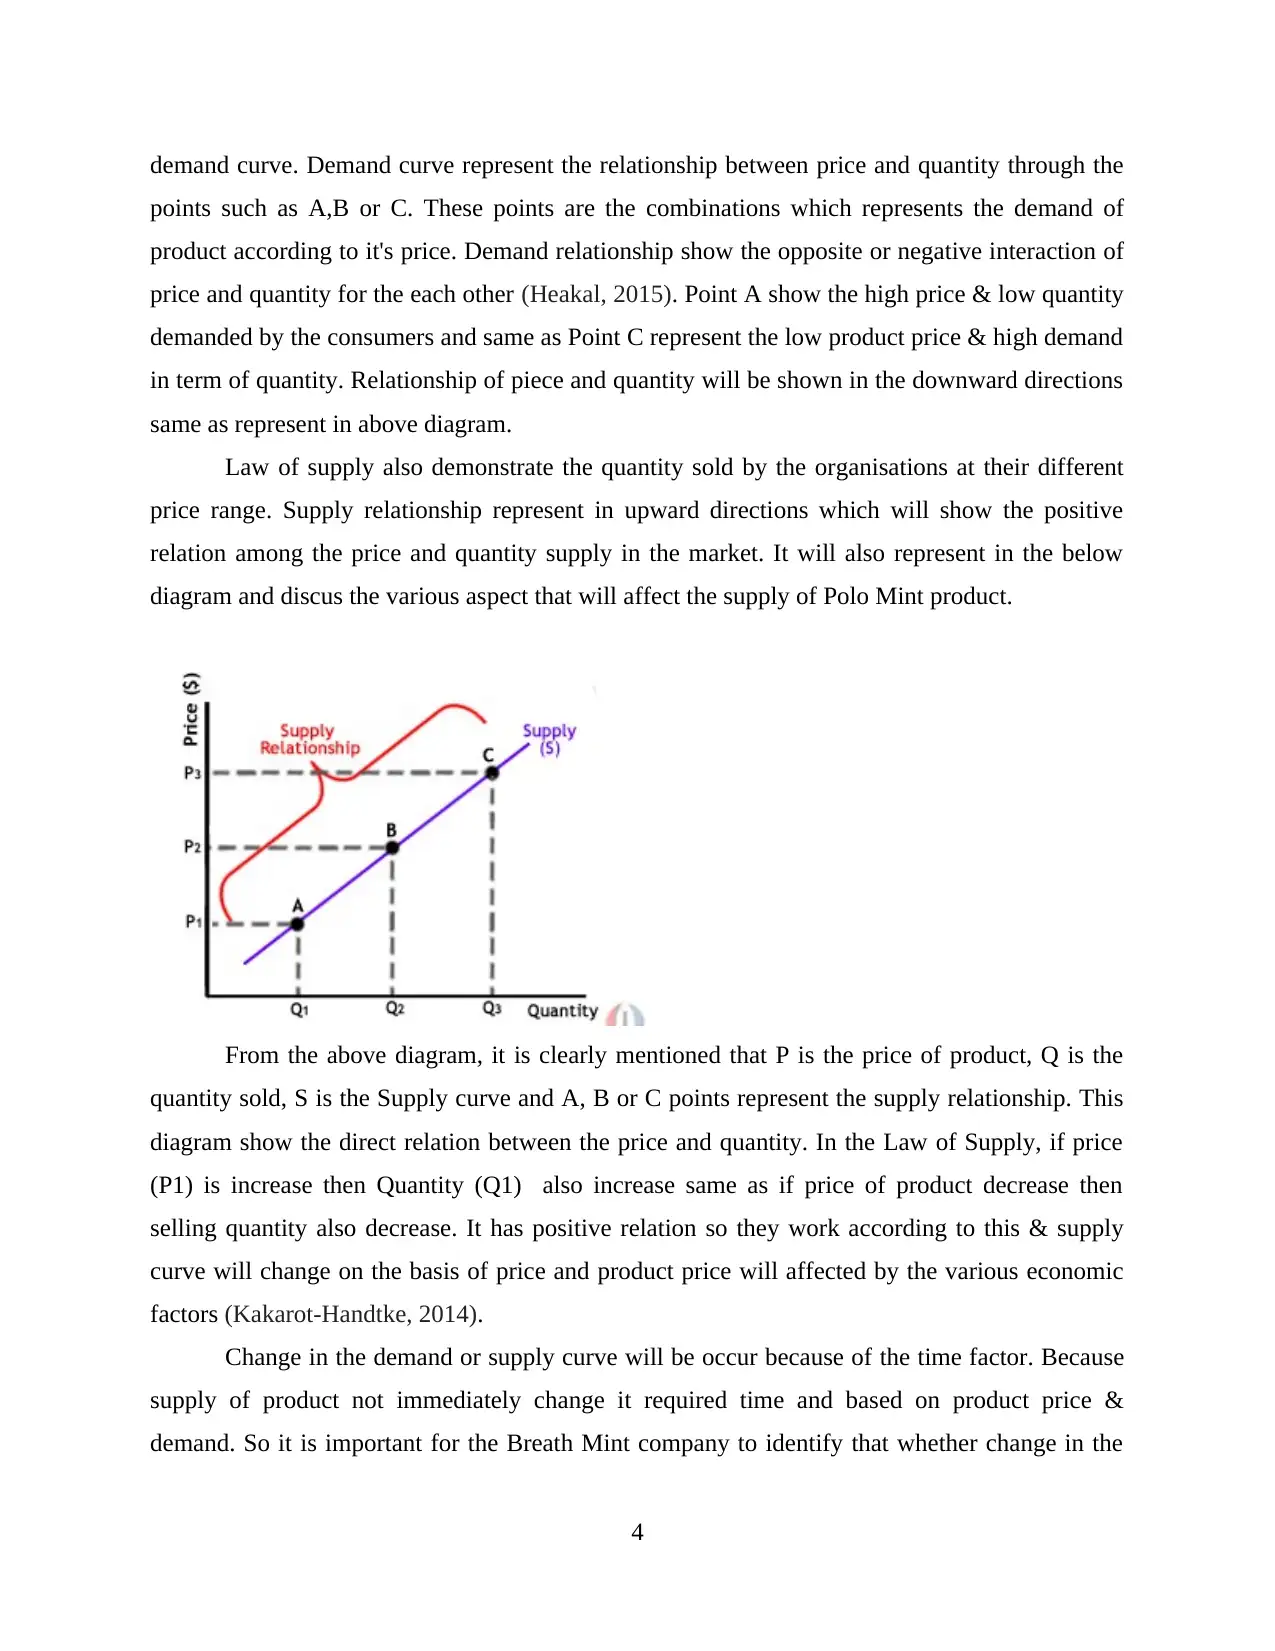
Law of supply also demonstrate the quantity sold by the organisations at their different
price range. Supply relationship represent in upward directions which will show the positive
relation among the price and quantity supply in the market. It will also represent in the below
diagram and discus the various aspect that will affect the supply of Polo Mint product.
From the above diagram, it is clearly mentioned that P is the price of product, Q is the
quantity sold, S is the Supply curve and A, B or C points represent the supply relationship. This
diagram show the direct relation between the price and quantity. In the Law of Supply, if price
(P1) is increase then Quantity (Q1) also increase same as if price of product decrease then
selling quantity also decrease. It has positive relation so they work according to this & supply
curve will change on the basis of price and product price will affected by the various economic
factors (Kakarot-Handtke, 2014).
Change in the demand or supply curve will be occur because of the time factor. Because
supply of product not immediately change it required time and based on product price &
demand. So it is important for the Breath Mint company to identify that whether change in the
4
points such as A,B or C. These points are the combinations which represents the demand of
product according to it's price. Demand relationship show the opposite or negative interaction of
price and quantity for the each other (Heakal, 2015). Point A show the high price & low quantity
demanded by the consumers and same as Point C represent the low product price & high demand
in term of quantity. Relationship of piece and quantity will be shown in the downward directions
same as represent in above diagram.
Law of supply also demonstrate the quantity sold by the organisations at their different
price range. Supply relationship represent in upward directions which will show the positive
relation among the price and quantity supply in the market. It will also represent in the below
diagram and discus the various aspect that will affect the supply of Polo Mint product.
From the above diagram, it is clearly mentioned that P is the price of product, Q is the
quantity sold, S is the Supply curve and A, B or C points represent the supply relationship. This
diagram show the direct relation between the price and quantity. In the Law of Supply, if price
(P1) is increase then Quantity (Q1) also increase same as if price of product decrease then
selling quantity also decrease. It has positive relation so they work according to this & supply
curve will change on the basis of price and product price will affected by the various economic
factors (Kakarot-Handtke, 2014).
Change in the demand or supply curve will be occur because of the time factor. Because
supply of product not immediately change it required time and based on product price &
demand. So it is important for the Breath Mint company to identify that whether change in the
4
⊘ This is a preview!⊘
Do you want full access?
Subscribe today to unlock all pages.
Trusted by 1+ million students worldwide
price will affect the demand of product for the permanent or temporary basis. Sudden change in
the demand can be occur in the different seasons such as requirement of umbrellas in the rainy
season will increase the temporary demand. For this, supplier need to identify the product
demand and change the equilibrium and production level to meet the long term demand (Lee and
Mykland, 2012).
Relationship of Supply & Demand will affect he price of Polo Mint product and it also
affect the pattern of consumption. Such as, if other product price will increase then demand of
Polo Mint will be increase and same as if other product price decrease then demand of Polo Mint
also decrease. So basically price of their own product or competitive product will affect the price
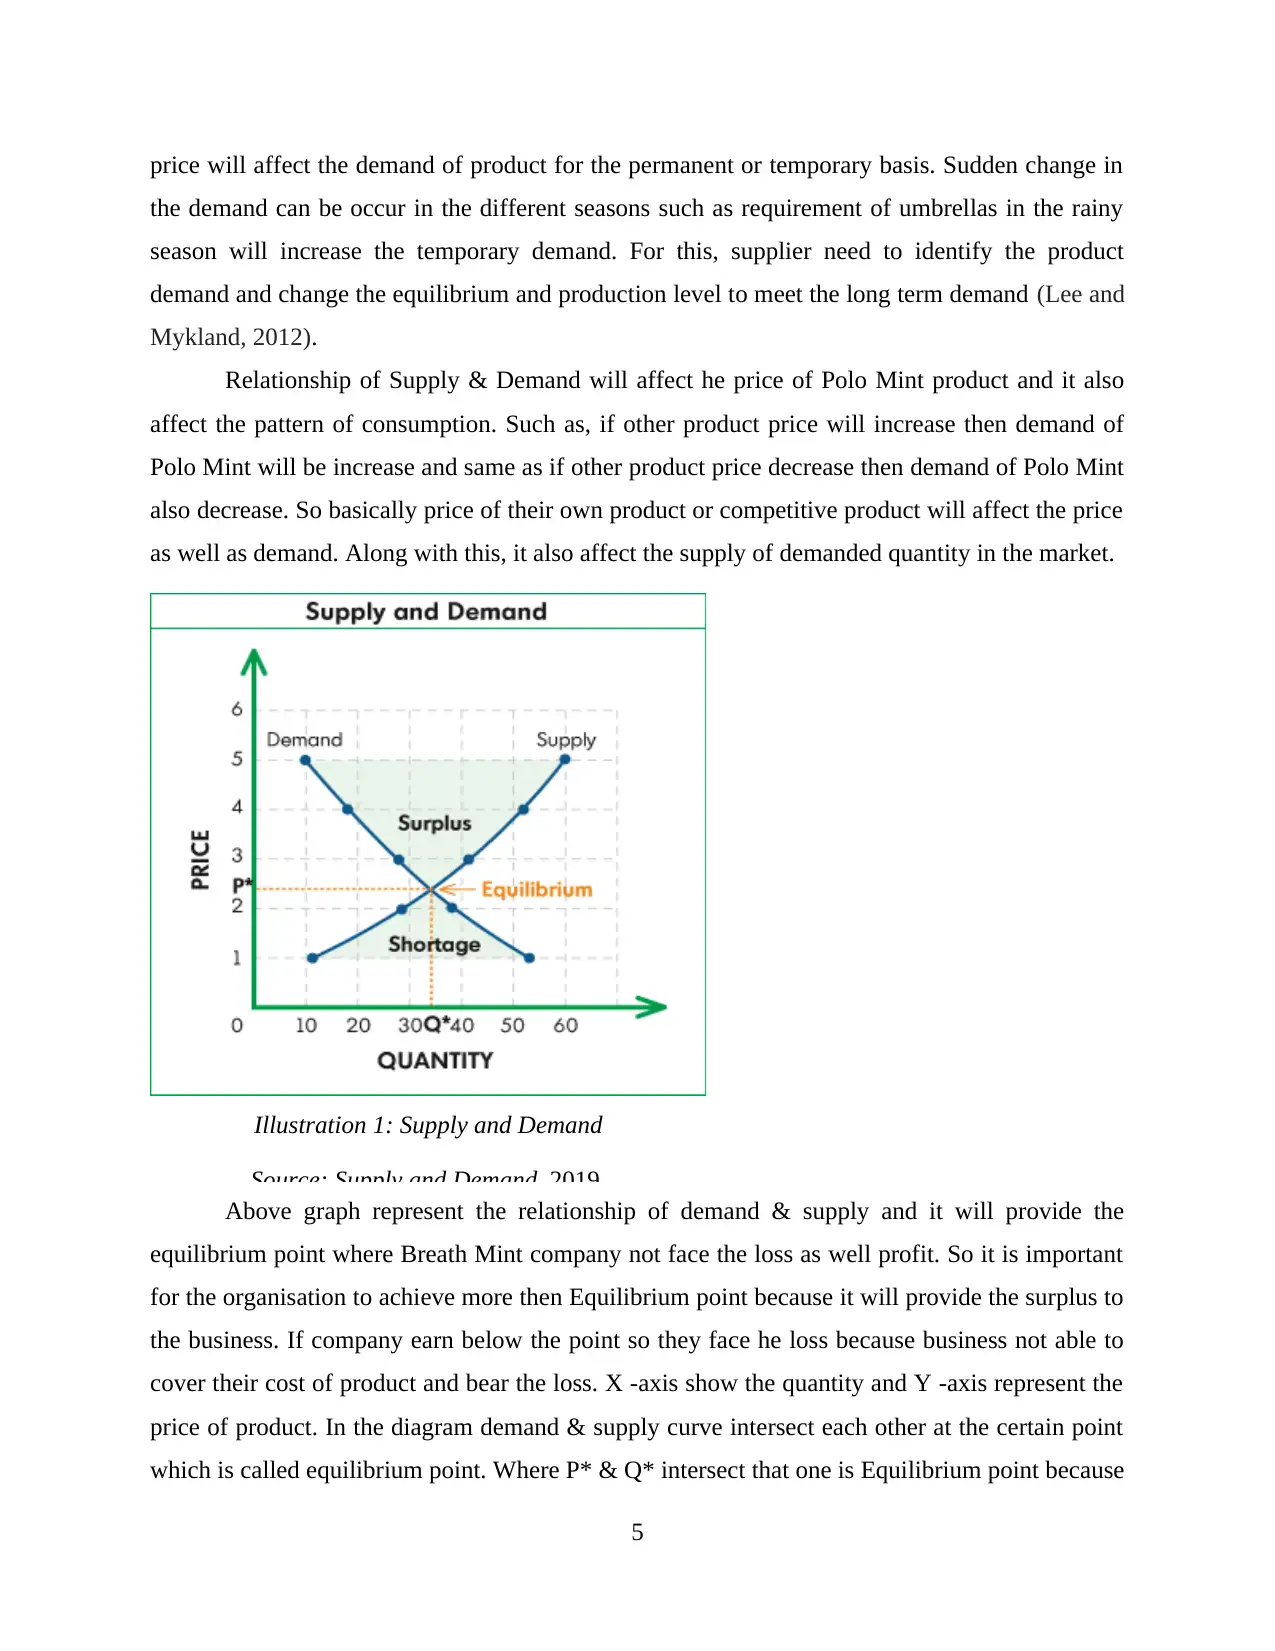
as well as demand. Along with this, it also affect the supply of demanded quantity in the market.
Illustration 1: Supply and Demand
Source: Supply and Demand, 2019.
Above graph represent the relationship of demand & supply and it will provide the
equilibrium point where Breath Mint company not face the loss as well profit. So it is important
for the organisation to achieve more then Equilibrium point because it will provide the surplus to
the business. If company earn below the point so they face he loss because business not able to
cover their cost of product and bear the loss. X -axis show the quantity and Y -axis represent the
price of product. In the diagram demand & supply curve intersect each other at the certain point
which is called equilibrium point. Where P* & Q* intersect that one is Equilibrium point because
5
the demand can be occur in the different seasons such as requirement of umbrellas in the rainy
season will increase the temporary demand. For this, supplier need to identify the product
demand and change the equilibrium and production level to meet the long term demand (Lee and
Mykland, 2012).
Relationship of Supply & Demand will affect he price of Polo Mint product and it also
affect the pattern of consumption. Such as, if other product price will increase then demand of
Polo Mint will be increase and same as if other product price decrease then demand of Polo Mint
also decrease. So basically price of their own product or competitive product will affect the price
as well as demand. Along with this, it also affect the supply of demanded quantity in the market.
Illustration 1: Supply and Demand
Source: Supply and Demand, 2019.
Above graph represent the relationship of demand & supply and it will provide the
equilibrium point where Breath Mint company not face the loss as well profit. So it is important
for the organisation to achieve more then Equilibrium point because it will provide the surplus to
the business. If company earn below the point so they face he loss because business not able to
cover their cost of product and bear the loss. X -axis show the quantity and Y -axis represent the
price of product. In the diagram demand & supply curve intersect each other at the certain point
which is called equilibrium point. Where P* & Q* intersect that one is Equilibrium point because
5
Paraphrase This Document
Need a fresh take? Get an instant paraphrase of this document with our AI Paraphraser
there business have to perform their operational activities on the basis of production it will
provide the surplus as well as shortage of money (Marchand and Hennig-Thurau, 2013).
Equilibrium is the point where market generate the equal amount of supply and demand
of product & services. In the Breath Mint company, organisation have to produce the equal
proportion of Polo Mint and sold in the market for the optimum position. Further explanation
will based on the diagram which help the business or it's user for the better or easy analysis.
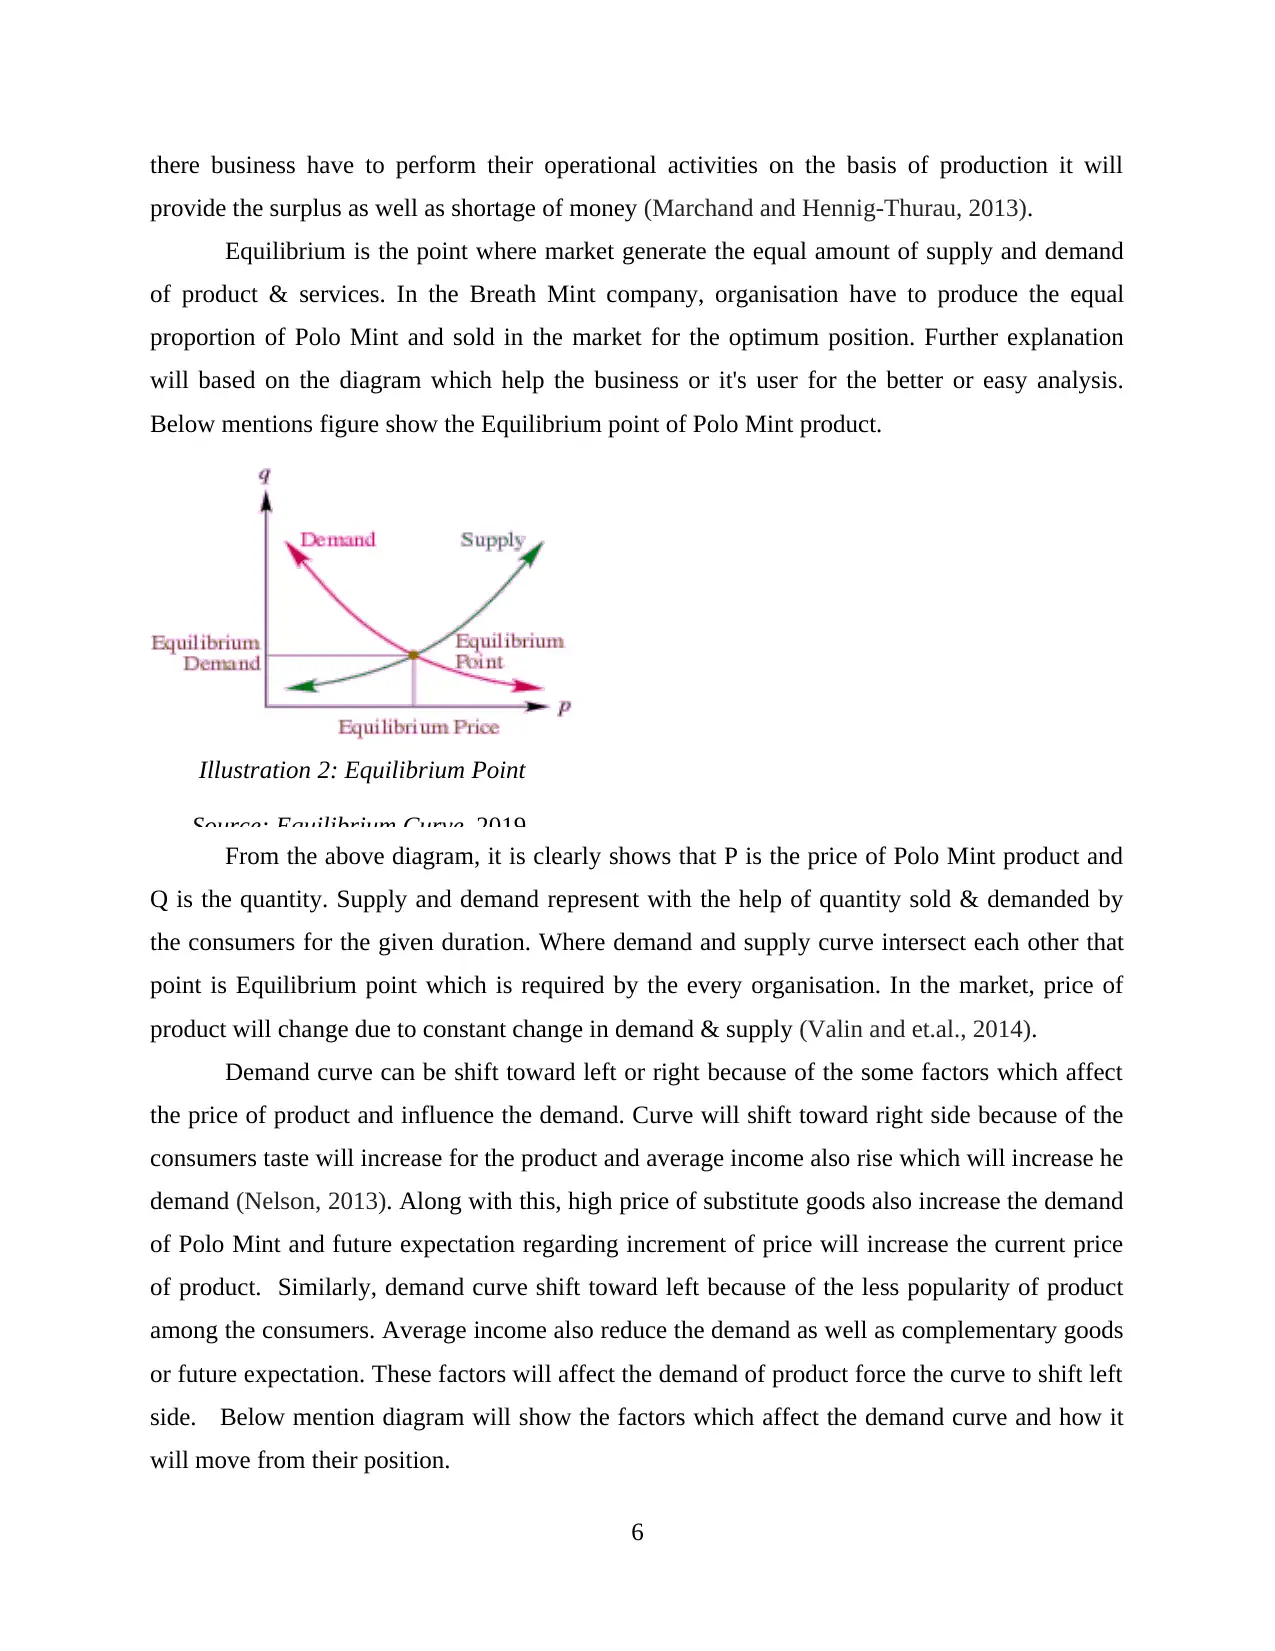
Below mentions figure show the Equilibrium point of Polo Mint product.
Illustration 2: Equilibrium Point
Source: Equilibrium Curve, 2019.
From the above diagram, it is clearly shows that P is the price of Polo Mint product and
Q is the quantity. Supply and demand represent with the help of quantity sold & demanded by
the consumers for the given duration. Where demand and supply curve intersect each other that
point is Equilibrium point which is required by the every organisation. In the market, price of
product will change due to constant change in demand & supply (Valin and et.al., 2014).
Demand curve can be shift toward left or right because of the some factors which affect
the price of product and influence the demand. Curve will shift toward right side because of the
consumers taste will increase for the product and average income also rise which will increase he
demand (Nelson, 2013). Along with this, high price of substitute goods also increase the demand
of Polo Mint and future expectation regarding increment of price will increase the current price
of product. Similarly, demand curve shift toward left because of the less popularity of product
among the consumers. Average income also reduce the demand as well as complementary goods
or future expectation. These factors will affect the demand of product force the curve to shift left
side. Below mention diagram will show the factors which affect the demand curve and how it
will move from their position.
6
provide the surplus as well as shortage of money (Marchand and Hennig-Thurau, 2013).
Equilibrium is the point where market generate the equal amount of supply and demand
of product & services. In the Breath Mint company, organisation have to produce the equal
proportion of Polo Mint and sold in the market for the optimum position. Further explanation
will based on the diagram which help the business or it's user for the better or easy analysis.
Below mentions figure show the Equilibrium point of Polo Mint product.
Illustration 2: Equilibrium Point
Source: Equilibrium Curve, 2019.
From the above diagram, it is clearly shows that P is the price of Polo Mint product and
Q is the quantity. Supply and demand represent with the help of quantity sold & demanded by
the consumers for the given duration. Where demand and supply curve intersect each other that
point is Equilibrium point which is required by the every organisation. In the market, price of
product will change due to constant change in demand & supply (Valin and et.al., 2014).
Demand curve can be shift toward left or right because of the some factors which affect
the price of product and influence the demand. Curve will shift toward right side because of the
consumers taste will increase for the product and average income also rise which will increase he
demand (Nelson, 2013). Along with this, high price of substitute goods also increase the demand
of Polo Mint and future expectation regarding increment of price will increase the current price
of product. Similarly, demand curve shift toward left because of the less popularity of product
among the consumers. Average income also reduce the demand as well as complementary goods
or future expectation. These factors will affect the demand of product force the curve to shift left
side. Below mention diagram will show the factors which affect the demand curve and how it
will move from their position.
6
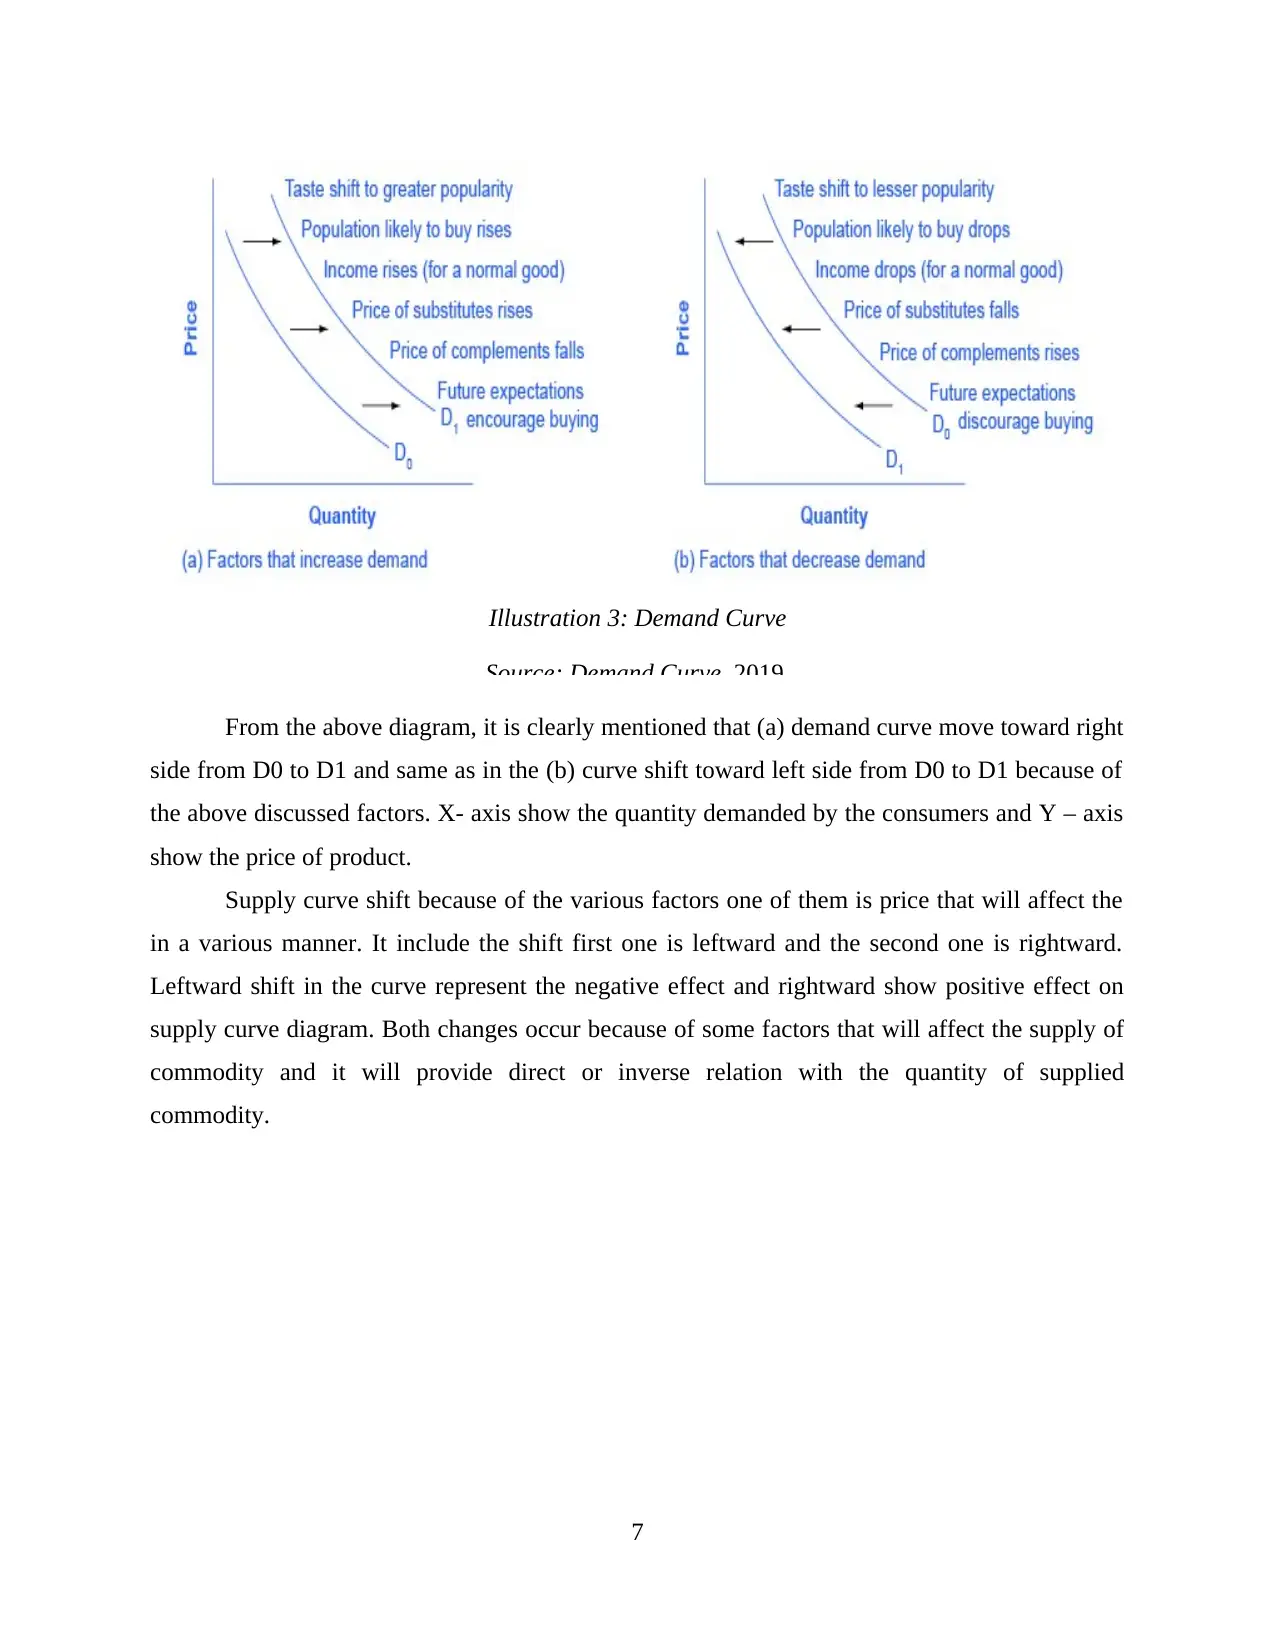
Illustration 3: Demand Curve
Source: Demand Curve, 2019.
From the above diagram, it is clearly mentioned that (a) demand curve move toward right
side from D0 to D1 and same as in the (b) curve shift toward left side from D0 to D1 because of
the above discussed factors. X- axis show the quantity demanded by the consumers and Y – axis
show the price of product.
Supply curve shift because of the various factors one of them is price that will affect the
in a various manner. It include the shift first one is leftward and the second one is rightward.
Leftward shift in the curve represent the negative effect and rightward show positive effect on
supply curve diagram. Both changes occur because of some factors that will affect the supply of
commodity and it will provide direct or inverse relation with the quantity of supplied
commodity.
7
⊘ This is a preview!⊘
Do you want full access?
Subscribe today to unlock all pages.
Trusted by 1+ million students worldwide
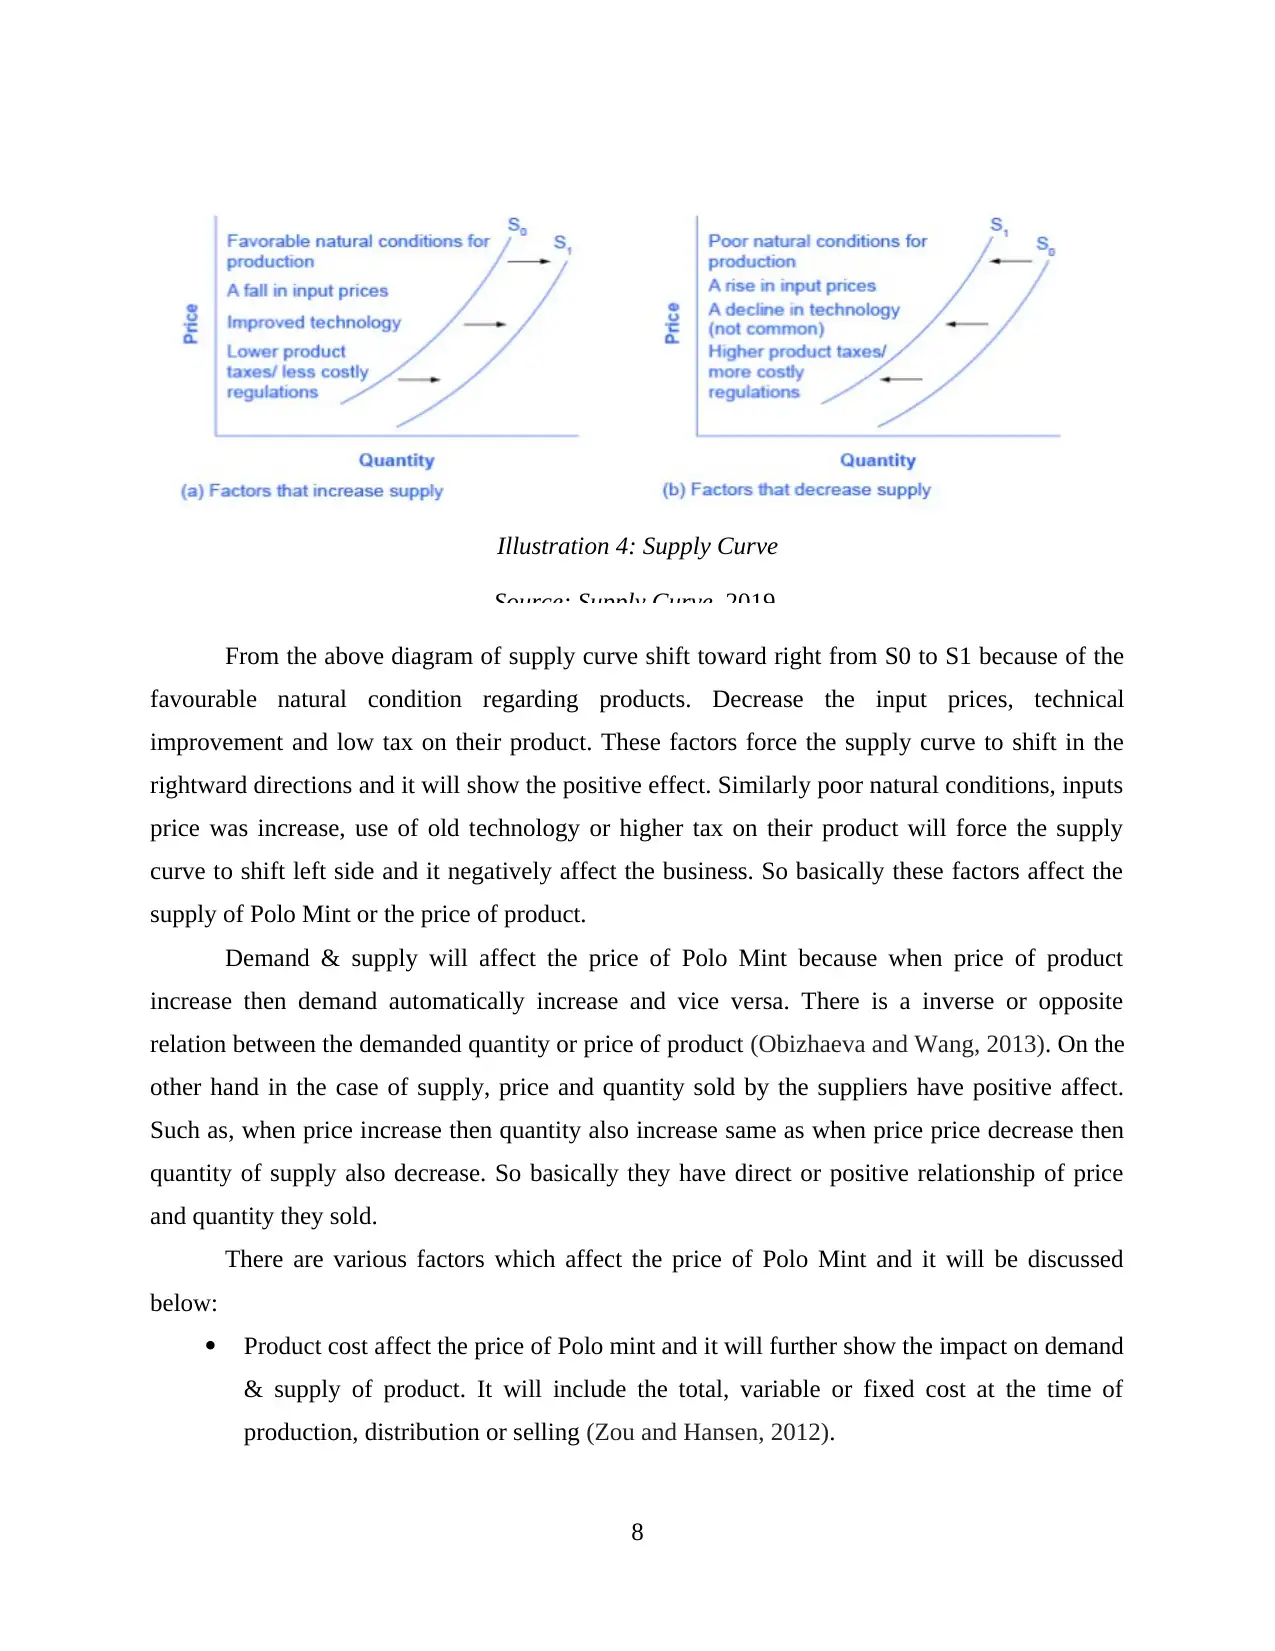
Illustration 4: Supply Curve
Source: Supply Curve, 2019.
From the above diagram of supply curve shift toward right from S0 to S1 because of the
favourable natural condition regarding products. Decrease the input prices, technical
improvement and low tax on their product. These factors force the supply curve to shift in the
rightward directions and it will show the positive effect. Similarly poor natural conditions, inputs
price was increase, use of old technology or higher tax on their product will force the supply
curve to shift left side and it negatively affect the business. So basically these factors affect the
supply of Polo Mint or the price of product.
Demand & supply will affect the price of Polo Mint because when price of product
increase then demand automatically increase and vice versa. There is a inverse or opposite
relation between the demanded quantity or price of product (Obizhaeva and Wang, 2013). On the
other hand in the case of supply, price and quantity sold by the suppliers have positive affect.
Such as, when price increase then quantity also increase same as when price price decrease then
quantity of supply also decrease. So basically they have direct or positive relationship of price
and quantity they sold.
There are various factors which affect the price of Polo Mint and it will be discussed
below:
Product cost affect the price of Polo mint and it will further show the impact on demand
& supply of product. It will include the total, variable or fixed cost at the time of
production, distribution or selling (Zou and Hansen, 2012).
8
Paraphrase This Document
Need a fresh take? Get an instant paraphrase of this document with our AI Paraphraser
Utility and Demand of the product also affect the price in term of high and low. When
product is elastic then some of the price variation will change the quantity of product.
On the other hand, inelastic demand will not affect the price as well as demand.
Competition in the market also affect the price of Polo Mint because every organisation
fix their product price if competition is low. But higher degree of competition will not
provide this power to set product price of their own.
CONCLUSION
From the above discussion, it has been concluded that demand & supply of the product
will affect the price. For this organisation need to follow various theory such as law of demand
or law of supply it will provide the clear picture that will show the market demand & supply in
the graphical form. These curves are easy to be understand by others and organisation also
determine the equilibrium point. It will help the business to identify whether it provide benefit or
loss to the company. This report also include the factors which for the demand as well as supply
curve to shift and also show the relationship among the supply, demand & equilibrium point.
9
REFERENCE
Books & Journal
Assous, M., Bruno, O. and Legrand, M. D. P., 2014. The law of diminishing elasticity of demand
in Harrod's trade cycle. Cahiers d'économie politique/Papers in Political Economy. (2).
pp.159-173.
Azevedo, E. M. and Leshno, J. D., 2016. A supply and demand framework for two-sided
matching markets. Journal of Political Economy. 124(5). pp.1235-1268.
Bohi, D. R., 2013. Analyzing demand behavior: a study of energy elasticities. RFF Press.
Heakal, R., 2015. Economics basics: Supply and demand. Investopedia. accessed September. 28.
Kaiser, H. M., 2016. An economic analysis of the Cattlemen’s Beef Promotion and Research
Board demand-enhancing programmes. Applied Economics. 48(4). pp.312-320.
Kakarot-Handtke, E., 2014. The Law of Supply and Demand: Here it is Finally. Available at
SSRN 2481840.
Lee, S. S. and Mykland, P. A., 2012. Jumps in equilibrium prices and market microstructure
noise. Journal of Econometrics. 168(2). pp.396-406.
Marchand, A. and Hennig-Thurau, T., 2013. Value creation in the video game industry: Industry
economics, consumer benefits, and research opportunities. Journal of Interactive
Marketing. 27(3). pp.141-157.
Nelson, R. R., 2013. Demand, supply, and their interaction on markets, as seen from the
perspective of evolutionary economic theory. Journal of Evolutionary Economics.
23(1). pp.17-38.
Obizhaeva, A. A. and Wang, J., 2013. Optimal trading strategy and supply/demand
dynamics. Journal of Financial Markets. 16(1). pp.1-32.
Valin, H., and et.al., 2014. The future of food demand: understanding differences in global
economic models. Agricultural Economics. 45(1). pp.51-67.
Zou, B. and Hansen, M., 2012. Flight delays, capacity investment and social welfare under air
transport supply-demand equilibrium. Transportation Research Part A: Policy and
Practice. 46(6). pp.965-980.
Online
Demand Curve. 2019. [Online]. Available through:
<https://www.khanacademy.org/economics-finance-domain/microeconomics/supply-
demand-equilibrium/demand-curve-tutorial/a/what-factors-change-demand>
Supply Curve. 2019. [Online]. Avialble through:
<https://www.toppr.com/guides/economics/the-theory-of-firm-under-perfect-
competition/supply-curve-of-a-firm/>
Equilibrium Curve. 2019. [Online]. Available through:
<https://www.dineshbakshi.com/ib-economics/microeconomics/revision-notes/678-
market-equilibrium-price-determination>
Supply and Demand. 2019. [Online]. Avialble through:
<https://www.ducksters.com/money/supply_and_demand.php>
10
⊘ This is a preview!⊘
Do you want full access?
Subscribe today to unlock all pages.
Trusted by 1+ million students worldwide
1 out of 13
Related Documents


Your All-in-One AI-Powered Toolkit for Academic Success.
+13062052269
info@desklib.com
Available 24*7 on WhatsApp / Email
![[object Object]](/_next/static/media/star-bottom.7253800d.svg)
Unlock your academic potential
Copyright © 2020–2026 A2Z Services. All Rights Reserved. Developed and managed by ZUCOL.