Economic Analysis of Demand and Supply for Polo Mint in the UK
VerifiedAdded on 2020/10/22
|12
|3005
|468
Report
AI Summary
This report delves into the core principles of business economics, focusing on the theory of demand and supply. It begins by defining demand and supply, explaining the laws governing them, and illustrating them with demand and supply curves and schedules. The report then explores various factors that influence both demand and supply, including price of related goods, consumer preferences, income levels, and production costs. It examines different types of demand, such as income demand, joint demand, and composite demand. Furthermore, the report applies these concepts to a real-world scenario, analyzing the demand and supply dynamics of Polo Mint in the UK. The report concludes with an analysis of market equilibrium, the point where demand and supply intersect, and the impact of changes in demand and supply on market prices. This provides a comprehensive understanding of how economic principles shape business decisions and market outcomes.
Economics of Business
Paraphrase This Document
Need a fresh take? Get an instant paraphrase of this document with our AI Paraphraser

INTRODUCTION
Economics of business means using economic theories and methods to analyse business
enterprise and its factors. Or it refers to apply economic concepts to real business situation.
Economics is necessary for every business, as resources are scarce and should be used in best
possible way thus economics make optimum utilization of scarce resources. .The present study
is about theory of demand and supply analysis and different factors affecting price of Polo Mint
in UK. In addition to this a brief study is done on determining price of Polo Mint using demand
and supply curve. Also a depth study is done on effect of equilibrium on demand and supply
curve and.
TASK 1
Theory of Demand and supply
Demand-refers to need or want of an individual to buy a product or demand is formed
when an individual have will to buy a product in addition to this having money to buy that
product. The quantity demanded for a good or service is the amount an individual plan to buy in
a particular period of time at the available price.
Law of Demand states that price and quantity demanded are inversely propotional to
each other or other things remain constant demand and price have inverse relationship between
them. The law of demand have two effects-a) Substitution effect means if price of quantity
demanded increases then consumer will shift to substitute of the product which leads to decrease
in price of quantity demanded. b) Income effect means if price of goods and services increase
then people cannot afford all the things which they were buying , on other hand if income of the
consumer increases then people can afford all the things which were bought by them previously
even if price of product and services increases.
Assumption of law of demand
Income of the consumer remains constant
Habits and preferences of consumer remains constant
There is no change in technology
There will be no change in future price of the commodity
There is a restriction on distribution of income
there is no change in income of the consumer
there is no change in government policies.
1
⊘ This is a preview!⊘
Do you want full access?
Subscribe today to unlock all pages.
Trusted by 1+ million students worldwide
Demand Curve and demand schedule- Demand curve is the graphical representation
which show different quantity demanded at different price on the other hand demand schedule is
the tabular representation that shows relationship between different quantity demanded at
different prices.
Exception of law of demand- a) Giffen Goods- Law of demand fails in case of giffen
good, means those goods for which demand increases with the increase in price .For ex. Irish
people love to eat potatoes ,so after some time price of potatoes increases but people in Irish did
not shift to other substitute rather they were cutting their budget on other expensive meal like
meat and beef . Therefore, here demand of potatoes increases with the increase in price. The
second exception is Article of distinction means those goods which are luxurious and are highly
valuable for ex. Diamond , if price of diamond decrease people will not purchase it , as diamond
is purchased because of its high price and value and this become an exception of law of demand.
Types of Demand- There can be following types of demand -
Income demand- means consumer will buy different quantities of a product or service at
different level of income. If income of the consumer increases then it will increase the
demand of commodity unless the product is of inferior quality and if income of the
consumer decreases then quantity demanded will also decrease .
Joint demand – refers to a demand when two products are demanded jointly at the same
time. For ex. If one has demanded to construct a house then this need several other things
like bricks, cement ,lime etc. .Similarly, one need so many things to prepare a bread like
flour, oven, fuel etc.
Composite demand - It means demand of that product which can be used for several
other purpose. For ex. Coal can be used in domestic fuel, railway engine, factories etc .
Similarly, milk can be used to prepare curd, butter , cheese etc.
Derived demand - It means demand for those commodities which is used to make or
prepare another goods or service. For ex. Demanding inputs and other factors like labor
and raw material, to build a complex. Here demand of labour and raw material is derived
or indirect demand as it is helping in constructing a complex.
Market Demand – Refers to demand when a group of people buying different quantities
at different prices at the given time. For example Five people are buying 2 kg, 3 kg, 1 kg,
4 kg and 6 kg of apples, this is called market demand.
2
Paraphrase This Document
Need a fresh take? Get an instant paraphrase of this document with our AI Paraphraser
Organisation demand – when different quantities of commodity of industries or
organisation are demanded then it is said to be organisational or industrial demand. For
example demand of cars like Toyota, Maruti Suzuki are organization demand.
Demand for Perishable and Durable goods- Perishable goods refers to those goods that
can not be used more than one time or these products have very short life. Example food
items, coal , fuel etc. So demand of this kind of commodities are known as demand for
perishable goods. On the other hand durable goods refers to those goods which can be
used several times and has longer life and it does not only fulfil present demand but also
future demand of the consumer. For example- buildings, machines , cloths etc.
Short term and long term demand – Demand for products that are used for shorter
period of time for example demand for raincoats, jumper, umbrellas etc. On the other
hand demand for products that can be used for longer period are said to be long term
demand generally it includes durable goods.
Factors leads to change demand
Price of goods- If price of a commodity increases then its demand will decrease on the
other hand if price of the commodity decreases then its demand will increase, as price and
demand of a commodity are inversely proportional to each other.
Price of related goods – Related goods can be substitute goods and complementary
goods. Substitute goods can be Tea and coffee, if price of tea increases then demand of
coffee will increase similarly if price of tea decreases then demand of coffee will also
decrease. Complementary goods are jointly demanded commodities like car and petrol ,
if price of car increases then demand of petrol decreases similarly if price of car
decreases then demand of petrol will increases.
Tastes and preferences – there can be change in demand due to change in tastes and
preference . Consumer's preference change due to change in habits , fashion etc.
Expectation of future price – If future price of any product will increase then present
demand for that product will gradually increase similarly if there is the possibility of
decreasing in future price of a product then present demand will be low.
Income of consumers- There can be three types of goods for which demand changes
with the change in income. The first category of goods is necessity goods like petrol,
salt , LPG are necessary goods, for these types of goods demand ill not increase with the
3
increase in income and will not decrease with the decrease in income means demand
will remain constant. The second category of goods is normal goods like computers and
electronic items, demand in case of normal good is directly proportional to income means
if income of the consumer will increase that will increase the demand of a normal goods
similarly, if income of consumer will decrease then demand of normal goods will also
decrease. The third category of goods is inferior goods are those demand of which falls
with the increase in income and demand rises with the decrease in income.
Number of consumers -If there are more no. of consumer in market then product
demand will increase and if there are less no. of consumer then there is less chance of
increase in demand of that product.
Shifts and movements in demand
Movements- refers to change in both price and demand from one point to another on curve,
movement can be upward or downward, if there is increase in price of commodity this will
decrease the demand then there will be an upward movement in demand curve also known as
contraction of demand curve similarly if there will be fall in price of the commodity then
downward movement will takes place in demand curve or it is also known as expansion in
demand curve . Thus movement in demand curve only happens in case of change in own price
of a commodity.
Shifts – refers to shifts in demand curve from left to right and right to left. It happens in case of
changing in factors other than own price of commodity. For example in case of substitute goods
like tea and coffee, price of tea increases then demand of coffee will increase then there will a
forward shift in demand curve of coffee or demand curve will shift from left to right. Similarly,
if price of tea decreases then it will decrease the demand of coffee this will lead to backward
shifting in demand curve or demand curve will shift from right to left.
Supply- means total amount of goods available to consumer at the time of purchasing at
particular price.
Law of supply states that other thing remains constant price and quantity supplied are directly
proportional to each other or price and quantity supplied have direct relationship with each other
means if price of a commodity rises then it will increase the quantity supplied , as every producer
or supplier wants to sell their product at increased price to earn higher profit.
4
⊘ This is a preview!⊘
Do you want full access?
Subscribe today to unlock all pages.
Trusted by 1+ million students worldwide
Supply curve and supply schedule - supply curve is the graphical representation that shows
different quantities supplied at different prices and supply schedule is the tabular representation
of quantity supplied and price of the commodity.
Following factors leads to change supply
Cost of factors – If cost of factors and input increases then it will increase cost of
production and ultimately the price of commodity will increase and quantity supply will
decrease and vice versa.
Technology – Introduction of new technology will lead to optimum utilisation of
resources that will reduce wastage of raw material used in producing a commodity this
will decrease cost of product and ultimately increase the supply of the commodity.
Similarly, if there is use of old method of manufacturing products then this will not make
optimum utilisation of resources gradually wastage will increase and it will increase the
cost of product and quantity supply decreases.
Government Policies – Government policies like change in fiscal policy will lead to
change fiscal policy in which government can increase or decrease its tax revenues. If
government will increase tax this will increase the price of commodity gradually supply
will be less and similarly, if tax will be decrease then it will decrease the price of the
product ultimately leads to increase in supply .
Size of the market – If there is an increase in size of market that will gradually increase
in number of firms and ultimately it will increase in quantity supplied , similarly if the
size of market is small than it will generate less consumers for purchasing product and in
this case supply will decrease.
Time - If firm has long time then it can increase its capacity and ultimately increase in
supply.If firm has short period of time to manufacture goods then it cannot maximise its
capacity , this will decrease the supply.
Equilibrium
It is the point where demand is equal to supply. At this stage goods are allocated in the most
effective manner , amount of goods are supplied exactly the amount of goods are demanded. hus
the current economy is in equilibrium.
5
Paraphrase This Document
Need a fresh take? Get an instant paraphrase of this document with our AI Paraphraser
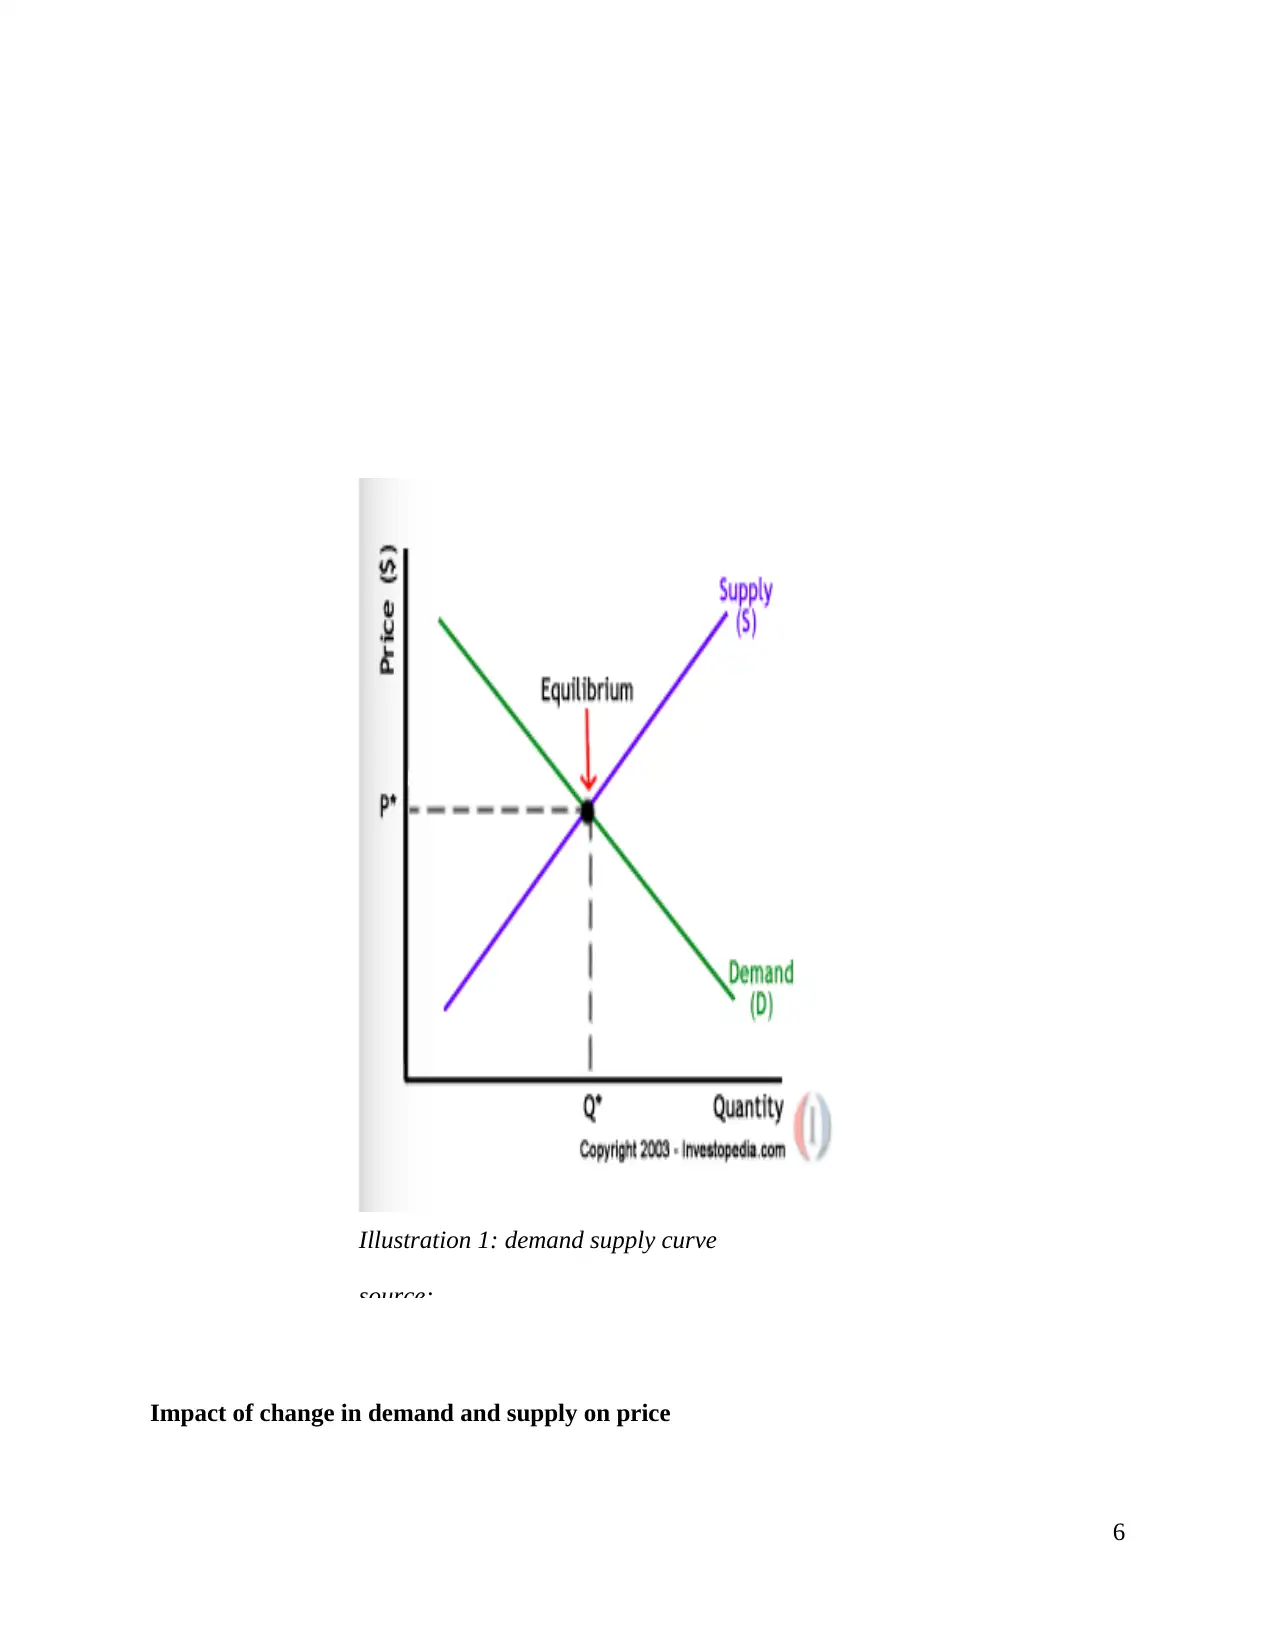
Impact of change in demand and supply on price
6
Illustration 1: demand supply curve
source:
6
Illustration 1: demand supply curve
source:
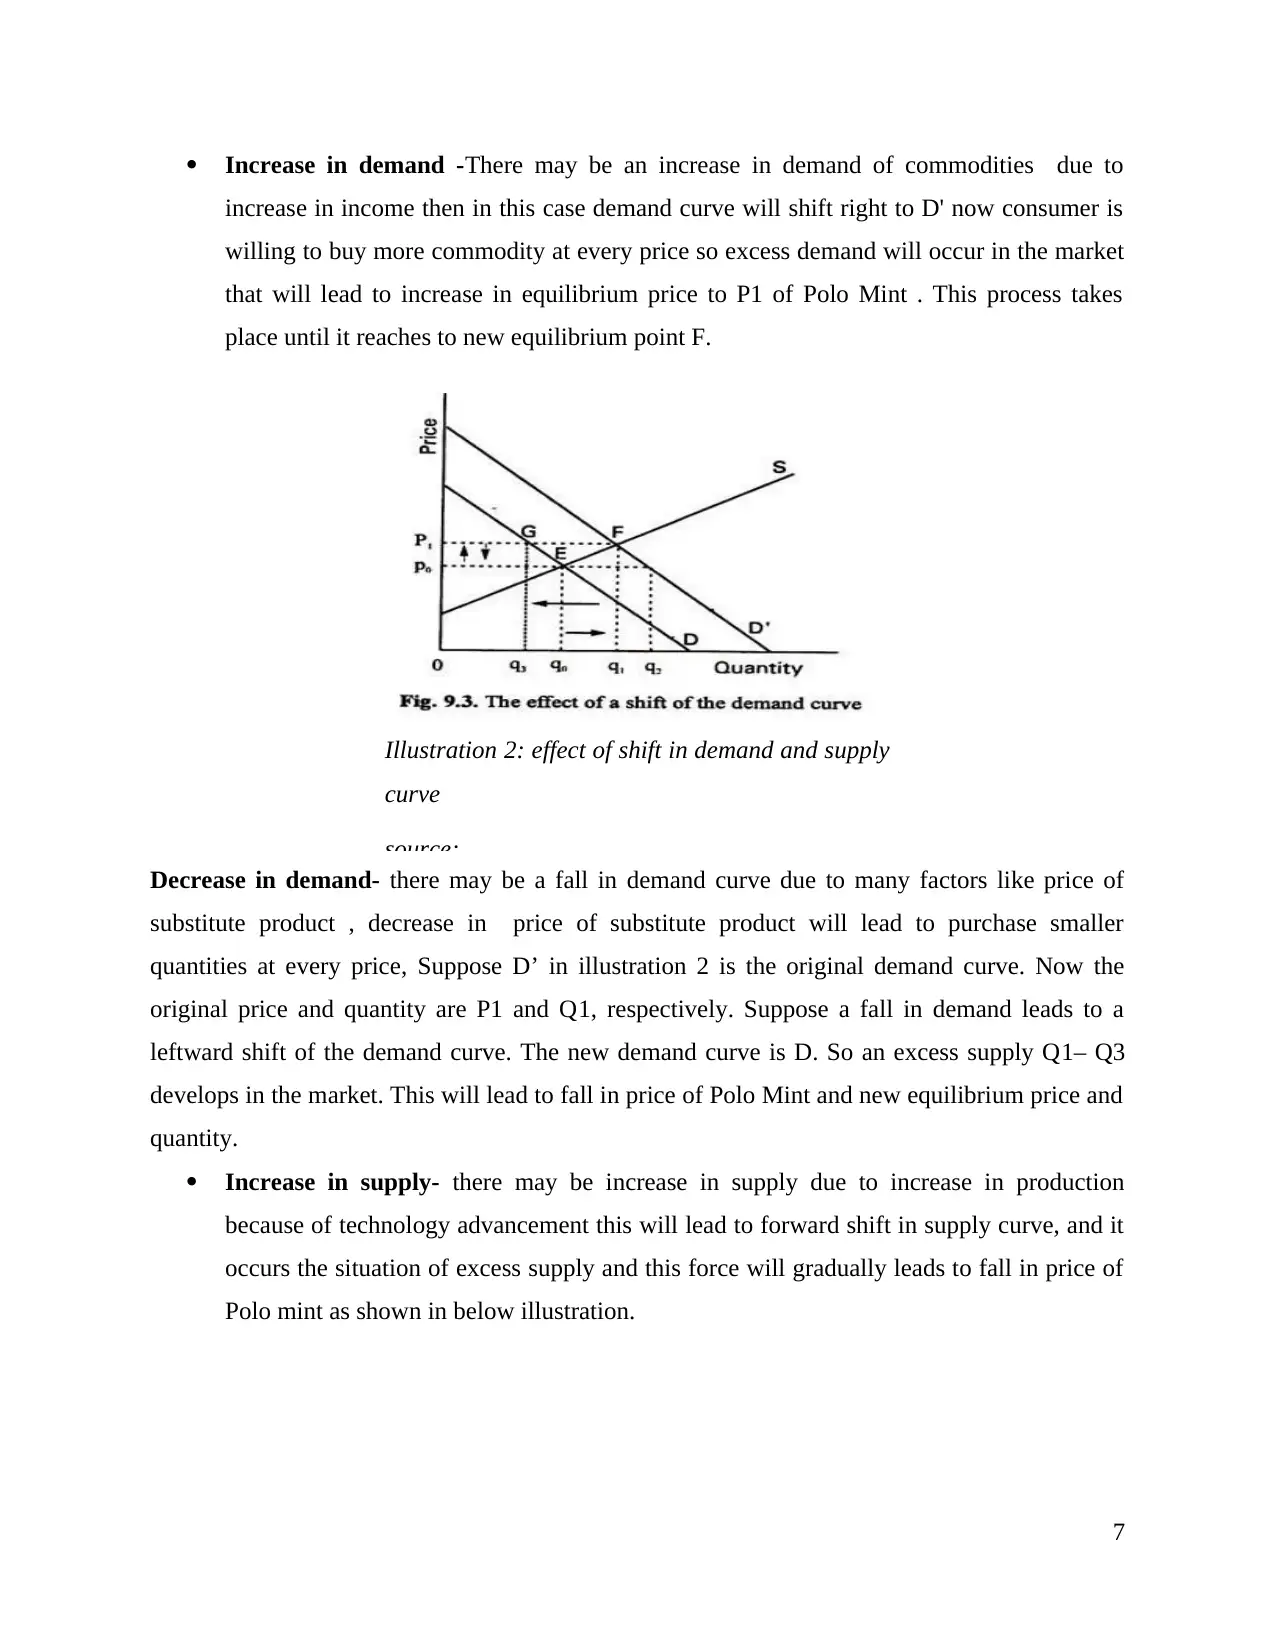
Increase in demand -There may be an increase in demand of commodities due to
increase in income then in this case demand curve will shift right to D' now consumer is
willing to buy more commodity at every price so excess demand will occur in the market
that will lead to increase in equilibrium price to P1 of Polo Mint . This process takes
place until it reaches to new equilibrium point F.
Decrease in demand- there may be a fall in demand curve due to many factors like price of
substitute product , decrease in price of substitute product will lead to purchase smaller
quantities at every price, Suppose D’ in illustration 2 is the original demand curve. Now the
original price and quantity are P1 and Q1, respectively. Suppose a fall in demand leads to a
leftward shift of the demand curve. The new demand curve is D. So an excess supply Q1– Q3
develops in the market. This will lead to fall in price of Polo Mint and new equilibrium price and
quantity.
Increase in supply- there may be increase in supply due to increase in production
because of technology advancement this will lead to forward shift in supply curve, and it
occurs the situation of excess supply and this force will gradually leads to fall in price of
Polo mint as shown in below illustration.
7
Illustration 2: effect of shift in demand and supply
curve
source:
⊘ This is a preview!⊘
Do you want full access?
Subscribe today to unlock all pages.
Trusted by 1+ million students worldwide
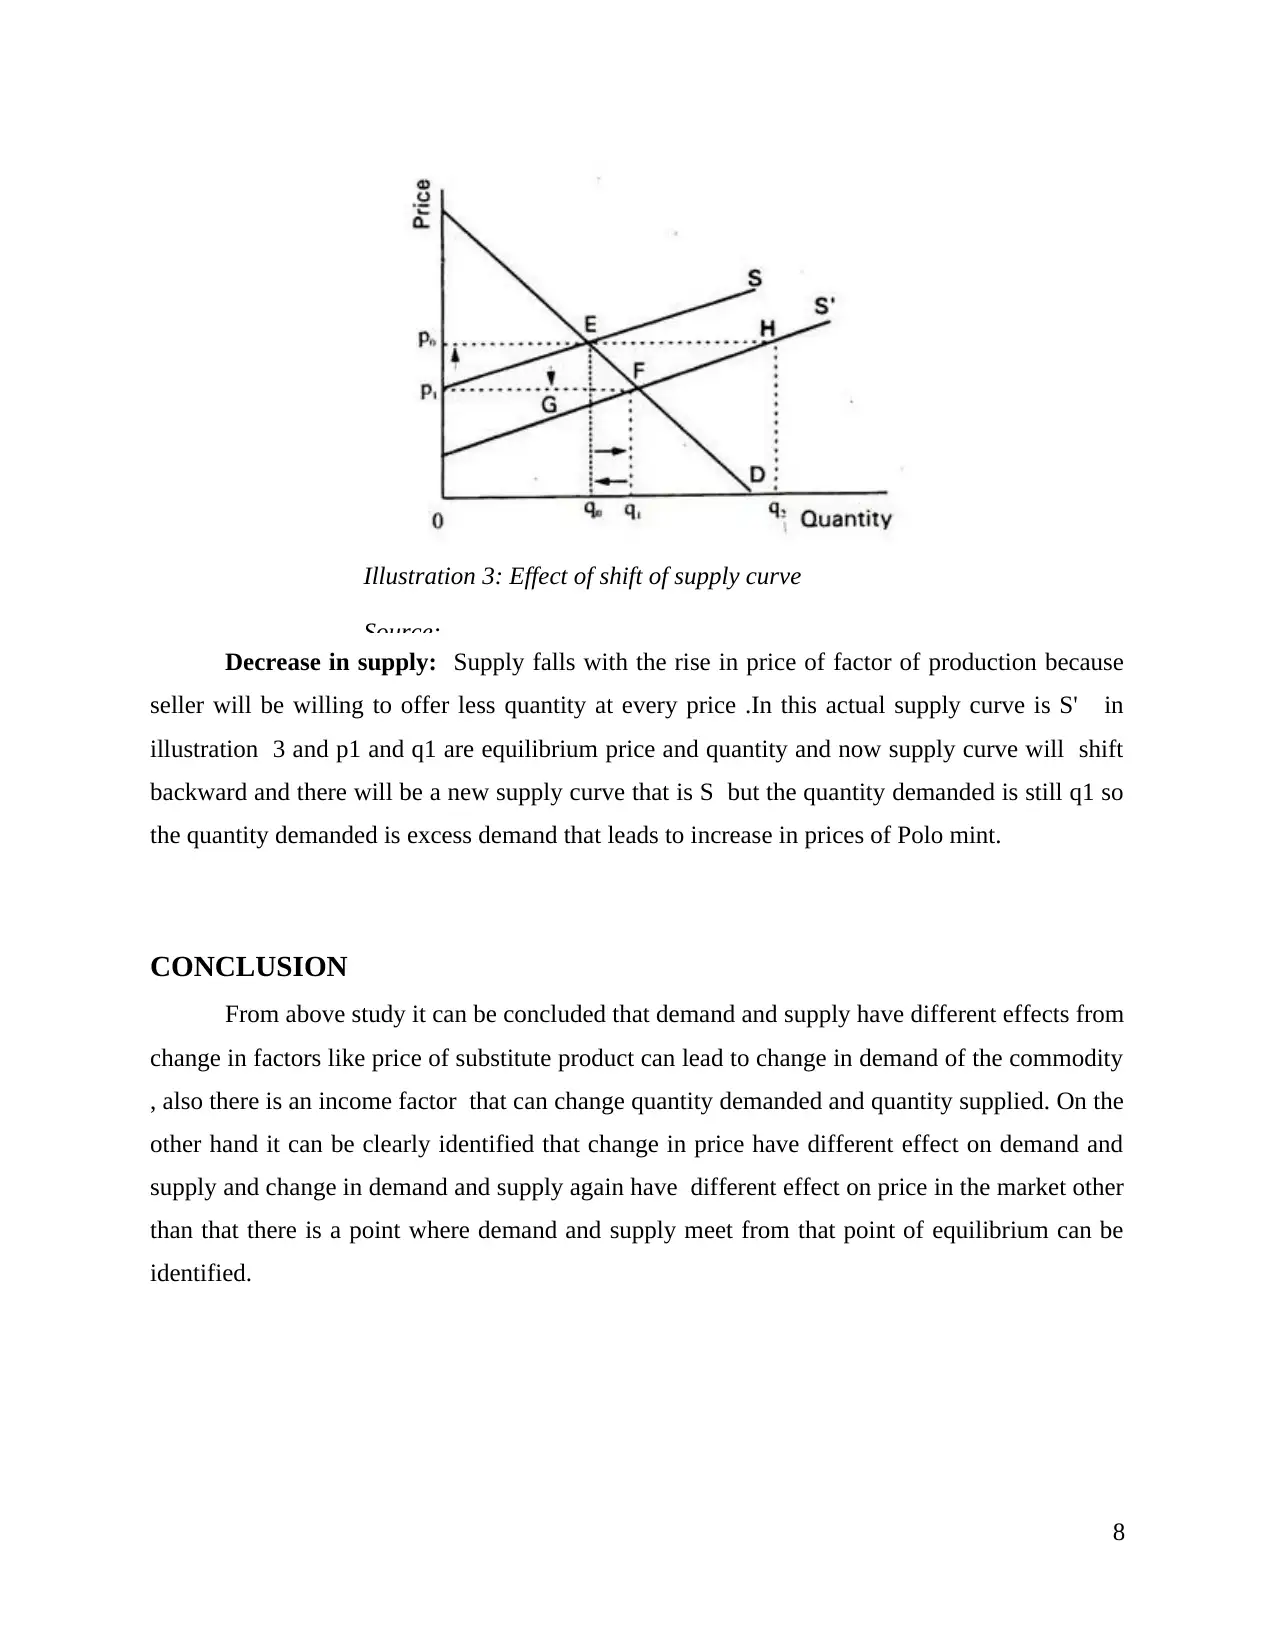
Decrease in supply: Supply falls with the rise in price of factor of production because
seller will be willing to offer less quantity at every price .In this actual supply curve is S' in
illustration 3 and p1 and q1 are equilibrium price and quantity and now supply curve will shift
backward and there will be a new supply curve that is S but the quantity demanded is still q1 so
the quantity demanded is excess demand that leads to increase in prices of Polo mint.
CONCLUSION
From above study it can be concluded that demand and supply have different effects from
change in factors like price of substitute product can lead to change in demand of the commodity
, also there is an income factor that can change quantity demanded and quantity supplied. On the
other hand it can be clearly identified that change in price have different effect on demand and
supply and change in demand and supply again have different effect on price in the market other
than that there is a point where demand and supply meet from that point of equilibrium can be
identified.
8
Illustration 3: Effect of shift of supply curve
Source:
Paraphrase This Document
Need a fresh take? Get an instant paraphrase of this document with our AI Paraphraser
REFERENCE
Books and Journals
Benzaquen, M. and Bouchaud, J. P., 2018. A fractional reaction–diffusion description of supply
and demand. The European Physical Journal B. 91(2). p.23.
Cheng, Y. and et.al., 2018. Advanced manufacturing systems: supply–demand matching of
manufacturing resource based on complex networks and Internet of Things. Enterprise
Information Systems, 12(7), pp.780-797.
Fazzari, S. M., Ferri, P. and Variato, A. M. G., 2018. Demand-led growth and accommodating
supply. Available at SSRN 3108711.
Fortz, B. and et.al., 2018, February. Unit Commitment under Market Equilibrium Constraints.
In Congrès annuel de la société Française de Recherche Opérationnelle et d’Aide à la
Décision (ROADEF).
Glazier, D. S., 2018. Resource Supply and Demand Both Affect Metabolic Scaling: A Response
to Harrison. Trends in ecology & evolution. 33(4). pp.237-238.
Mikheev, A.V., 2018. Probabilistic approach to mathematical description of market
equilibrium. Vestnik of Astrakhan State Technical University. Series: Management,
Computer Sciences and Informatics. (4). pp.90-98.
Nguyen, D. T., Le, L. B. and Bhargava, V., 2018. Price-based resource allocation for edge
computing: A market equilibrium approach. IEEE Transactions on Cloud Computing.
Pineda, S., Boomsma, T. K. and Wogrin, S., 2018. Renewable generation expansion under
different support schemes: A stochastic equilibrium approach. European Journal of
Operational Research. 266(3). pp.1086-1099.
Rathi, A. and Meena, G.S., 2017. Demand and Supply Side Factors Affecting Utilization of
Immunization Services in an Urban Village Of Delhi. Adv Tech Biol Med. 5(206). pp.2379-
1764.
Temiño, I. R., Yáñez, A. and Sánchez, M. O., 2019. Archaeological Heritage and Metal
Detectors: Should We Be Managing Supply or Demand?. In Competing Values in
Archaeological Heritage (pp. 139-153). Springer, Cham.
9
Online
Economics Basics: Supply and Demand.2019.[Online].Available
through<https://www.investopedia.com/university/economics/economics3.asp>
Shifts in Demand and Supply (With Diagram).2019.[Online].Available
through.<http://www.economicsdiscussion.net/demand/shifts-in-demand-and-supply-with-
diagram/12519>
10
⊘ This is a preview!⊘
Do you want full access?
Subscribe today to unlock all pages.
Trusted by 1+ million students worldwide
1 out of 12
Related Documents


Your All-in-One AI-Powered Toolkit for Academic Success.
+13062052269
info@desklib.com
Available 24*7 on WhatsApp / Email
![[object Object]](/_next/static/media/star-bottom.7253800d.svg)
Unlock your academic potential
Copyright © 2020–2026 A2Z Services. All Rights Reserved. Developed and managed by ZUCOL.