BM533 Module: Contemporary Economic Analysis Report, GBS, 2024
VerifiedAdded on 2023/01/07
|21
|4790
|20
Report
AI Summary
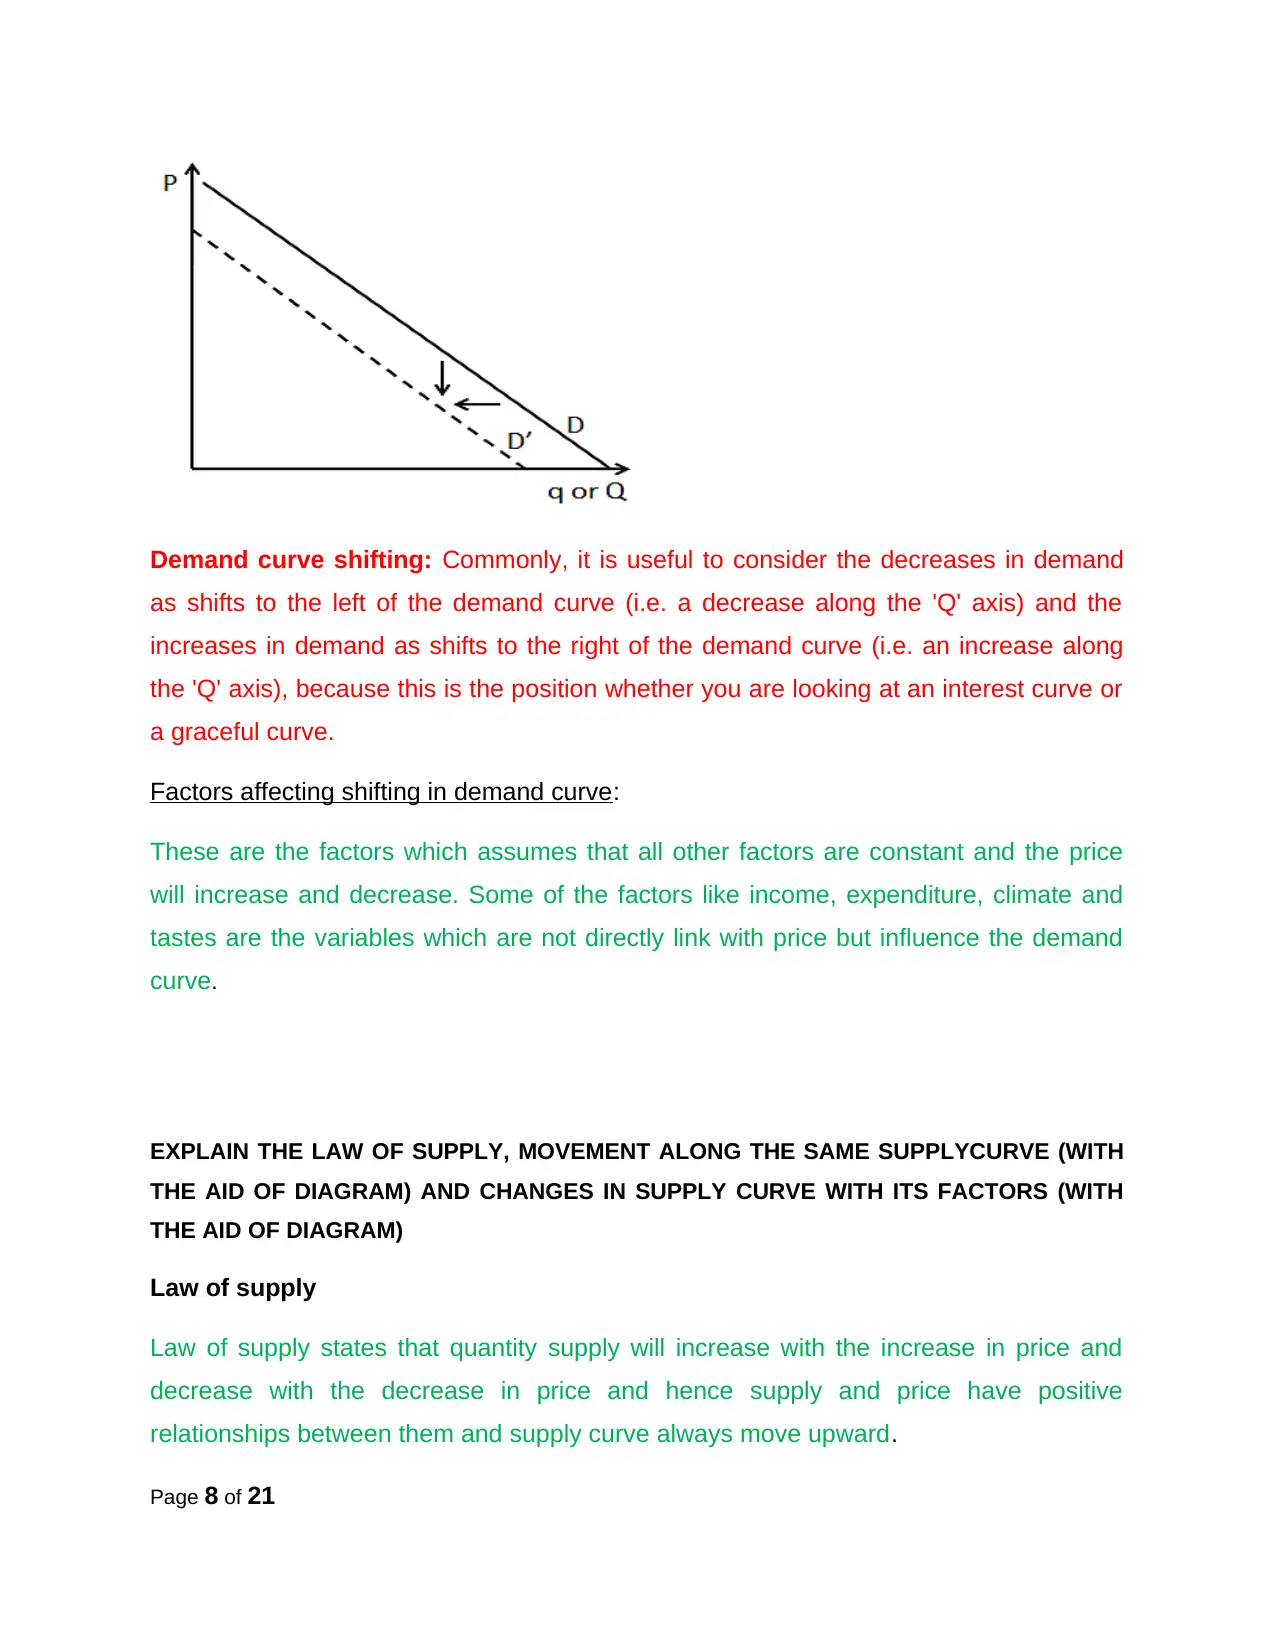
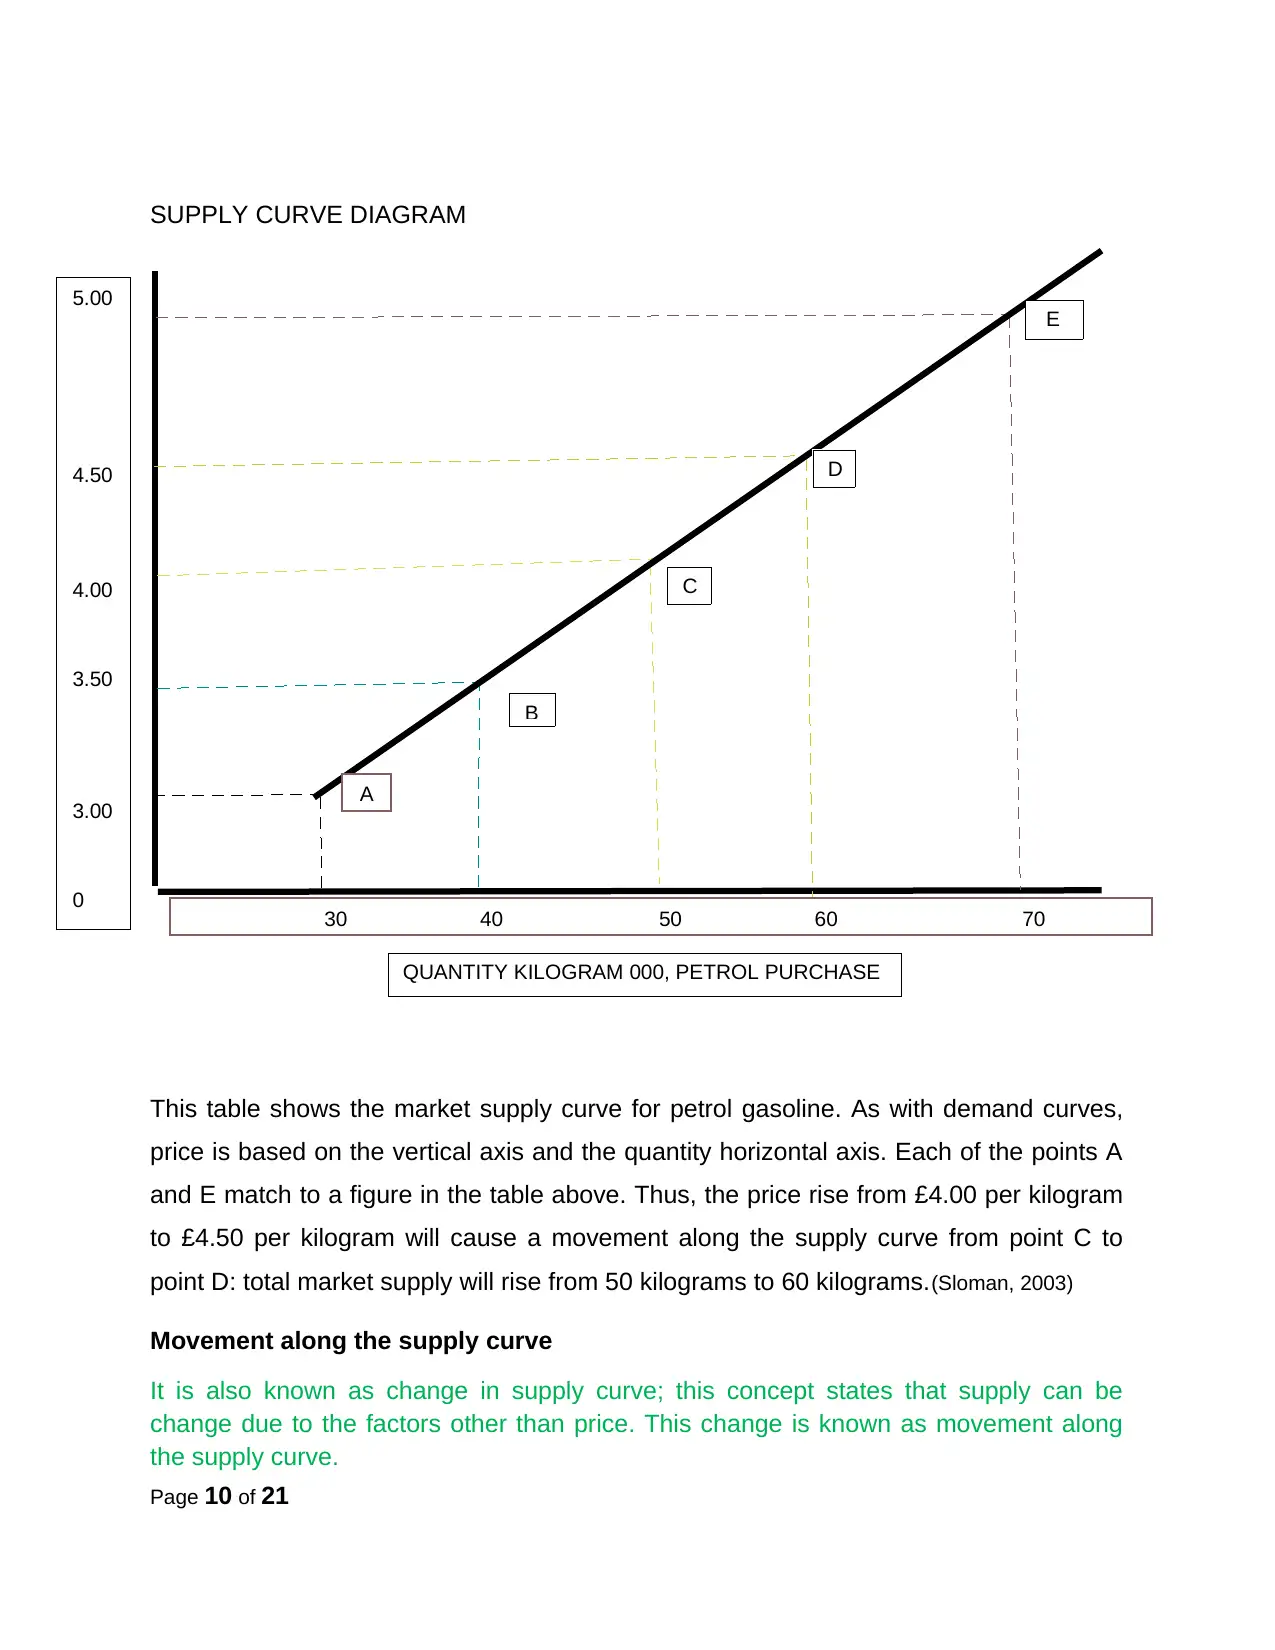
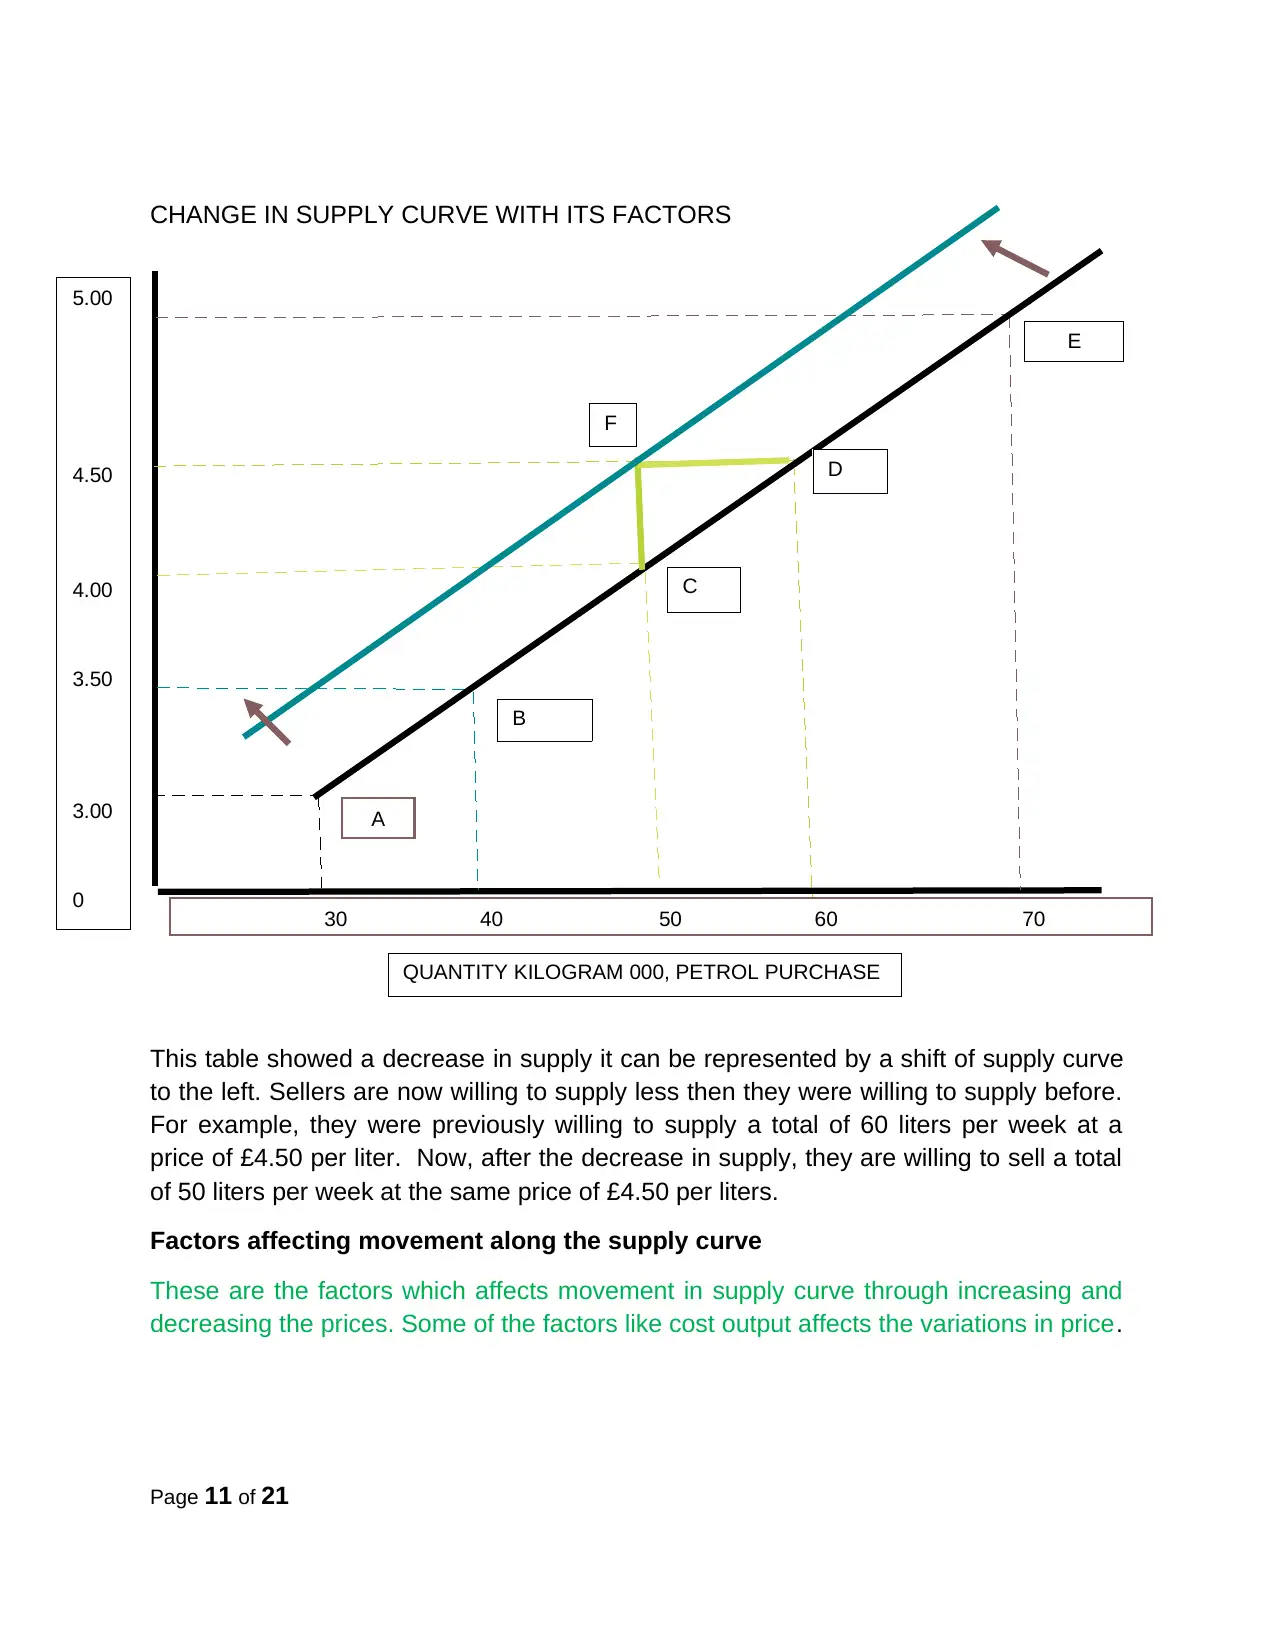
This report provides an in-depth analysis of the laws of demand and supply, illustrating these concepts with diagrams and examples from the petroleum industry. It explains the inverse relationship between price and quantity demanded (law of demand), and the positive relationship between price and quantity supplied (law of supply), including movements along the curves and factors that shift them. The report also compares and contrasts economic theories and models from the 20th and 21st centuries, such as Karl Marx's labor theory of value and the supportive model, relating these theories to modern business practices. The analysis includes diagrams to visualize demand and supply curves, shifts, and movements, providing a comprehensive understanding of the core economic principles and their application in a contemporary business context.

INTRODUCTION
TASK 1
BM533 COURSEWORK: Contemporary Economic Analysis
MODULE TUTOR AT GBS:
TABLE OF CONTENTS
TASK 1
BM533 COURSEWORK: Contemporary Economic Analysis
MODULE TUTOR AT GBS:
TABLE OF CONTENTS
Paraphrase This Document
Need a fresh take? Get an instant paraphrase of this document with our AI Paraphraser

1.1 EXPLAIN THE LAW OF DEMAND, MOVEMENT ALONG THE SAME DEMAND
CURVE
1.2 EXPLAIN THE LAW OF SUPPLY, MOVEMENT ALONG THE SAME SUPPLY
CURVE
TASK 2
COMPARE AND CONTRAST EMERGING THEORIES AND MODELS 21ST
CENTURY CONTEMPORARY ECONOMIC WITH THOSE OF THE 20TH
CENTURY AND RELATE BOTH OF THESE TO MODERN BUSINESS
PRACTICE
CONCLUSION
REFERENCES
Page 1 of 21
CURVE
1.2 EXPLAIN THE LAW OF SUPPLY, MOVEMENT ALONG THE SAME SUPPLY
CURVE
TASK 2
COMPARE AND CONTRAST EMERGING THEORIES AND MODELS 21ST
CENTURY CONTEMPORARY ECONOMIC WITH THOSE OF THE 20TH
CENTURY AND RELATE BOTH OF THESE TO MODERN BUSINESS
PRACTICE
CONCLUSION
REFERENCES
Page 1 of 21

INTRODUCTION
Economics is a concept which deals with production, distribution and consumption
functions of goods and services. This concept can be broken into two broad categories;
macroeconomics and microeconomics. It studies the behavior of aggregate economy
(Spencer, 1990).
Contemporary business analysis is related to modernization of business techniques in
present world. It involves adoption of latest techniques to increase the productivity of the
firm (Spencer, 1990).
This assessment is about explaining the law of demand and supply within the context of
petroleum industry. Task 2, reflects the comparison between 20th and 21st centuries
emerging theories and models. Additional to this contemporary economics concept has
also been discussed with those of the 20th century.
In this assessment Petroleum business has been taken as reference to understand the
various concept of demand and supply law.
Page 2 of 21
⊘ This is a preview!⊘
Do you want full access?
Subscribe today to unlock all pages.

Trusted by 1+ million students worldwide

EXPLAIN THE LAW OF DEMAND, MOVEMENT ALONG THE SAME DEMAND CURVE
(WITH THE AID OF DIAGRAM) AND CHANGE IN DEMAND CURVE WITH FACTORS (WITH
THE AID OF DIAGRAM)
The law of demand states that other factors being constant (cetris peribus), price and
quantity demand of any goods and services are inversely related to each other. When
the price of a product increases, the demand for the same product will fall.(AMADEO,
2019)Movement in the demand curve is when the product experience changes in both
the quantity demanded and price, causing the curve to move in a detailed way such as
rising Movement Indicates contraction of demand, in essence, a fall in demand is
observed due to price rise. And the descending movement it shows expansion in
demand, demand for the product or service goes up because of the fall in prices.
Hence, more quantity of a good is demanded at low prices, while when the prices are
high, the demand inclines to decline.(S, 2018)A change in the price of the good or
service itself is not listed among the factors that can shift a demand curve. A change in
the price of a good or service causes a movement along a specific demand curve, and it
typically leads to some change in the quantity demanded, but it does not shift the
demand curve.(Whelan and Msefer, 1996)
Page 3 of 21
Paraphrase This Document
Need a fresh take? Get an instant paraphrase of this document with our AI Paraphraser

DEMAND CURVE DIAGRAM
The above table shows that when the price was £5 per liter, 30 liters is demanded. If the
price falls to £4.50, the demand increases to 40 liters. Similarly, when the price declines
to £3.00, the demand increases to 70 liters. On the contrary, as the price increase from
£3.00, the demand continues to declines from 70 liters. In the figure, point E of the
demand curve HH1 shows demand for 30 liters at £5.00. As the price falls to £4.50,
£4.00, £3.50, £3.00 the demand rises to 40, 50, 60, 70 liters as commonly. This is clear
from points D, C, B, and A. Thus, the demand curve H, H1 shows an increase in
demand for petrol when its prices fall. This indicates the inverse relation between price
and demand.
Movement along the same demand curve
A change in price causes a movement along the demand curve.
Page 4 of 21
5.00
4.50
4.00
3.50
3.00
PRICE PER LITER OF PETROL
0.00
QUANTITY LITER PETROL PURCHASE ( MILLION )
A
B
C
D
E
7060504030
H
H1

The development of the curve can occur in two ways:
Upward movement: refers to a contraction of demand, in short, a decline in
demand due to price increases.
Downward movement: It refers to the expansion in demand, that is, the demand
for a product or service increases as prices fall.
Therefore, a greater quantity of the good is demanded at lower prices, while when the
prices are higher, the demand decreases.
Page 5 of 21
⊘ This is a preview!⊘
Do you want full access?
Subscribe today to unlock all pages.

Trusted by 1+ million students worldwide

CHANGE IN DEMAND CURVE DIAGRAM
INCREASE IN DEMAND
The above table show when the demand curve change with its factors when there an
increase or decrease in demand so in this table, the demand has increased. The shift
takes place from the old demand curve H1 to the new demand curve H2. For example,
the new curve indicates that, at a price of £4 per liter, the buyer was previously willing to
purchase 50 liters per week. Now after the increase in demand, they are willing to buy
60 liters per week at the same price of £4 per liters.
Change in demand curve shows two types of effects; increase in demand or decrease
in demand, this effect has been discussed below:
Increase in demand: An increase in demand curve can either be due to shifting of
demand curve to the right side or an upward shifting of curve. Shifting of curve to the
right side shows that demand expands and customers will demand a larger amount at
Page 6 of 21
5.00
4.50
4.00
3.50
3.00
PRICE PER LITER OF PETROL
0.00
A
B
C
D
E
7060504030
H
H H2
F
Paraphrase This Document
Need a fresh take? Get an instant paraphrase of this document with our AI Paraphraser

constant price. The upward shift addresses the idea that as demand expands, buyers
are in the position to afford available amount of the item compare to previous situation.
(Note that the horizontal and vertical shifts of a demand curve are generally not of the
same magnitude).
Decrease in demand: In contrast, a decrease in demand is represented by the diagram
above. A decrease in demand can either be a result of shifting of demand curve to the
left or downward shifting of demand curve. The shift to left shows that when demand
decreases, buyers demand a small amount at constant price. The falling moving
average speaks to the idea that when demand falls, shoppers are unwilling and
unwilling to pay for a certain item quantity as soon as possible. (Note that the horizontal
and vertical shifts of a demand curve are generally not of the same magnitude).
Page 7 of 21

Demand curve shifting: Commonly, it is useful to consider the decreases in demand
as shifts to the left of the demand curve (i.e. a decrease along the 'Q' axis) and the
increases in demand as shifts to the right of the demand curve (i.e. an increase along
the 'Q' axis), because this is the position whether you are looking at an interest curve or
a graceful curve.
Factors affecting shifting in demand curve:
These are the factors which assumes that all other factors are constant and the price
will increase and decrease. Some of the factors like income, expenditure, climate and
tastes are the variables which are not directly link with price but influence the demand
curve.
EXPLAIN THE LAW OF SUPPLY, MOVEMENT ALONG THE SAME SUPPLYCURVE (WITH
THE AID OF DIAGRAM) AND CHANGES IN SUPPLY CURVE WITH ITS FACTORS (WITH
THE AID OF DIAGRAM)
Law of supply
Law of supply states that quantity supply will increase with the increase in price and
decrease with the decrease in price and hence supply and price have positive
relationships between them and supply curve always move upward.
Page 8 of 21
⊘ This is a preview!⊘
Do you want full access?
Subscribe today to unlock all pages.

Trusted by 1+ million students worldwide

The regulation of supply is primary microeconomic thinking that states that charge and
extent furnished is without delay related. Looking at it every other way, if the unit fee
decreases, the quantity provided increases, so that the organization increases its
profits. If the unit rate increases, the quantity-supplied decreases, so that the enterprise
corporation will enlarge its profits. The employer has to estimate the proper quantity to
achieve earnings maximization at the point the place the marginal fee per unit equals
the common value per unit. (Spencer, 1971)When the price of a commodity change,
other elements stored constant, the volume supplied of a commodity modification
suitably. Graphically it reasons movement along the furnish curve. An alternate in fee
both reasons furnish curves to expand or contract. If the expenses increase, different
elements are kept constant, there is an amplify in the volume provided which is referred
to as an enlargement in supply. Graphically, this is represented as an upward
movement along the identical grant curve. Conversely, if the expenses decrease,
keeping other elements constant, companies have a tendency to minimize the supply.
(Spencer, 1971)A change in supply is a shift in the entire supply curve as opposed to a
change in the quantity supplied where there is movement along the supply curve. With a
change in supply, there is a change in the quantity businesses are willing to produce at
every price (Definition of Change in Supply | Higher Rock Education, 2018
Page 9 of 21
Paraphrase This Document
Need a fresh take? Get an instant paraphrase of this document with our AI Paraphraser

SUPPLY CURVE DIAGRAM
This table shows the market supply curve for petrol gasoline. As with demand curves,
price is based on the vertical axis and the quantity horizontal axis. Each of the points A
and E match to a figure in the table above. Thus, the price rise from £4.00 per kilogram
to £4.50 per kilogram will cause a movement along the supply curve from point C to
point D: total market supply will rise from 50 kilograms to 60 kilograms.(Sloman, 2003)
Movement along the supply curve
It is also known as change in supply curve; this concept states that supply can be
change due to the factors other than price. This change is known as movement along
the supply curve.
Page 10 of 21
E
D
C
B
A
5.00
4.50
4.00
3.50
3.00
0 30 40 50 60 70
QUANTITY KILOGRAM 000, PETROL PURCHASE

CHANGE IN SUPPLY CURVE WITH ITS FACTORS
This table showed a decrease in supply it can be represented by a shift of supply curve
to the left. Sellers are now willing to supply less then they were willing to supply before.
For example, they were previously willing to supply a total of 60 liters per week at a
price of £4.50 per liter. Now, after the decrease in supply, they are willing to sell a total
of 50 liters per week at the same price of £4.50 per liters.
Factors affecting movement along the supply curve
These are the factors which affects movement in supply curve through increasing and
decreasing the prices. Some of the factors like cost output affects the variations in price.
Page 11 of 21
E
D
C
B
A
5.00
4.50
4.00
3.50
3.00
0 30 40 50 60 70
QUANTITY KILOGRAM 000, PETROL PURCHASE
F
c
⊘ This is a preview!⊘
Do you want full access?
Subscribe today to unlock all pages.

Trusted by 1+ million students worldwide
1 out of 21
Related Documents

Your All-in-One AI-Powered Toolkit for Academic Success.
+13062052269
info@desklib.com
Available 24*7 on WhatsApp / Email
Unlock your academic potential
Copyright © 2020–2025 A2Z Services. All Rights Reserved. Developed and managed by ZUCOL.