Analysis of Demographic Distribution in Museum Visitor Survey

Verified

Added on  2022/08/14

|4
|530
|15
Report
AI Summary
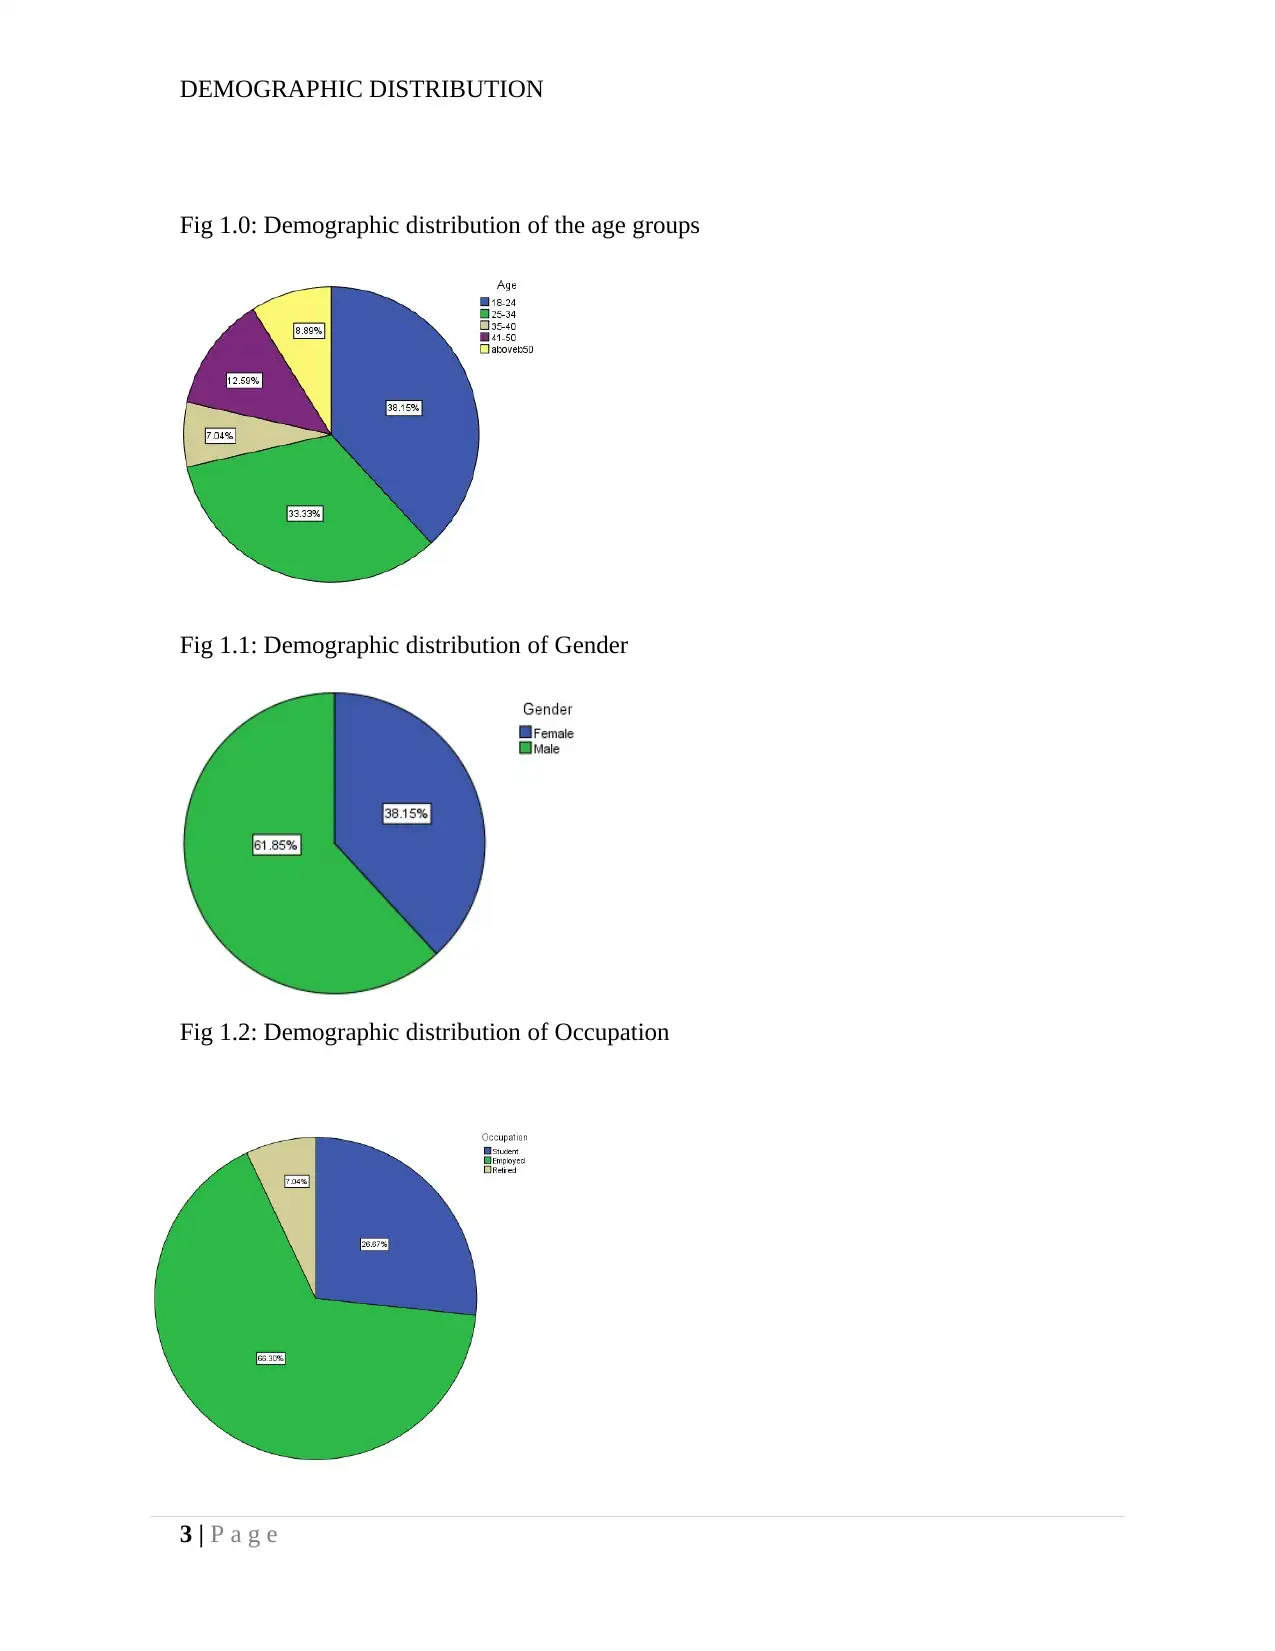
This report analyzes the demographic distribution of 270 museum visitors based on a survey. The analysis covers gender (62.9% male, 38.1% female), age groups (18-24, 25-34, 35-40, 41-50, and over 50), marital status (36.7% married, 63.3% single), and occupation (66.3% employed, 26.7% students, 7% retired). The report presents these distributions using percentages and pie charts, highlighting that the majority of visitors are male, in the 18-24 age group, single, and employed. The assignment also involves comparing pre-trip expectations with post-trip perceptions, although that part is not present in the provided solution. The report also includes the references used in the analysis.
Document Page
Running head: DEMOGRAPHICS DISTRIBUTION
Demographic Distribution
Name (First M. Last)
School or Institution Name (University at Place or Town, State)
tabler-icon-diamond-filled.svg

Paraphrase This Document

Need a fresh take? Get an instant paraphrase of this document with our AI Paraphraser
Document Page
DEMOGRAPHIC DISTRIBUTION
In statistics and social science, the demographic distribution refers to the characteristics of the
population relating to gender, marital status, age, age groups, birth and death as depicted by
Agresti (2018). A comprehensive study on the demographic characteristics helps in clearly
understanding the nature of the population under study. A clear presentation of the demographic
variables will be presented in the form of percentages scores and pie charts.
The distribution of variables in a research study and academic reports are conducted in the
initial stages before data analysis commences to help in a proper understanding of the data (Eide
et al. 2018). Normally, variable distribution is conducted using frequency tables and contingency
tables. Statistically, the distribution of variables is used as an indicator of whether the variable is
normally distributed.
Most of the statistical techniques assume normality, and if not met, data transformation is
required in the data preparation steps Murray (2017). From the descriptive statistics, out of 270
people who visited the museum, females were 38.1% while the male was 62.9%. Implying that
the majority of the visitors in that museum were men. Moreover, checking the distribution of age
of the visitors, 38.1% were age group 18-24, 33.3% 25-34 age group, 7% 35-40 age group,
12.6% 41-50 age group and 8.9% above 50 age group. Demonstrating that the age group 8-24
were the majority of the visitors while the 35-40 age group were the least visitors.
The distribution of the marital status shows that 99 of the visitors were married, representing
36.7% of the visitors and 63.3% of the respondents were single. This clearly shows that single
people were likely to visit the museum more as compared to married people. Finally, the
distribution of the visitor's occupation shows that visitors who were employed were 66.3%,
students 26.7% and retired visitors were 7%. Generally, the population under study is comprised
of more young people in the age group 25-34, more employed people and more male.
2 | P a g e
Document Page
DEMOGRAPHIC DISTRIBUTION
Fig 1.0: Demographic distribution of the age groups
Fig 1.1: Demographic distribution of Gender
Fig 1.2: Demographic distribution of Occupation
3 | P a g e
Document Page
DEMOGRAPHIC DISTRIBUTION
References
Agresti, A. (2018). An introduction to categorical data analysis. Chambers, J. M.
(2017). Graphical methods for data analysis: 0. Chapman and Hall/CRC.
Eide, A., Jenison, R. D., Mickelson, S. K., & Northup, L. L. (2018). Engineering Fundamentals
& Problem Solving. McGraw Hill Education.
Murray, S. (2017). Interactive data visualization for the web: an introduction to designing with.
" O'Reilly Media, Inc.".
4 | P a g e
chevron_up_icon
1 out of 4
circle_padding
hide_on_mobile
zoom_out_icon
[object Object]