Consumer Demographics, Household Income & Expenditure in Wollongong
VerifiedAdded on 2021/05/31
|12
|2155
|24
Report
AI Summary
This report provides a detailed demographic analysis of Wollongong City, NSW, Australia, focusing on population characteristics, household structure, income distribution, and expenditure patterns. It highlights that the estimated resident population is 213,841, with a significant portion being couples with children. The report examines dwelling types, noting a mix of medium and high-density housing, and analyzes household income distribution, revealing income inequality through the Gini coefficient. It also explores household expenditure on mortgage and rent, comparing Wollongong to regional NSW, and concludes with a summary of household net worth based on tenure, landlord type and life cycle groups. Desklib offers a platform for students to access this and other solved assignments for study purposes.
Running head: CONSUMER DEMOGRAPHICS
CONSUMER DEMOGRAPHICS
Name of the Student:
Name of the University:
Authors Note:
CONSUMER DEMOGRAPHICS
Name of the Student:
Name of the University:
Authors Note:
Paraphrase This Document
Need a fresh take? Get an instant paraphrase of this document with our AI Paraphraser
1CONSUMER DEMOGRAPHICS
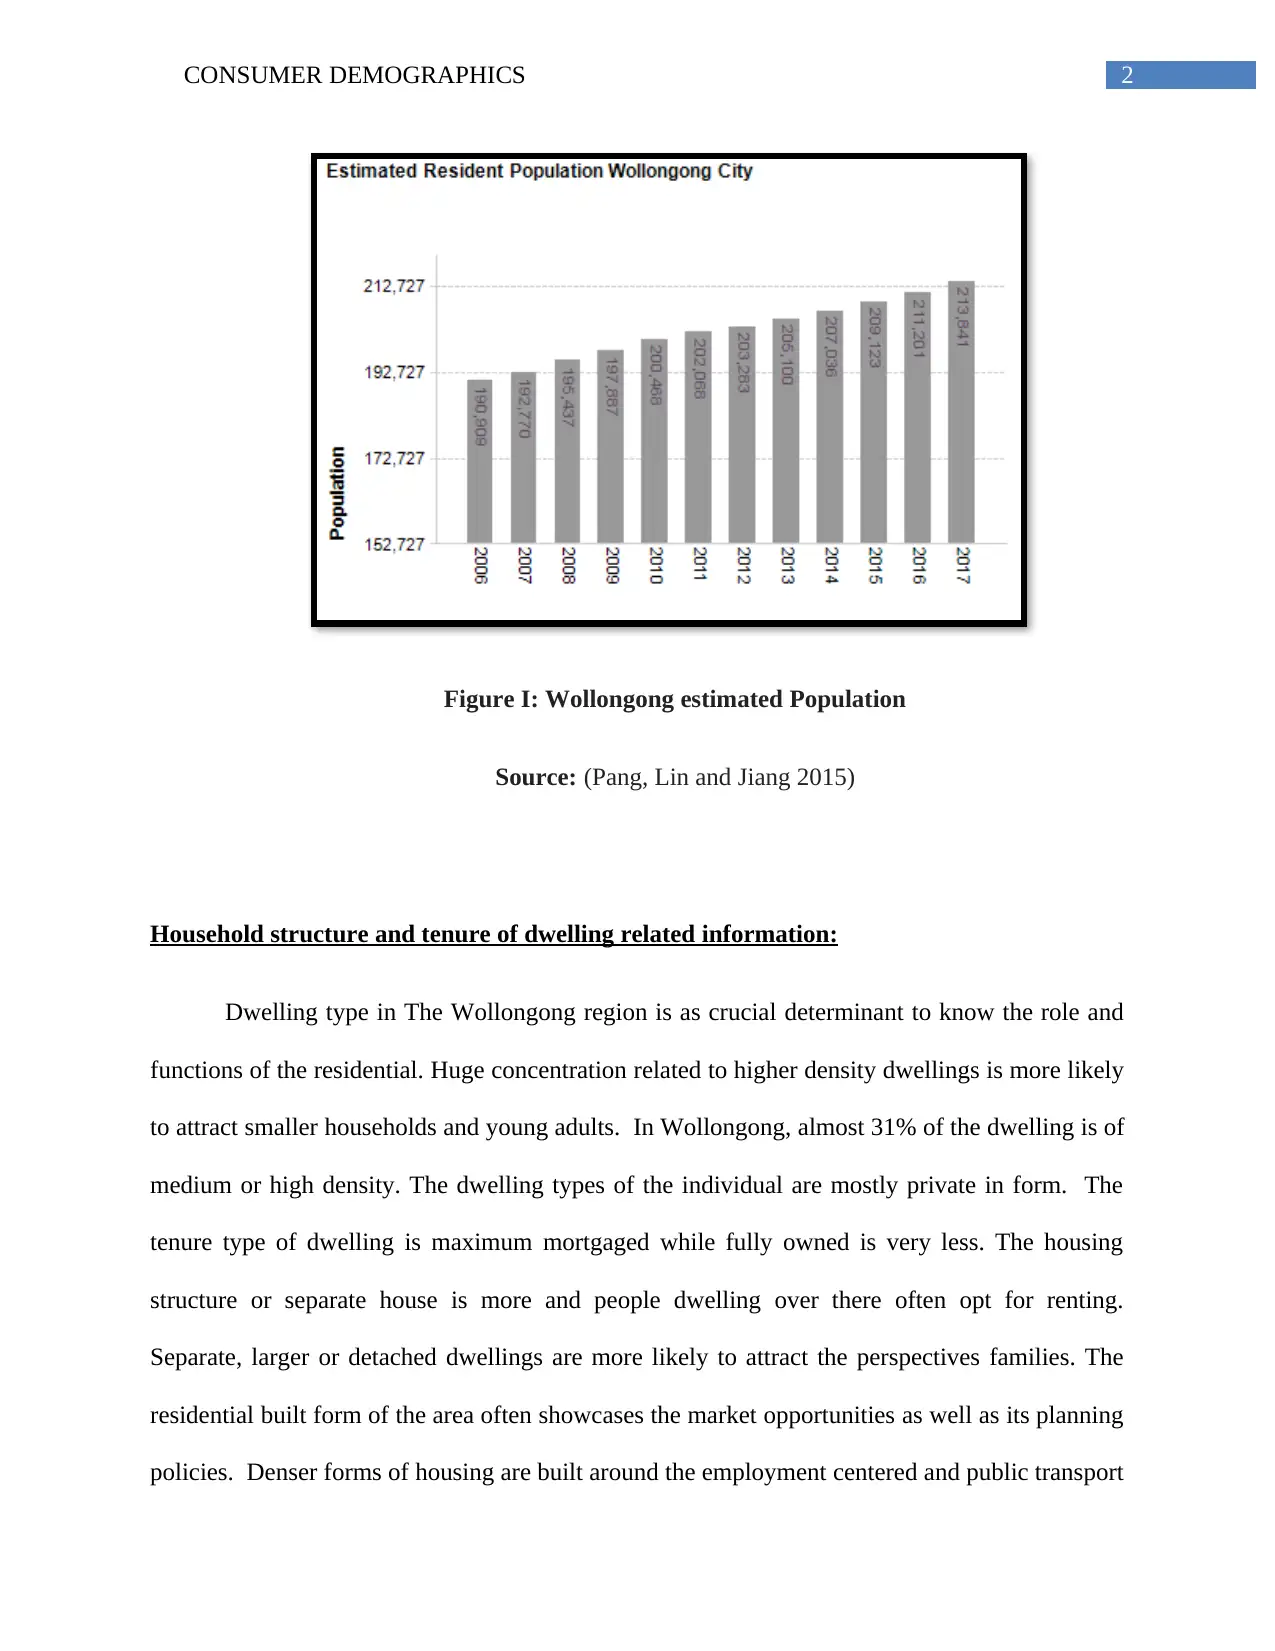
Demographic Profiles:
Wollongong City is in the Illawarra area of New South Wales. This region is almost 80
kilometer south of Sydney. The city community profiles helps in providing a demographic
analysis of Wollongong and its suburb regions. The population of the region as per the Estimated
Resident Population (ERP) is 213,841and the nearby land area is around 68,384 (Pang, Lin and
Jiang 2015). The population destiny for the area is around 3.13 people per hectare. The city
offers magnificent natural environment that ranges from untouched rainforest to dramatic sea
cliffs and sandy beaches. All age group of people are found in the country. Large percentage of
the area in the city includes outlying towns, rural localities and suburbs.
The people in the area are mostly of average age of about 35 to 40 years. Population of
Aboriginals and Torres Strait Islander includes 2.6% of total population. 30% of population in
the region is couples with children. Older couples without children include 11% of the total
population (Wilkins 2015). Almost 20% of the people in the region are qualified and holds a
degree in University. Average household income of the people on a weekly basis is around $
1,335. The mortgage weekly repayment on the average basis includes $ 449 (Finlay and Price
2015). Unemployment rate is usually low at Wollongong and participation of labor forces is
high. Couples with children are more of the dominant population of Wollongong. Male
population is higher than female population in the area. Majority of population in the area speaks
languages other than English at their homes.
2CONSUMER DEMOGRAPHICS
Figure I: Wollongong estimated Population
Source: (Pang, Lin and Jiang 2015)
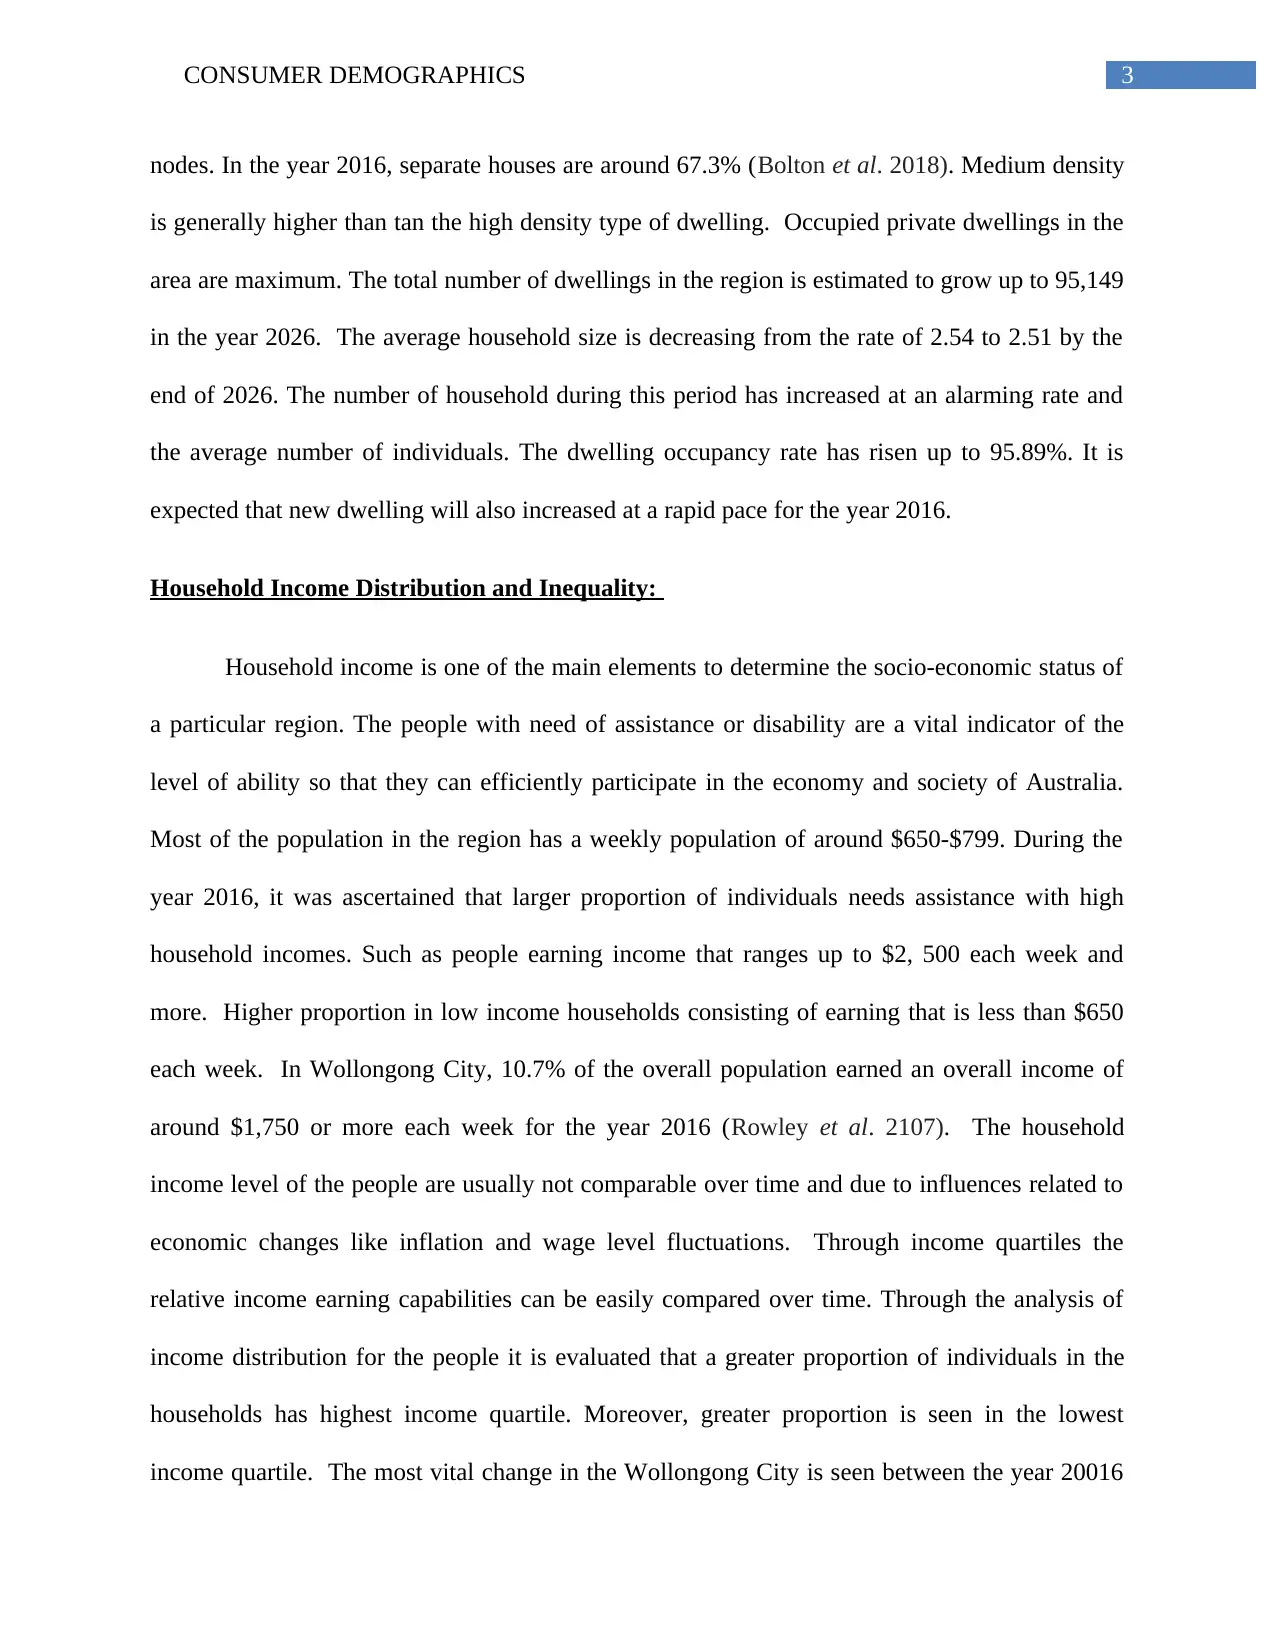
Household structure and tenure of dwelling related information:
Dwelling type in The Wollongong region is as crucial determinant to know the role and
functions of the residential. Huge concentration related to higher density dwellings is more likely
to attract smaller households and young adults. In Wollongong, almost 31% of the dwelling is of
medium or high density. The dwelling types of the individual are mostly private in form. The
tenure type of dwelling is maximum mortgaged while fully owned is very less. The housing
structure or separate house is more and people dwelling over there often opt for renting.
Separate, larger or detached dwellings are more likely to attract the perspectives families. The
residential built form of the area often showcases the market opportunities as well as its planning
policies. Denser forms of housing are built around the employment centered and public transport
Figure I: Wollongong estimated Population
Source: (Pang, Lin and Jiang 2015)
Household structure and tenure of dwelling related information:
Dwelling type in The Wollongong region is as crucial determinant to know the role and
functions of the residential. Huge concentration related to higher density dwellings is more likely
to attract smaller households and young adults. In Wollongong, almost 31% of the dwelling is of
medium or high density. The dwelling types of the individual are mostly private in form. The
tenure type of dwelling is maximum mortgaged while fully owned is very less. The housing
structure or separate house is more and people dwelling over there often opt for renting.
Separate, larger or detached dwellings are more likely to attract the perspectives families. The
residential built form of the area often showcases the market opportunities as well as its planning
policies. Denser forms of housing are built around the employment centered and public transport
⊘ This is a preview!⊘
Do you want full access?
Subscribe today to unlock all pages.
Trusted by 1+ million students worldwide
3CONSUMER DEMOGRAPHICS
nodes. In the year 2016, separate houses are around 67.3% (Bolton et al. 2018). Medium density
is generally higher than tan the high density type of dwelling. Occupied private dwellings in the
area are maximum. The total number of dwellings in the region is estimated to grow up to 95,149
in the year 2026. The average household size is decreasing from the rate of 2.54 to 2.51 by the
end of 2026. The number of household during this period has increased at an alarming rate and
the average number of individuals. The dwelling occupancy rate has risen up to 95.89%. It is
expected that new dwelling will also increased at a rapid pace for the year 2016.
Household Income Distribution and Inequality:
Household income is one of the main elements to determine the socio-economic status of
a particular region. The people with need of assistance or disability are a vital indicator of the
level of ability so that they can efficiently participate in the economy and society of Australia.
Most of the population in the region has a weekly population of around $650-$799. During the
year 2016, it was ascertained that larger proportion of individuals needs assistance with high
household incomes. Such as people earning income that ranges up to $2, 500 each week and
more. Higher proportion in low income households consisting of earning that is less than $650
each week. In Wollongong City, 10.7% of the overall population earned an overall income of
around $1,750 or more each week for the year 2016 (Rowley et al. 2107). The household
income level of the people are usually not comparable over time and due to influences related to
economic changes like inflation and wage level fluctuations. Through income quartiles the
relative income earning capabilities can be easily compared over time. Through the analysis of
income distribution for the people it is evaluated that a greater proportion of individuals in the
households has highest income quartile. Moreover, greater proportion is seen in the lowest
income quartile. The most vital change in the Wollongong City is seen between the year 20016
Paraphrase This Document
Need a fresh take? Get an instant paraphrase of this document with our AI Paraphraser
4CONSUMER DEMOGRAPHICS
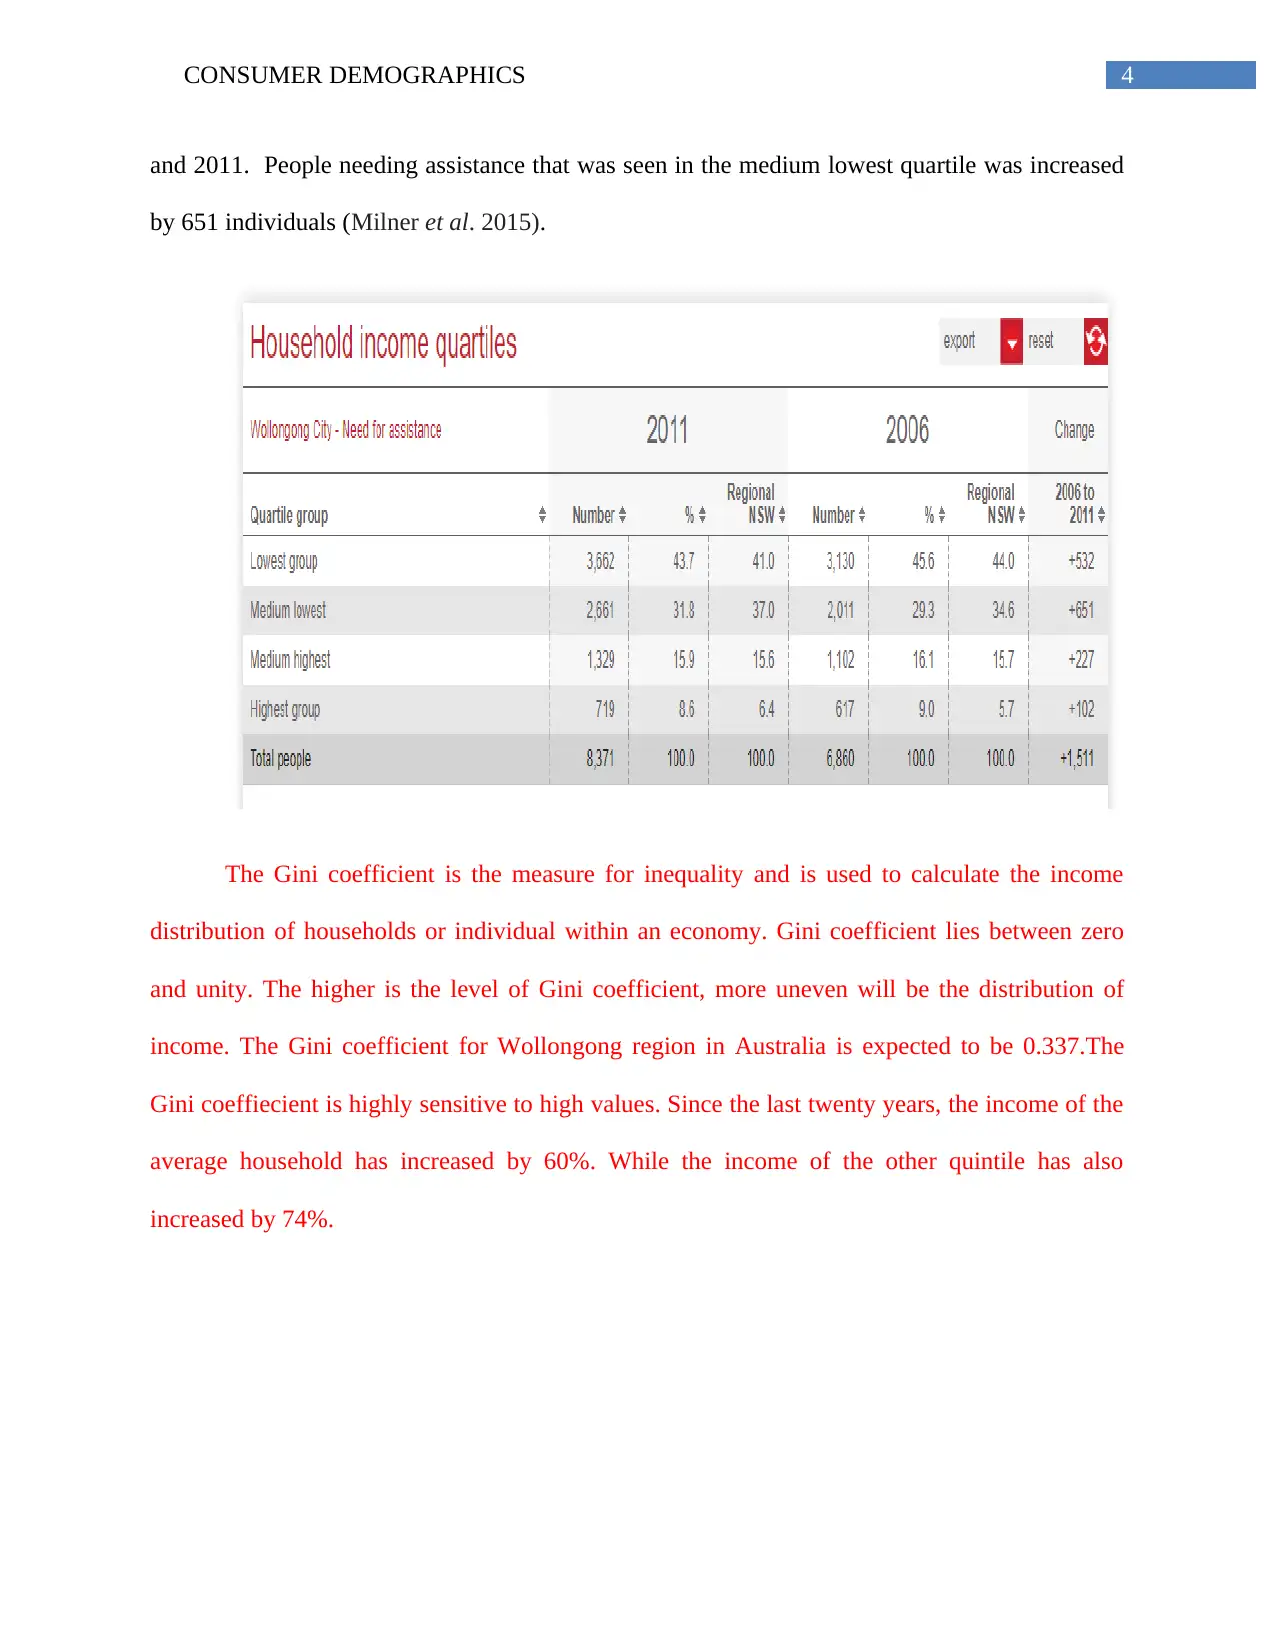
and 2011. People needing assistance that was seen in the medium lowest quartile was increased
by 651 individuals (Milner et al. 2015).
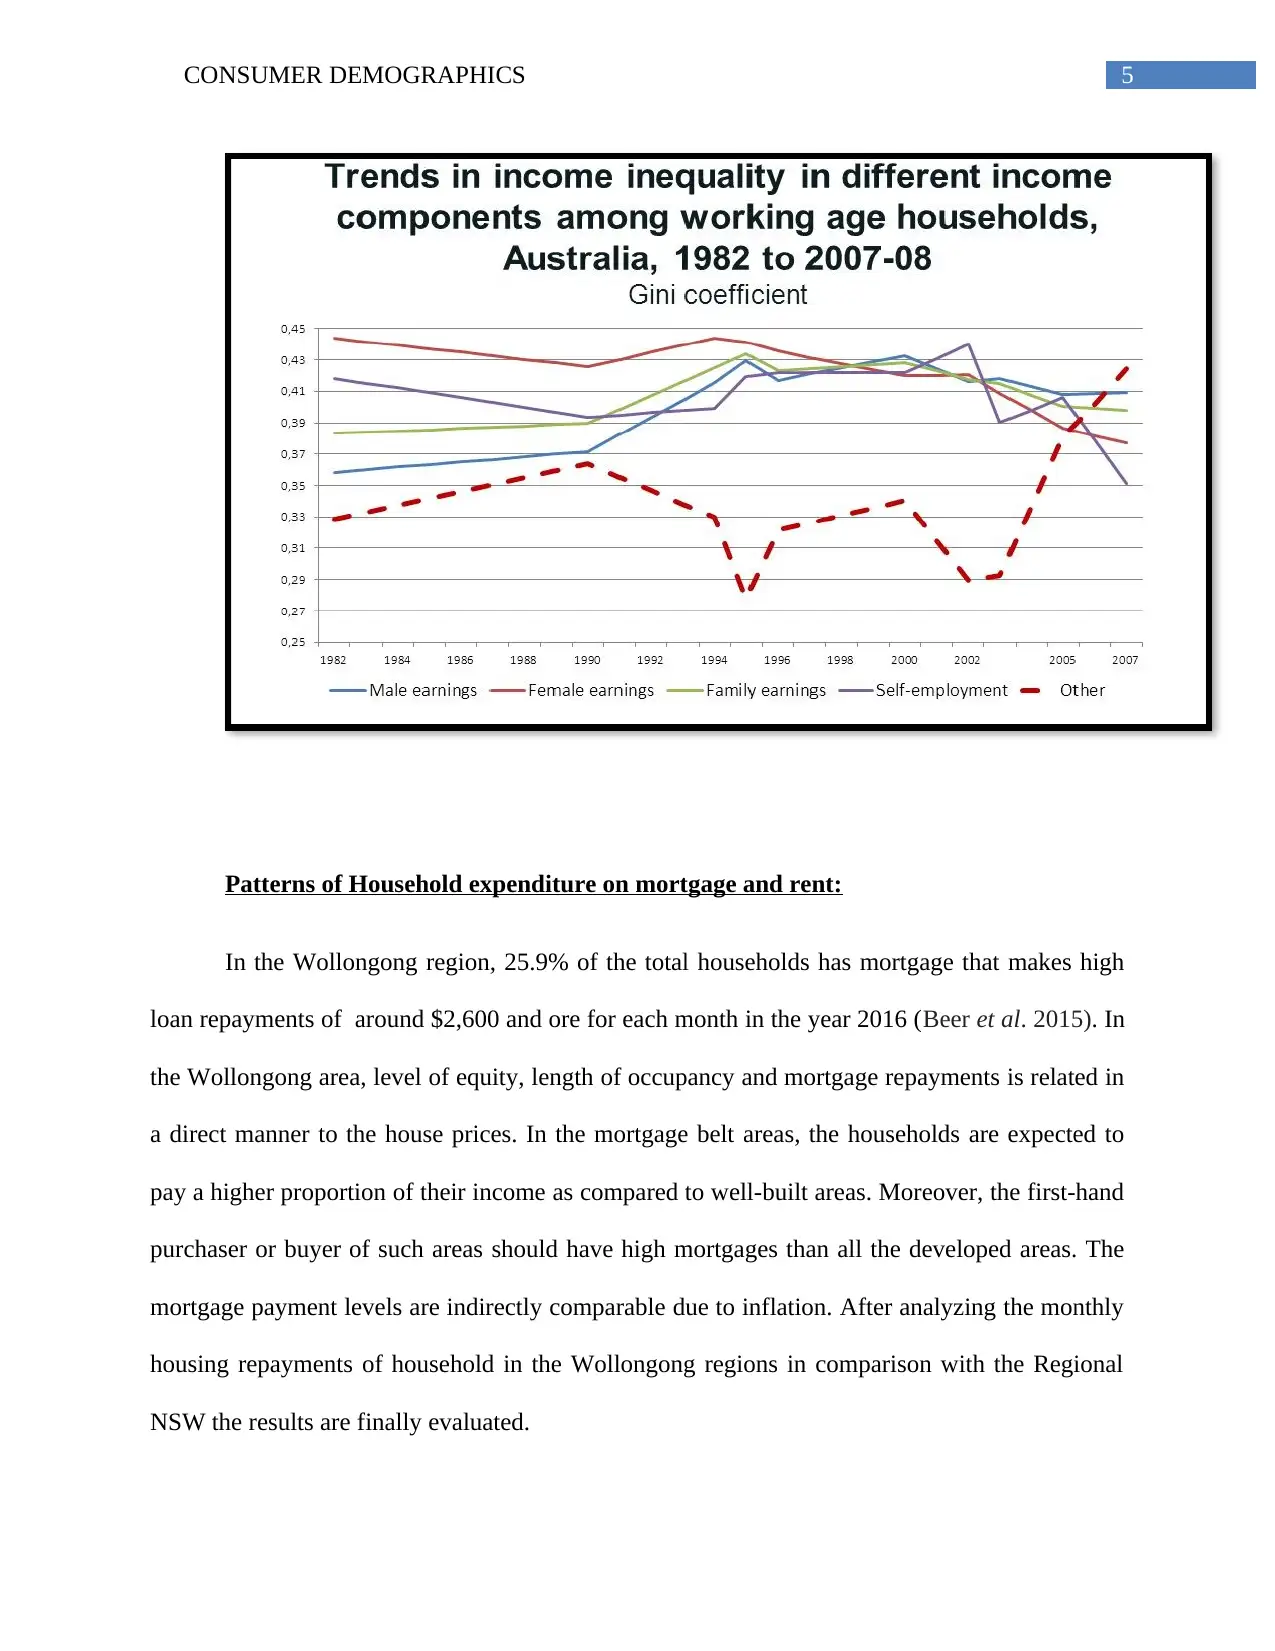
The Gini coefficient is the measure for inequality and is used to calculate the income
distribution of households or individual within an economy. Gini coefficient lies between zero
and unity. The higher is the level of Gini coefficient, more uneven will be the distribution of
income. The Gini coefficient for Wollongong region in Australia is expected to be 0.337.The
Gini coeffiecient is highly sensitive to high values. Since the last twenty years, the income of the
average household has increased by 60%. While the income of the other quintile has also
increased by 74%.
and 2011. People needing assistance that was seen in the medium lowest quartile was increased
by 651 individuals (Milner et al. 2015).
The Gini coefficient is the measure for inequality and is used to calculate the income
distribution of households or individual within an economy. Gini coefficient lies between zero
and unity. The higher is the level of Gini coefficient, more uneven will be the distribution of
income. The Gini coefficient for Wollongong region in Australia is expected to be 0.337.The
Gini coeffiecient is highly sensitive to high values. Since the last twenty years, the income of the
average household has increased by 60%. While the income of the other quintile has also
increased by 74%.
5CONSUMER DEMOGRAPHICS
Patterns of Household expenditure on mortgage and rent:
In the Wollongong region, 25.9% of the total households has mortgage that makes high
loan repayments of around $2,600 and ore for each month in the year 2016 (Beer et al. 2015). In
the Wollongong area, level of equity, length of occupancy and mortgage repayments is related in
a direct manner to the house prices. In the mortgage belt areas, the households are expected to
pay a higher proportion of their income as compared to well-built areas. Moreover, the first-hand
purchaser or buyer of such areas should have high mortgages than all the developed areas. The
mortgage payment levels are indirectly comparable due to inflation. After analyzing the monthly
housing repayments of household in the Wollongong regions in comparison with the Regional
NSW the results are finally evaluated.
⊘ This is a preview!⊘
Do you want full access?
Subscribe today to unlock all pages.
Trusted by 1+ million students worldwide
6CONSUMER DEMOGRAPHICS
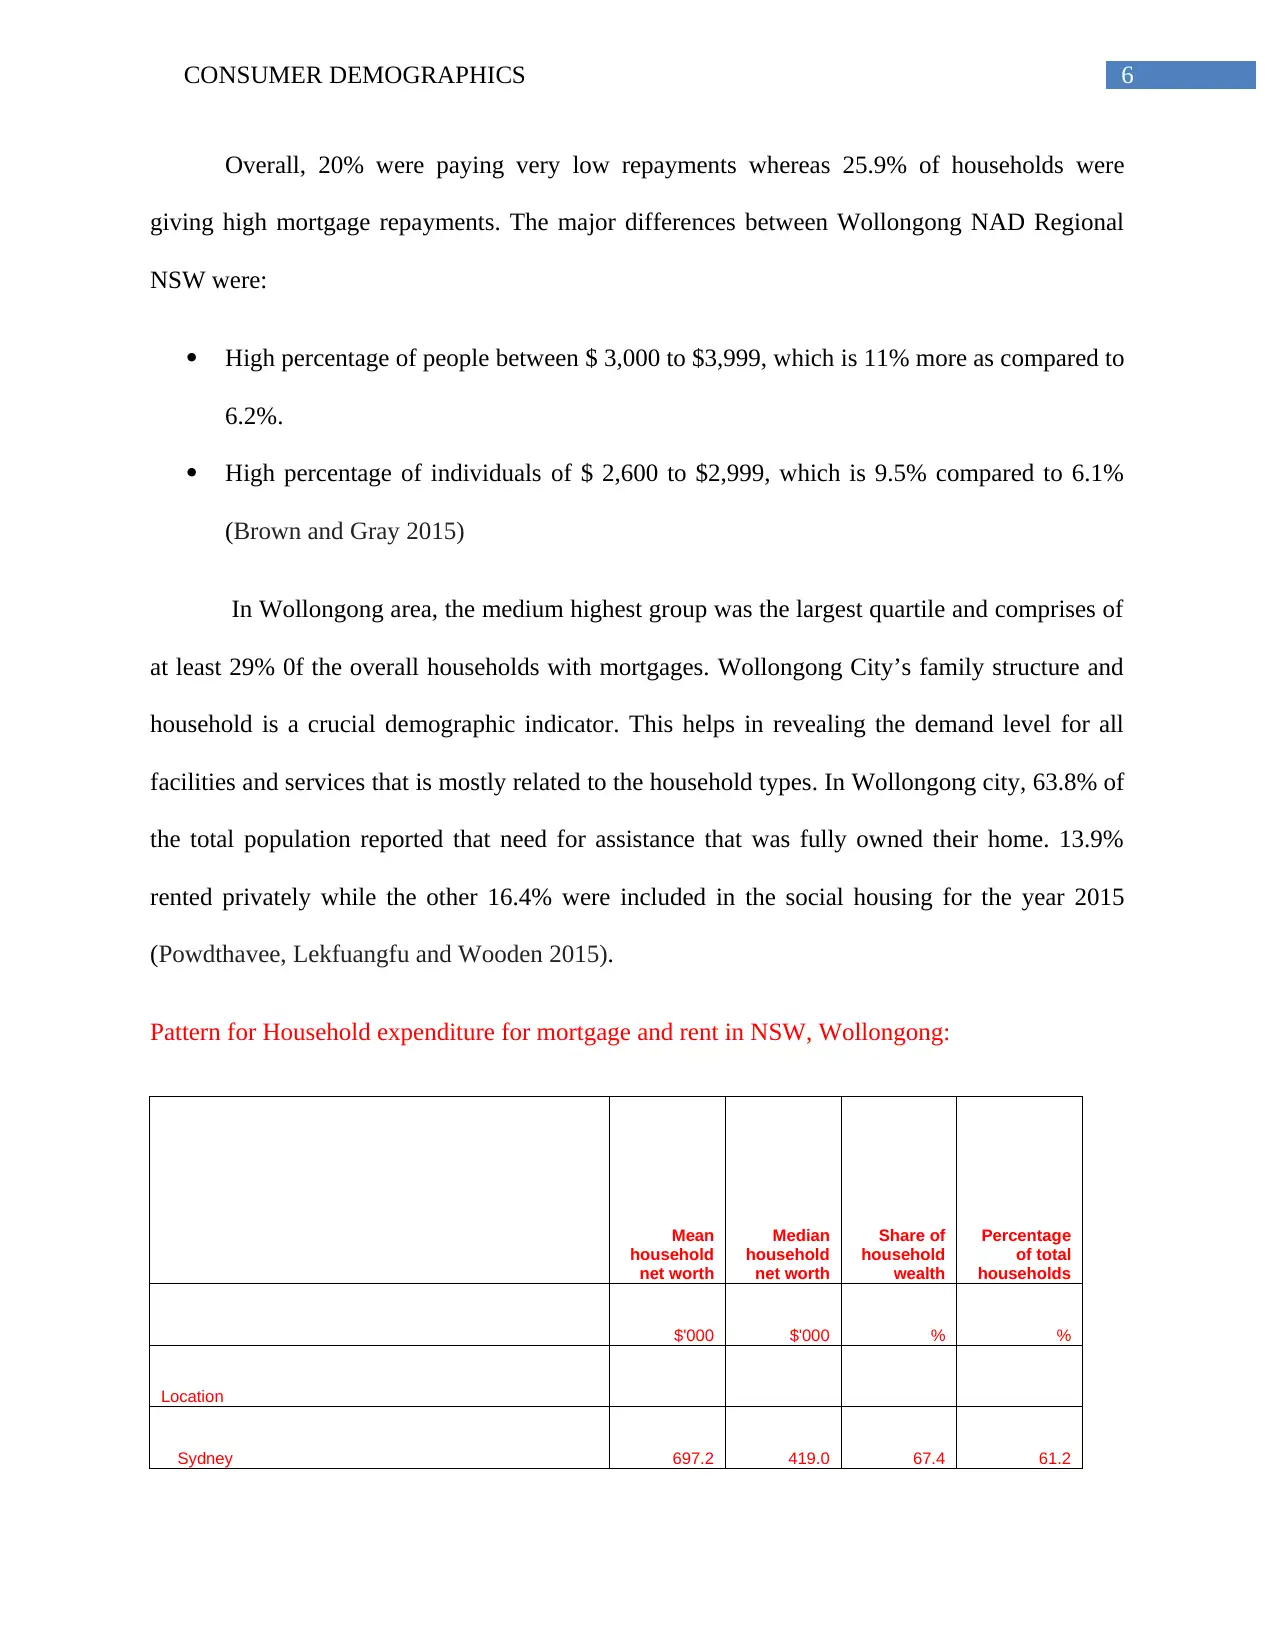
Overall, 20% were paying very low repayments whereas 25.9% of households were
giving high mortgage repayments. The major differences between Wollongong NAD Regional
NSW were:
High percentage of people between $ 3,000 to $3,999, which is 11% more as compared to
6.2%.
High percentage of individuals of $ 2,600 to $2,999, which is 9.5% compared to 6.1%
(Brown and Gray 2015)
In Wollongong area, the medium highest group was the largest quartile and comprises of
at least 29% 0f the overall households with mortgages. Wollongong City’s family structure and
household is a crucial demographic indicator. This helps in revealing the demand level for all
facilities and services that is mostly related to the household types. In Wollongong city, 63.8% of
the total population reported that need for assistance that was fully owned their home. 13.9%
rented privately while the other 16.4% were included in the social housing for the year 2015
(Powdthavee, Lekfuangfu and Wooden 2015).
Pattern for Household expenditure for mortgage and rent in NSW, Wollongong:
Mean
household
net worth
Median
household
net worth
Share of
household
wealth
Percentage
of total
households
$'000 $'000 % %
Location
Sydney 697.2 419.0 67.4 61.2
Paraphrase This Document
Need a fresh take? Get an instant paraphrase of this document with our AI Paraphraser
7CONSUMER DEMOGRAPHICS
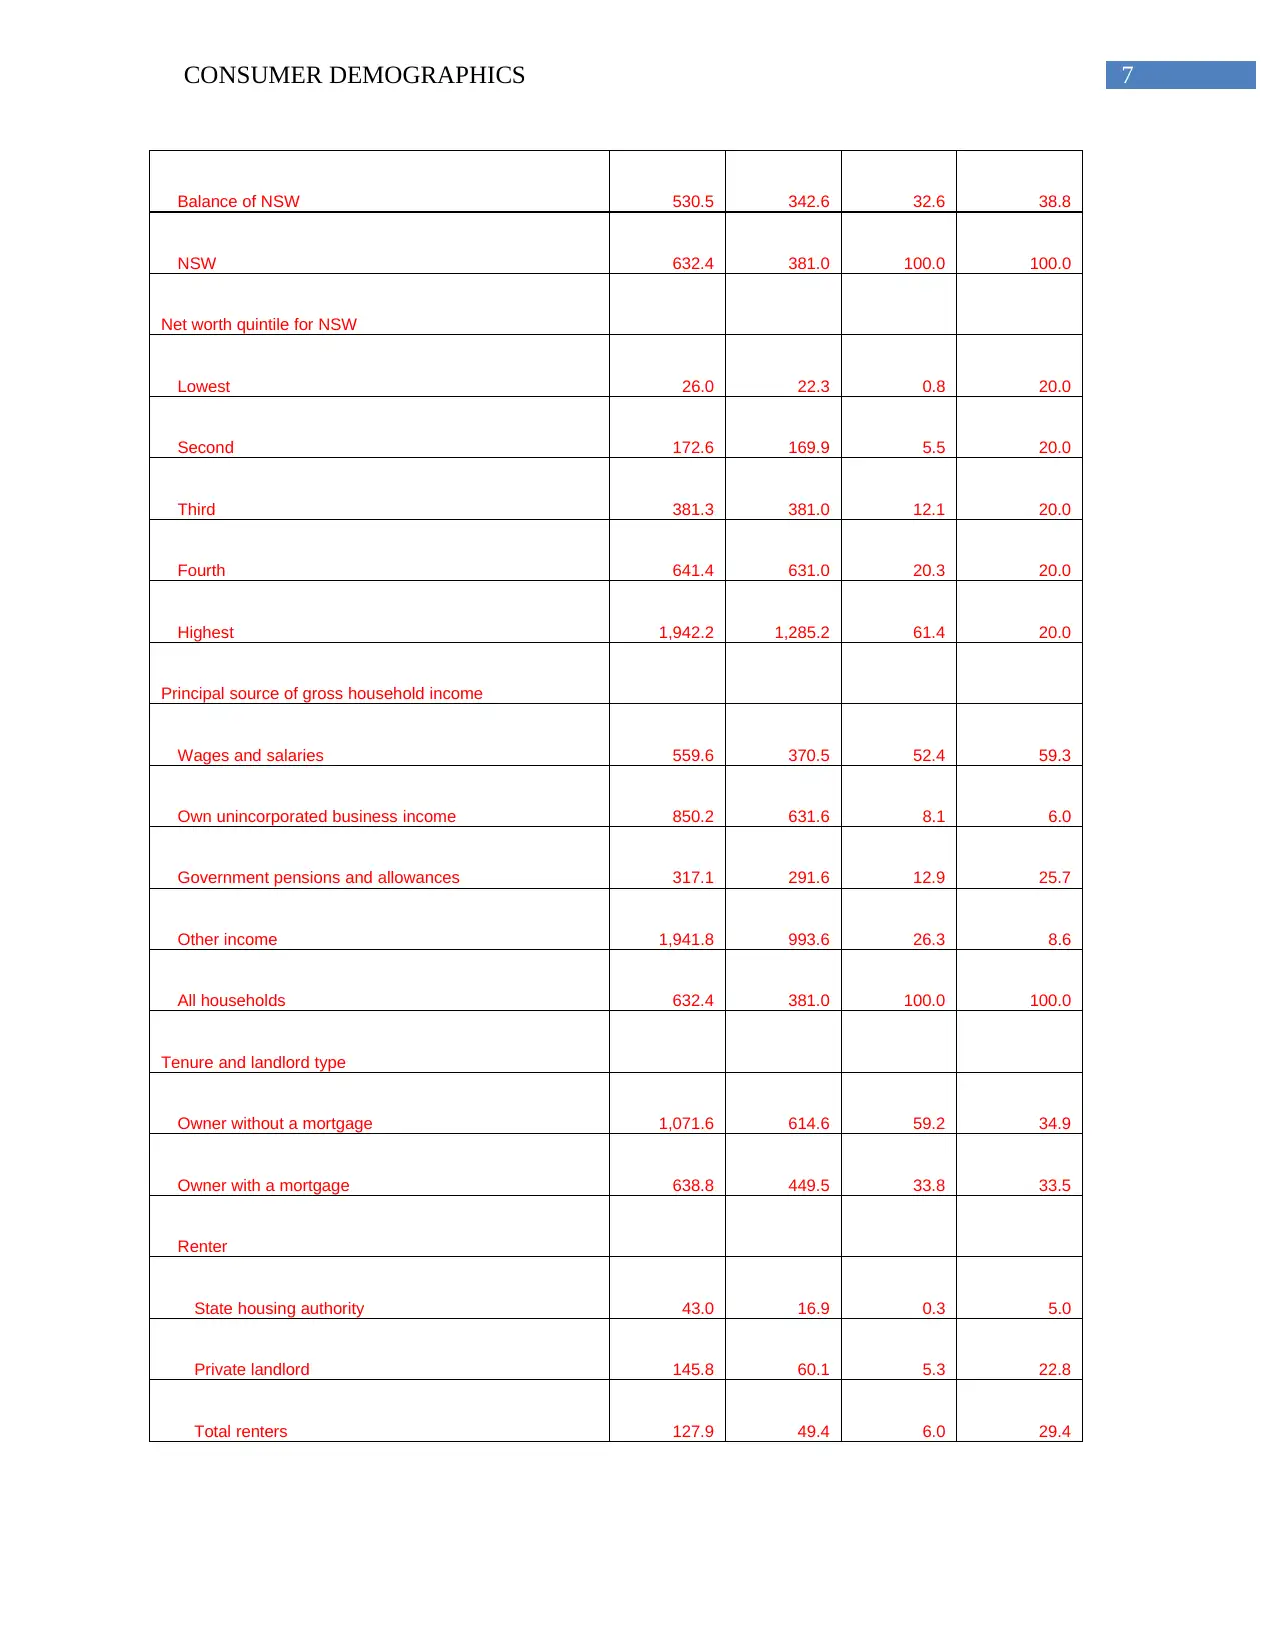
Balance of NSW 530.5 342.6 32.6 38.8
NSW 632.4 381.0 100.0 100.0
Net worth quintile for NSW
Lowest 26.0 22.3 0.8 20.0
Second 172.6 169.9 5.5 20.0
Third 381.3 381.0 12.1 20.0
Fourth 641.4 631.0 20.3 20.0
Highest 1,942.2 1,285.2 61.4 20.0
Principal source of gross household income
Wages and salaries 559.6 370.5 52.4 59.3
Own unincorporated business income 850.2 631.6 8.1 6.0
Government pensions and allowances 317.1 291.6 12.9 25.7
Other income 1,941.8 993.6 26.3 8.6
All households 632.4 381.0 100.0 100.0
Tenure and landlord type
Owner without a mortgage 1,071.6 614.6 59.2 34.9
Owner with a mortgage 638.8 449.5 33.8 33.5
Renter
State housing authority 43.0 16.9 0.3 5.0
Private landlord 145.8 60.1 5.3 22.8
Total renters 127.9 49.4 6.0 29.4
8CONSUMER DEMOGRAPHICS
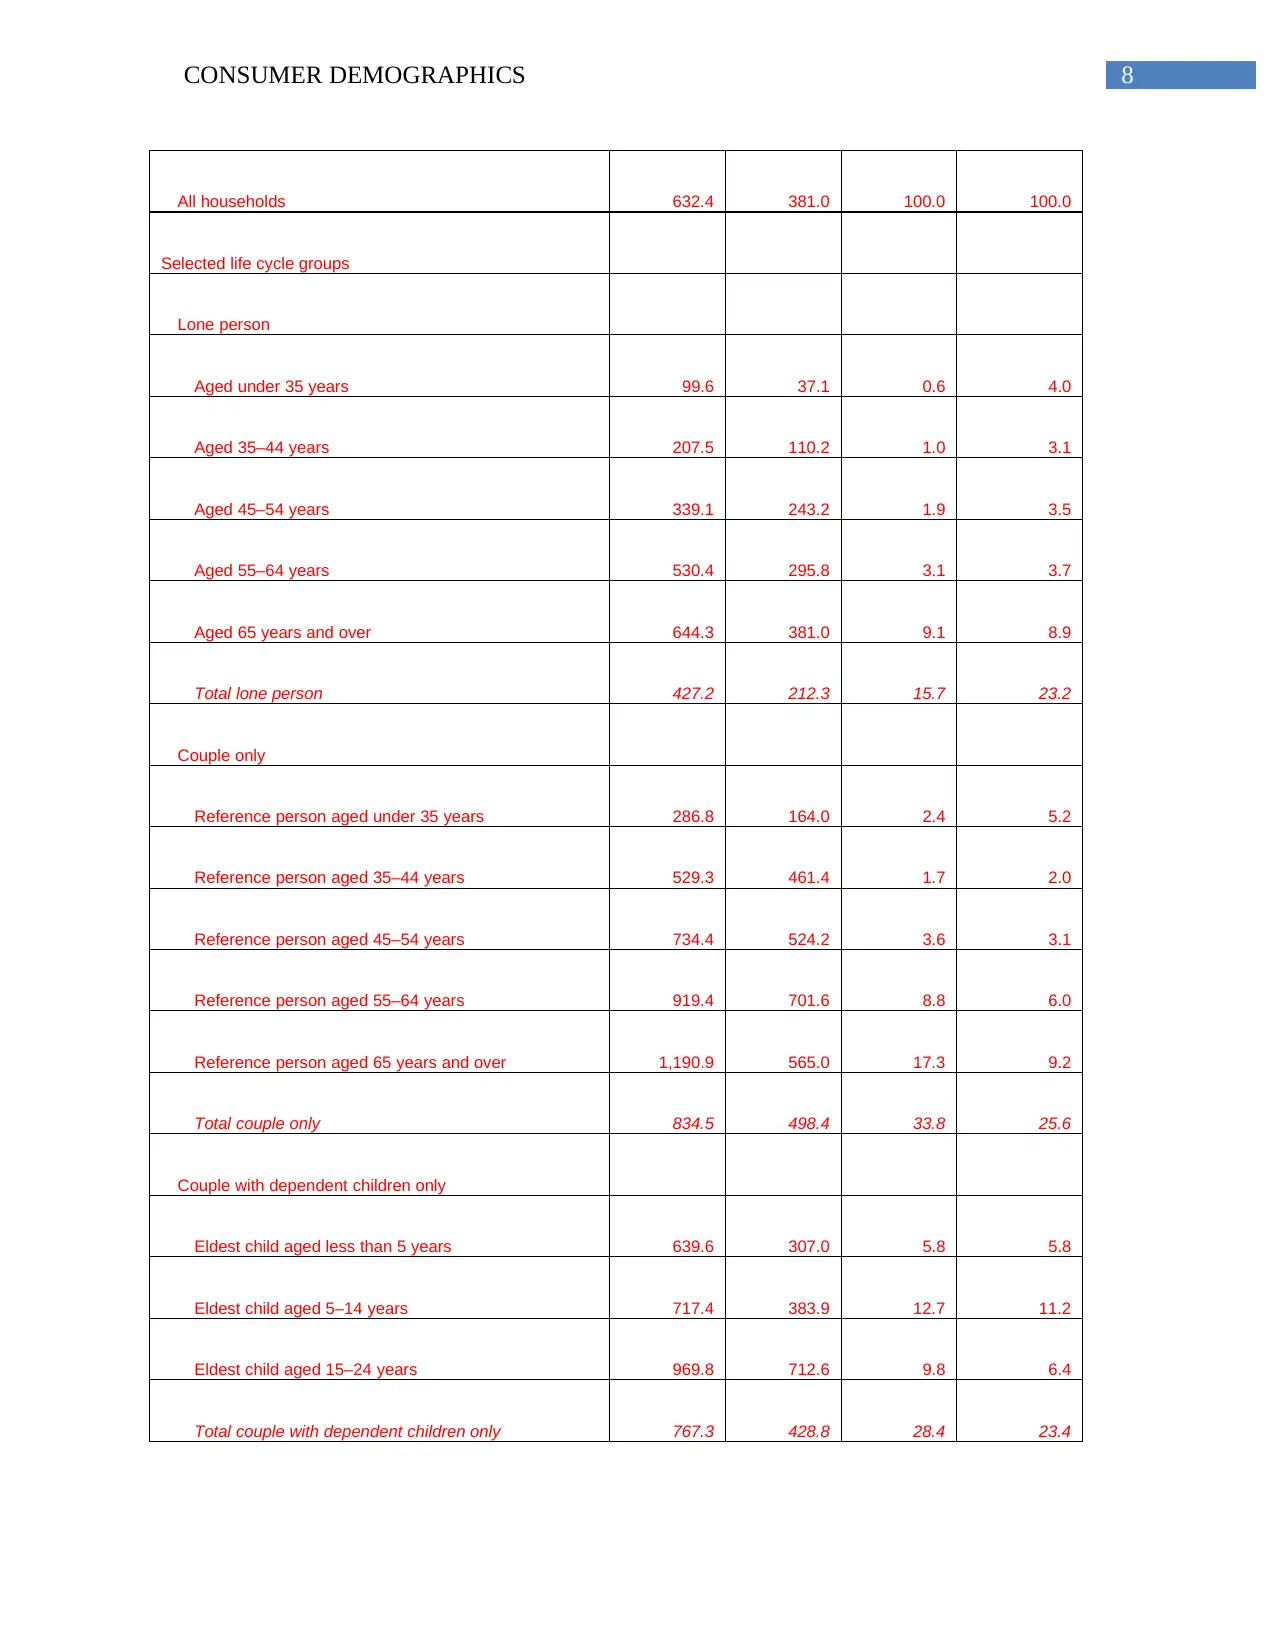
All households 632.4 381.0 100.0 100.0
Selected life cycle groups
Lone person
Aged under 35 years 99.6 37.1 0.6 4.0
Aged 35–44 years 207.5 110.2 1.0 3.1
Aged 45–54 years 339.1 243.2 1.9 3.5
Aged 55–64 years 530.4 295.8 3.1 3.7
Aged 65 years and over 644.3 381.0 9.1 8.9
Total lone person 427.2 212.3 15.7 23.2
Couple only
Reference person aged under 35 years 286.8 164.0 2.4 5.2
Reference person aged 35–44 years 529.3 461.4 1.7 2.0
Reference person aged 45–54 years 734.4 524.2 3.6 3.1
Reference person aged 55–64 years 919.4 701.6 8.8 6.0
Reference person aged 65 years and over 1,190.9 565.0 17.3 9.2
Total couple only 834.5 498.4 33.8 25.6
Couple with dependent children only
Eldest child aged less than 5 years 639.6 307.0 5.8 5.8
Eldest child aged 5–14 years 717.4 383.9 12.7 11.2
Eldest child aged 15–24 years 969.8 712.6 9.8 6.4
Total couple with dependent children only 767.3 428.8 28.4 23.4
⊘ This is a preview!⊘
Do you want full access?
Subscribe today to unlock all pages.
Trusted by 1+ million students worldwide
9CONSUMER DEMOGRAPHICS
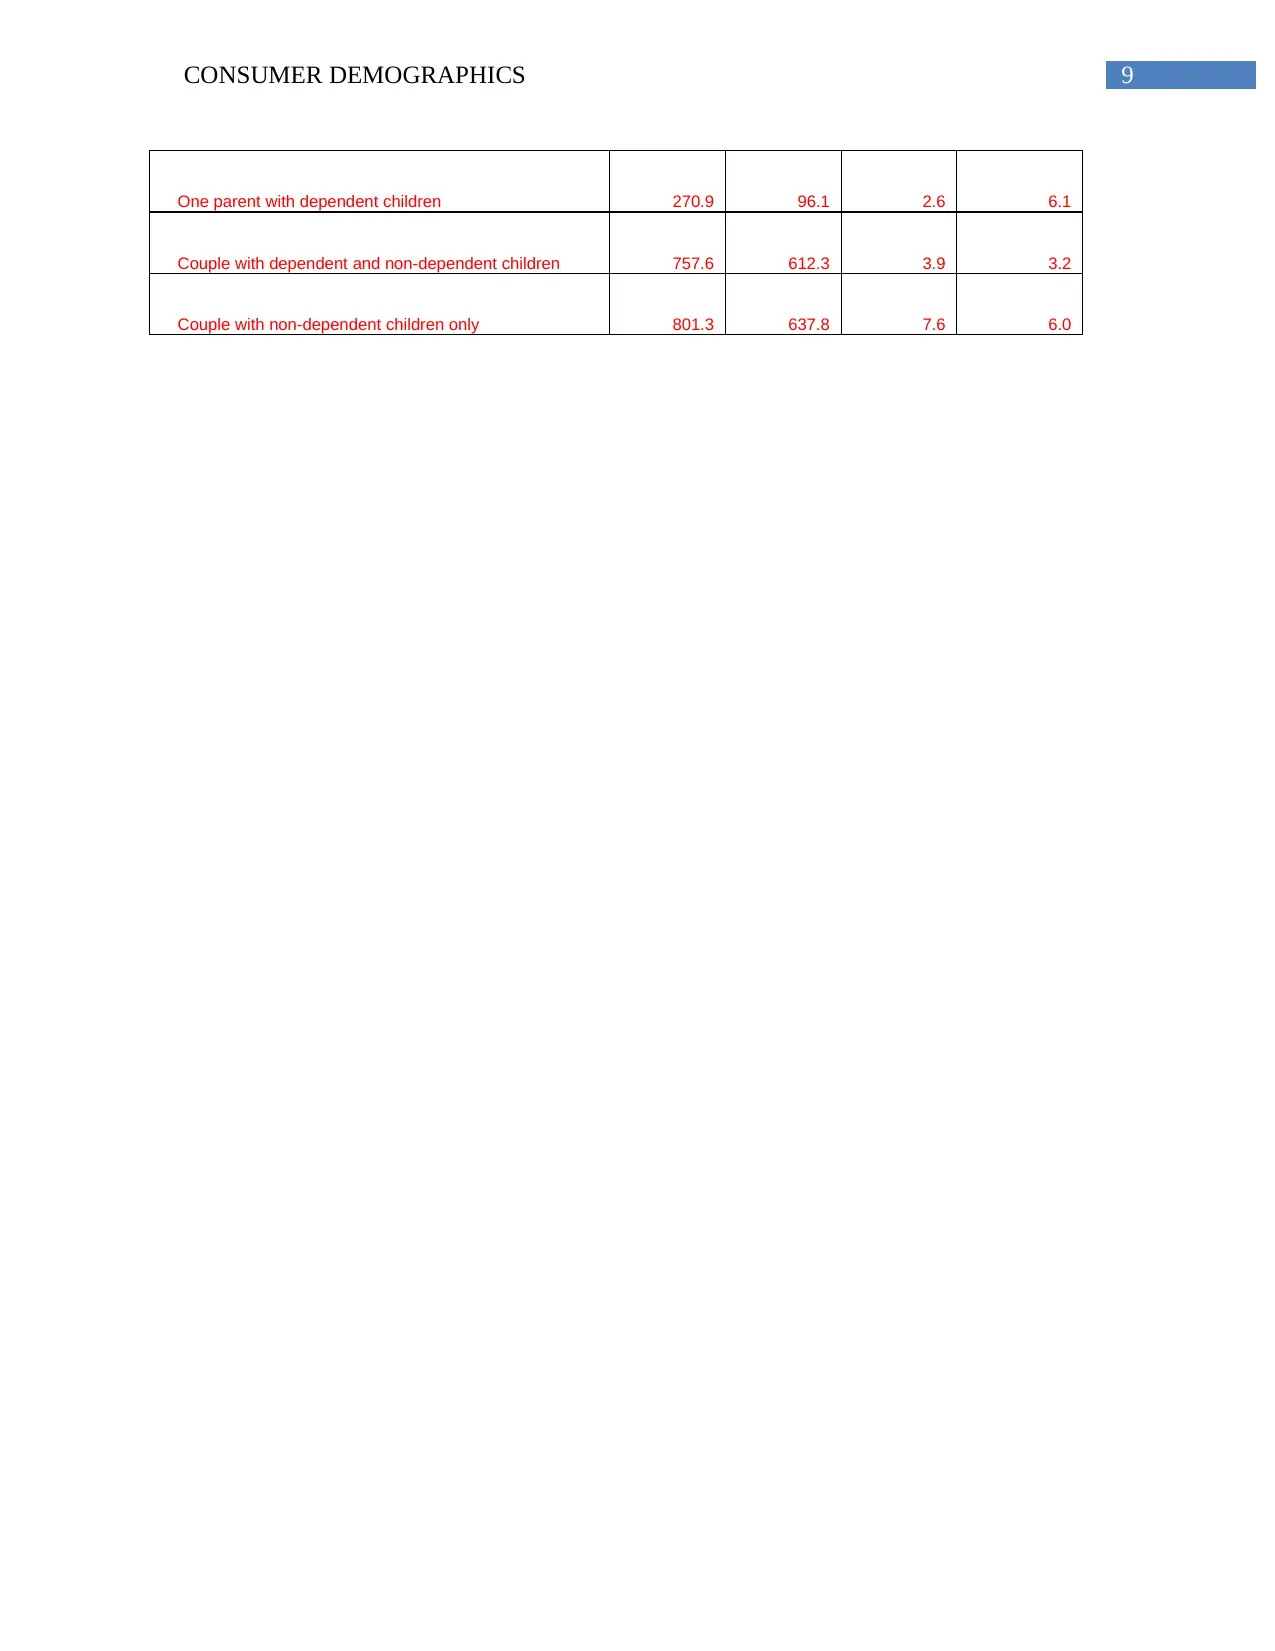
One parent with dependent children 270.9 96.1 2.6 6.1
Couple with dependent and non-dependent children 757.6 612.3 3.9 3.2
Couple with non-dependent children only 801.3 637.8 7.6 6.0
One parent with dependent children 270.9 96.1 2.6 6.1
Couple with dependent and non-dependent children 757.6 612.3 3.9 3.2
Couple with non-dependent children only 801.3 637.8 7.6 6.0
Paraphrase This Document
Need a fresh take? Get an instant paraphrase of this document with our AI Paraphraser
10CONSUMER DEMOGRAPHICS
References:
Beer, A., Bentley, R., Baker, E., Mason, K., Mallett, S., Kavanagh, A. and LaMontagne, T.,
2016. Neoliberalism, economic restructuring and policy change: Precarious housing and
precarious employment in Australia. Urban studies, 53(8), pp.1542-1558.
Bolton, P.E., Rollins, L.A., Brazill-Boast, J., Maute, K.L., Legge, S., Austin, J.J. and Griffith,
S.C., 2018. Genetic diversity through time and space: diversity and demographic history from
natural history specimens and serially sampled contemporary populations of the threatened
Gouldian finch (Erythrura gouldiae). Conservation Genetics, pp.1-18.
Brown, S. and Gray, D., 2016. Household finances and well-being in Australia: An empirical
analysis of comparison effects. Journal of Economic Psychology, 53, pp.17-36.
Da Luz, F.Q., Sainsbury, A., Mannan, H., Touyz, S., Mitchison, D. and Hay, P., 2017.
Prevalence of obesity and comorbid eating disorder behaviors in South Australia from 1995 to
2015. International Journal of Obesity, 41(7), p.1148.
Finlay, R. and Price, F., 2015. Household saving in Australia. The BE Journal of
Macroeconomics, 15(2), pp.677-704.
Milner, A., Niedhammer, I., Chastang, J.F., Spittal, M.J. and LaMontagne, A.D., 2016. Validity
of a job-exposure matrix for psychosocial job stressors: results from the Household Income and
Labour Dynamics in Australia Survey. PloS one, 11(4), p.e0152980.
Pang, Z., Lin, B. and Jiang, J., 2015. The papers listed below have been accepted for publication
in future issues of Australian & New Zealand Journal of Statistics. Aust. NZJ Stat, 57(1), p.167.
11CONSUMER DEMOGRAPHICS
Powdthavee, N., Lekfuangfu, W.N. and Wooden, M., 2015. What's the good of education on our
overall quality of life? A simultaneous equation model of education and life satisfaction for
Australia. Journal of behavioral and experimental economics, 54, pp.10-21.
Rowley, S., Leishman, C., Baker, E., Bentley, R. and Lester, L., 2017. Modelling housing need
in Australia to 2025 (No. 287). AHURI Final Report.
Wilkins, R., 2015. Measuring income inequality in Australia. Australian Economic
Review, 48(1), pp.93-102.
⊘ This is a preview!⊘
Do you want full access?
Subscribe today to unlock all pages.
Trusted by 1+ million students worldwide
1 out of 12


Your All-in-One AI-Powered Toolkit for Academic Success.
+13062052269
info@desklib.com
Available 24*7 on WhatsApp / Email
![[object Object]](/_next/static/media/star-bottom.7253800d.svg)
Unlock your academic potential
Copyright © 2020–2026 A2Z Services. All Rights Reserved. Developed and managed by ZUCOL.