Study on the Impact of Depression on Cigarette Smoking Frequency
VerifiedAdded on 2023/05/29
|24
|6346
|437
Report
AI Summary
This report investigates the impact of age, gender, and depression on cigarette smoking frequency using a large sample of the general public. The study analyzes the number of cigarettes smoked per day (cgtsday) in relation to age (agea), gender (gndr), and feelings of depression (fltdpr). Hypothesis testing reveals significant differences in smoking habits between genders, a weak positive correlation between age and smoking, and a notable impact of depression on smoking levels. A multiple regression model confirms the linear relationship between the control variables and smoking frequency. The findings highlight the importance of considering demographic and psychological factors in understanding and addressing smoking habits, particularly among women and individuals experiencing depression. Desklib provides access to a wealth of study resources, including past papers and solved assignments, to support students in their academic endeavors.
RUNNING HEAD: Impact of Depression on Cigarette Smoking Frequency – An Age and Gender-Based Study
Impact of Depression on Cigarette Smoking
Frequency – An Age and Gender-Based Study
1
Impact of Depression on Cigarette Smoking
Frequency – An Age and Gender-Based Study
1
Paraphrase This Document
Need a fresh take? Get an instant paraphrase of this document with our AI Paraphraser
Abstract
The present investigation was performed by breaking down an extensive example of the
overall public, including a significant number of subjects who continued smoking. The result
variable was chosen as "cgtsday", which inferred the number of cigarettes smoked every day by
a person. The initial two demographical control factors were "agea", showing the age of the
examples and "gndr", meaning the sex of the example subjects. The third factor was the
sentiment of melancholy in a week ago and was meant by "fltdpr" in the overview. The reliance
on the result variable on the three control factors was tried in the theory testing process. The null
hypothesis was rejected against the substitute that there was a significant difference in cigarette
smoking speculation at 5% level, implying that guys smoked essentially more than the females.
There was a factually noteworthy connection demonstrating that cigarette smoking rate expanded
with increment in age. In any case, the affiliation was extremely frail and it is shown that for one
year of age increase cigarette smoking increments by 0.065. The cross-organization with the
sentiment of discouragement in later past or a week ago discovered that low smoking gathering
was measurably unique from different gatherings. From the t-test insights of the regression
model, the control factors were observed to be measurably noteworthy at 5% dimension of
noteworthiness. The control factors were found to significantly impact the cigarette smoking rate
in a linear manner.
2
Table of Contents
Abstract...................................................................................................................................................................... 2
Introduction.............................................................................................................................................................. 4
Rationale and Hypotheses................................................................................................................................... 5
Methodology............................................................................................................................................................. 6
Categorical Variable Generation for “cgtsday”....................................................................................... 7
One Variable Summary......................................................................................................................................... 7
Control variables................................................................................................................................................ 7
Outcome Variable............................................................................................................................................... 9
Inferential Analysis / Interpretation of Findings.................................................................................... 10
Hypothesis H01 Test: (T-test).................................................................................................................. 10
Hypothesis H02 Test: (Pearson’s Correlation).................................................................................. 11
Hypothesis H03 Test: (ANOVA)............................................................................................................... 12
Confirmatory test for Hypothesis H03: (Chi-Square Test for Categorical “cgtsday_cat”)13
Multiple Regression Model.............................................................................................................................. 14
Conclusion............................................................................................................................................................... 16
References............................................................................................................................................................... 18
Appendix (DO FILE OF STATA CODES)....................................................................................................... 20
3
⊘ This is a preview!⊘
Do you want full access?
Subscribe today to unlock all pages.
Trusted by 1+ million students worldwide
Introduction
Cigarette smoking became commonplace from the very beginning of the 20th century.
Many men started smoking from the time of the First World War and many women got addicted
to the nicotine addiction from the era of Second World War. The general observation of time
trends has shown that more men than women smoke in their younger age, and although the
percentages have dropped globally, the decline is more pronounced in men than in women
(Fenech, & Bonassi, 2011, Ng et al., 2014). Cigarette smoking is the most important and decisive
factor that accelerates the age-related decline in lung diseases. The aim of this study was to
analyze the effects of age, gender and depression in the past on smoking habits (Leventhal &
Zvolensky, 2015). The main goal was to see whether smokers show a decrease in smoking
frequency as a result of increasing age and recently depressive mood (Boden, Fergusson &
Horwood, 2010). The study was conducted by analyzing a large sample of the general
population, including a significant number of subjects who were having increased smoking
habits. The prevalence of smoking and the burden of smoking-related diseases are of late shifting
to women. With a large number of young women who continue to smoke, there is a clear need to
learn more about ways to stop smoking and find ways to quit the menacing habit (Corona et al.,
2010). This article also examines smoking and gender behavior, with special attention to the
experience of aging.
One outcome and three control variables were identified from the survey data set
provided for this quantitative report. The outcome variable was selected as “cgtsday”, which
implied the number of cigarettes smoked per day by an individual. The first two
demographical control variables were “agea", indicating the age of the samples
(continuous) and “gndr”, denoting the gender (categorical and nominal) of the sample
subjects. The third control variable was the feeling of depression in last week and was
denoted by “fltdpr” in the survey (categorical and ordinal). The dependence of the outcome
variable on the three control variables was tested in the hypothesis testing process. A final
multiple regression model was constructed to assess the impact of the control variable on the
frequency of cigarette smoking.
4
Paraphrase This Document
Need a fresh take? Get an instant paraphrase of this document with our AI Paraphraser
Rationale and Hypotheses
In the tenure of entire life the amount of cigarettes smoked by people ultimately determines the
quality of air breathed. In women, the frequency of smoking determines the health condition,
especially given the biological intricacies of females. Some of the reviews have also shown the
status of smoker from the mid nineteenth century has decreased in the percentage, together with
an unstoppable increase in the number of ex-smokers (O'Loughlin, Karp, Koulis , Paradis,
DiFranza, 2009). Smoking in young women is particularly worrisome because it not only entails
a risk to their own long-term health, but also has a direct impact on the reproductive function and
health of their children (Strine et al., 2008). The prevalence of smoking in the most recent
meetings or in adult women exceeds that of men. This particular trend is now predominant in
European and Asian countries. While many longitudinal studies have studied the number of
people who have quit smoking to demonstrate that there is an effect in the loss of lung function
in heavy smokers compared to that of the light smokers. On the other hand, some studies had
already shown in the late nineteenth century that patients with adverse mental health had a high
proportion of addiction to cigarette smoking. Today, researchers are considering using both
cross-section and order information and taking advantage of recent depression problems (Thun,
DeLancey, Center, Jemal & Ward, 2009). The presentation of lung cancer and smoking was
followed by the constant expansion of data on the risks of smoking.
To study and analyze the impact of the control variables on smoking habit and frequency
of smoking, three hypotheses have been framed by the researcher. These hypotheses were
framed to answer the primary research question of this article: “Whether Age, Gender,
and recent Depression have any impact on frequency of cigarette smoking in daily life”.
Considering the type of the variables, the null hypotheses were structured against appropriate
alternate hypotheses. The three set of hypotheses were all tested at 5% level of significance for
their statistical implication.
5
H01: Male and females were equally inclined to smoking.
Against
HA1: There was a significant difference in smoking habits of men and women.
H02: Age had no correlation with the smoking frequency of sample subjects.
Against
HA2: There was a significant association of age of the subjects with their smoking frequency.
H03: Recent depression has no impact on the number of cigarettes smoked.
Against
HA3: Recent depression has a significant impact on the frequency of smoking.
Methodology
Four variables for the research purpose were extracted from the master data file to
evaluate the impact of age, gender and depression felt on cigarette addiction and smoking
frequency. STATA 15.0 version was utilized as the data analysis software platform for the
present research. The missing responses or responses where subjects did not want to answer were
taken care of in the STATA environment. The dependent "cgtsday" implied the number of
cigarette smoking by the subjects and responses from 2390 subjects was analyzed. Among 2390
responses 1837 missing values were re-coded, and assigned a character value to the missing
value for descriptive and inferential analyses. The missing values were then treated as non-
existent in STATA environment. Hence, valid 553 responses were analyzed in further
6
Against
HA1: There was a significant difference in smoking habits of men and women.
H02: Age had no correlation with the smoking frequency of sample subjects.
Against
HA2: There was a significant association of age of the subjects with their smoking frequency.
H03: Recent depression has no impact on the number of cigarettes smoked.
Against
HA3: Recent depression has a significant impact on the frequency of smoking.
Methodology
Four variables for the research purpose were extracted from the master data file to
evaluate the impact of age, gender and depression felt on cigarette addiction and smoking
frequency. STATA 15.0 version was utilized as the data analysis software platform for the
present research. The missing responses or responses where subjects did not want to answer were
taken care of in the STATA environment. The dependent "cgtsday" implied the number of
cigarette smoking by the subjects and responses from 2390 subjects was analyzed. Among 2390
responses 1837 missing values were re-coded, and assigned a character value to the missing
value for descriptive and inferential analyses. The missing values were then treated as non-
existent in STATA environment. Hence, valid 553 responses were analyzed in further
6
⊘ This is a preview!⊘
Do you want full access?
Subscribe today to unlock all pages.
Trusted by 1+ million students worldwide
investigation. To test the gender difference effect on smoking cigarettes, an independent t-test
was used. The relation of smoking frequency with age of the subjects was tested by a Pearson’s
correlation coefficient.
Categorical Variable Generation for “cgtsday”
A new categorical variable “cgtsday_cat” was generated, where three categories of
smokers were created based on the frequency of smoking. Subjects smoking between 0 - 15
cigarettes was labeled as “Low Smoking”, smokers ranged between 16 to 30 cigarettes were
named as “Medium Smoking”, and smoking frequency between 31 to 45 cigarettes a day was
labeled as "High Smoking". A chi-square test was used to find the categorical difference of
smoking frequency on past depression levels. Finally, a multiple regression model was
constructed for testing the linear relationship between the outcome and control variables.
One Variable Summary
Control variables
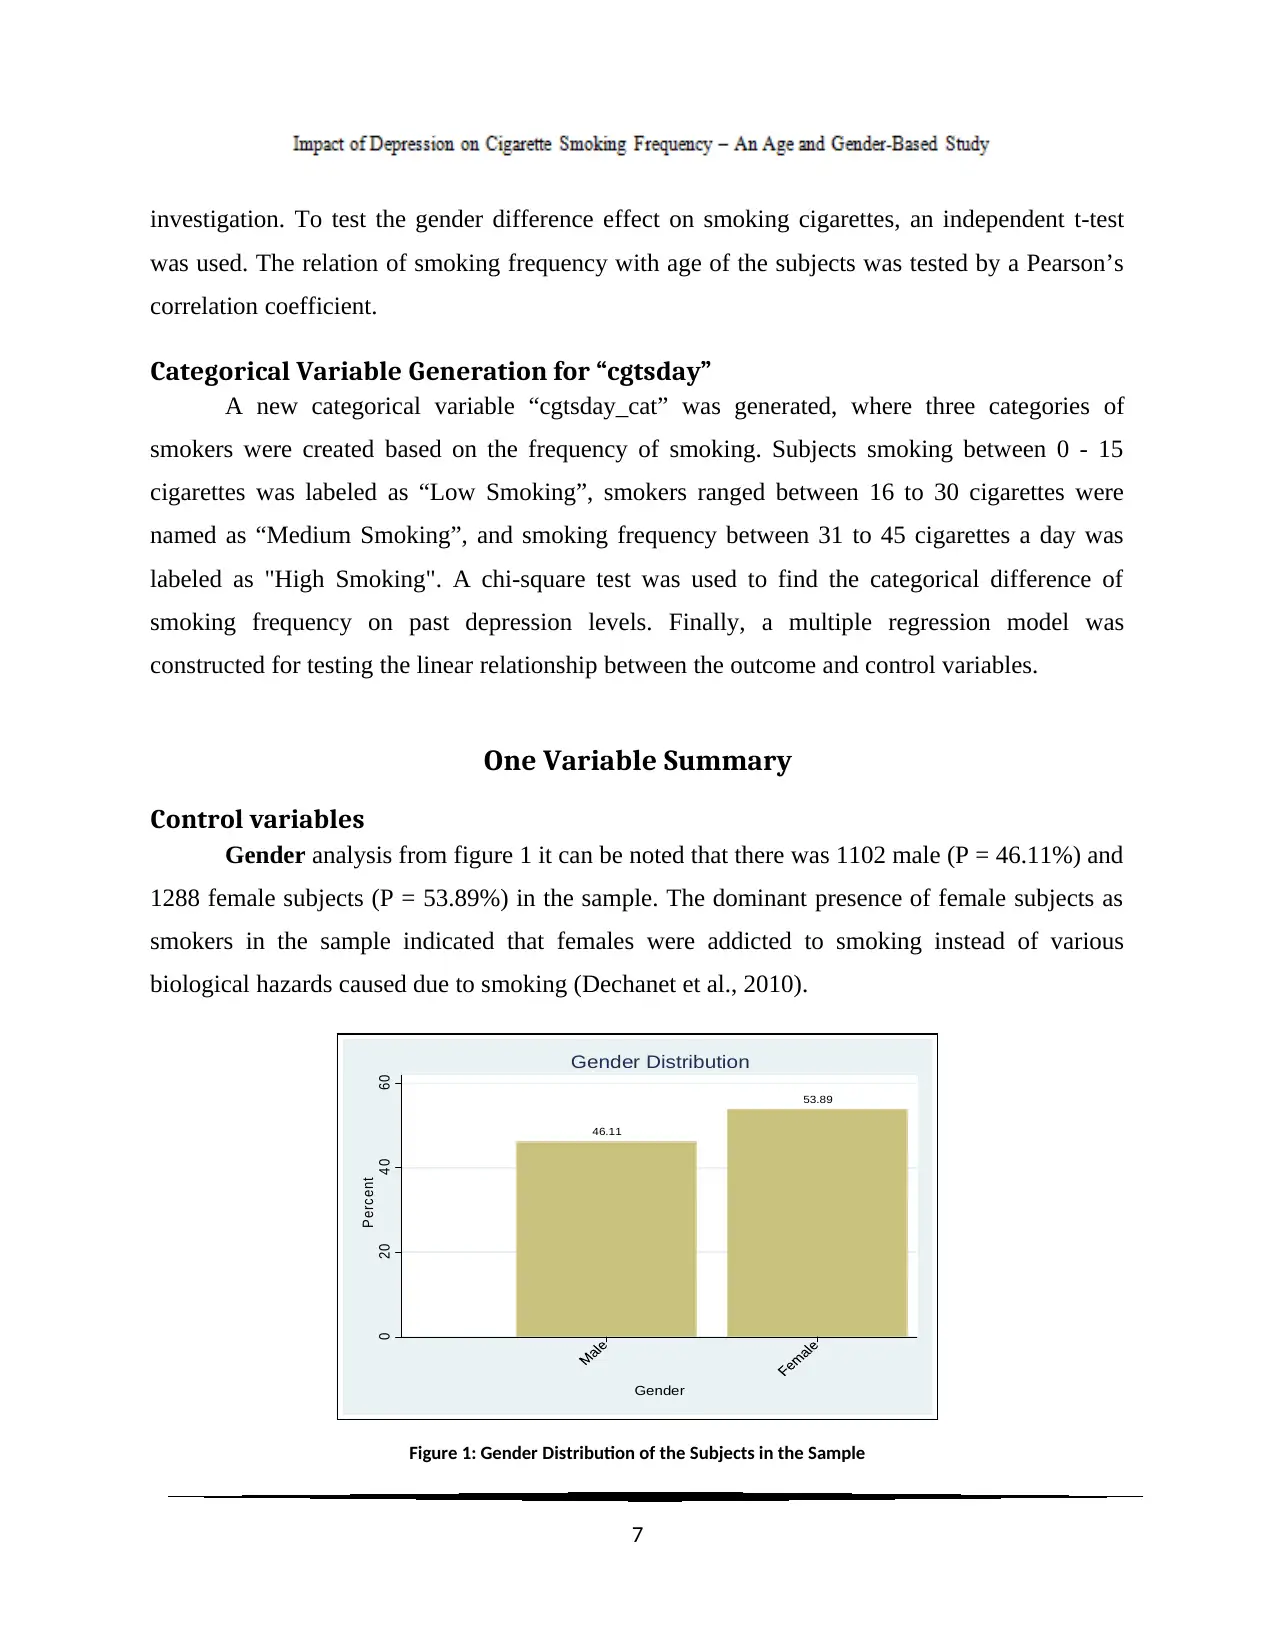
Gender analysis from figure 1 it can be noted that there was 1102 male (P = 46.11%) and
1288 female subjects (P = 53.89%) in the sample. The dominant presence of female subjects as
smokers in the sample indicated that females were addicted to smoking instead of various
biological hazards caused due to smoking (Dechanet et al., 2010).
46.11
53.89
0 20 40 60
Percent
Gender
Gender Distribution
Figure 1: Gender Distribution of the Subjects in the Sample
7
was used. The relation of smoking frequency with age of the subjects was tested by a Pearson’s
correlation coefficient.
Categorical Variable Generation for “cgtsday”
A new categorical variable “cgtsday_cat” was generated, where three categories of
smokers were created based on the frequency of smoking. Subjects smoking between 0 - 15
cigarettes was labeled as “Low Smoking”, smokers ranged between 16 to 30 cigarettes were
named as “Medium Smoking”, and smoking frequency between 31 to 45 cigarettes a day was
labeled as "High Smoking". A chi-square test was used to find the categorical difference of
smoking frequency on past depression levels. Finally, a multiple regression model was
constructed for testing the linear relationship between the outcome and control variables.
One Variable Summary
Control variables
Gender analysis from figure 1 it can be noted that there was 1102 male (P = 46.11%) and
1288 female subjects (P = 53.89%) in the sample. The dominant presence of female subjects as
smokers in the sample indicated that females were addicted to smoking instead of various
biological hazards caused due to smoking (Dechanet et al., 2010).
46.11
53.89
0 20 40 60
Percent
Gender
Gender Distribution
Figure 1: Gender Distribution of the Subjects in the Sample
7
Paraphrase This Document
Need a fresh take? Get an instant paraphrase of this document with our AI Paraphraser
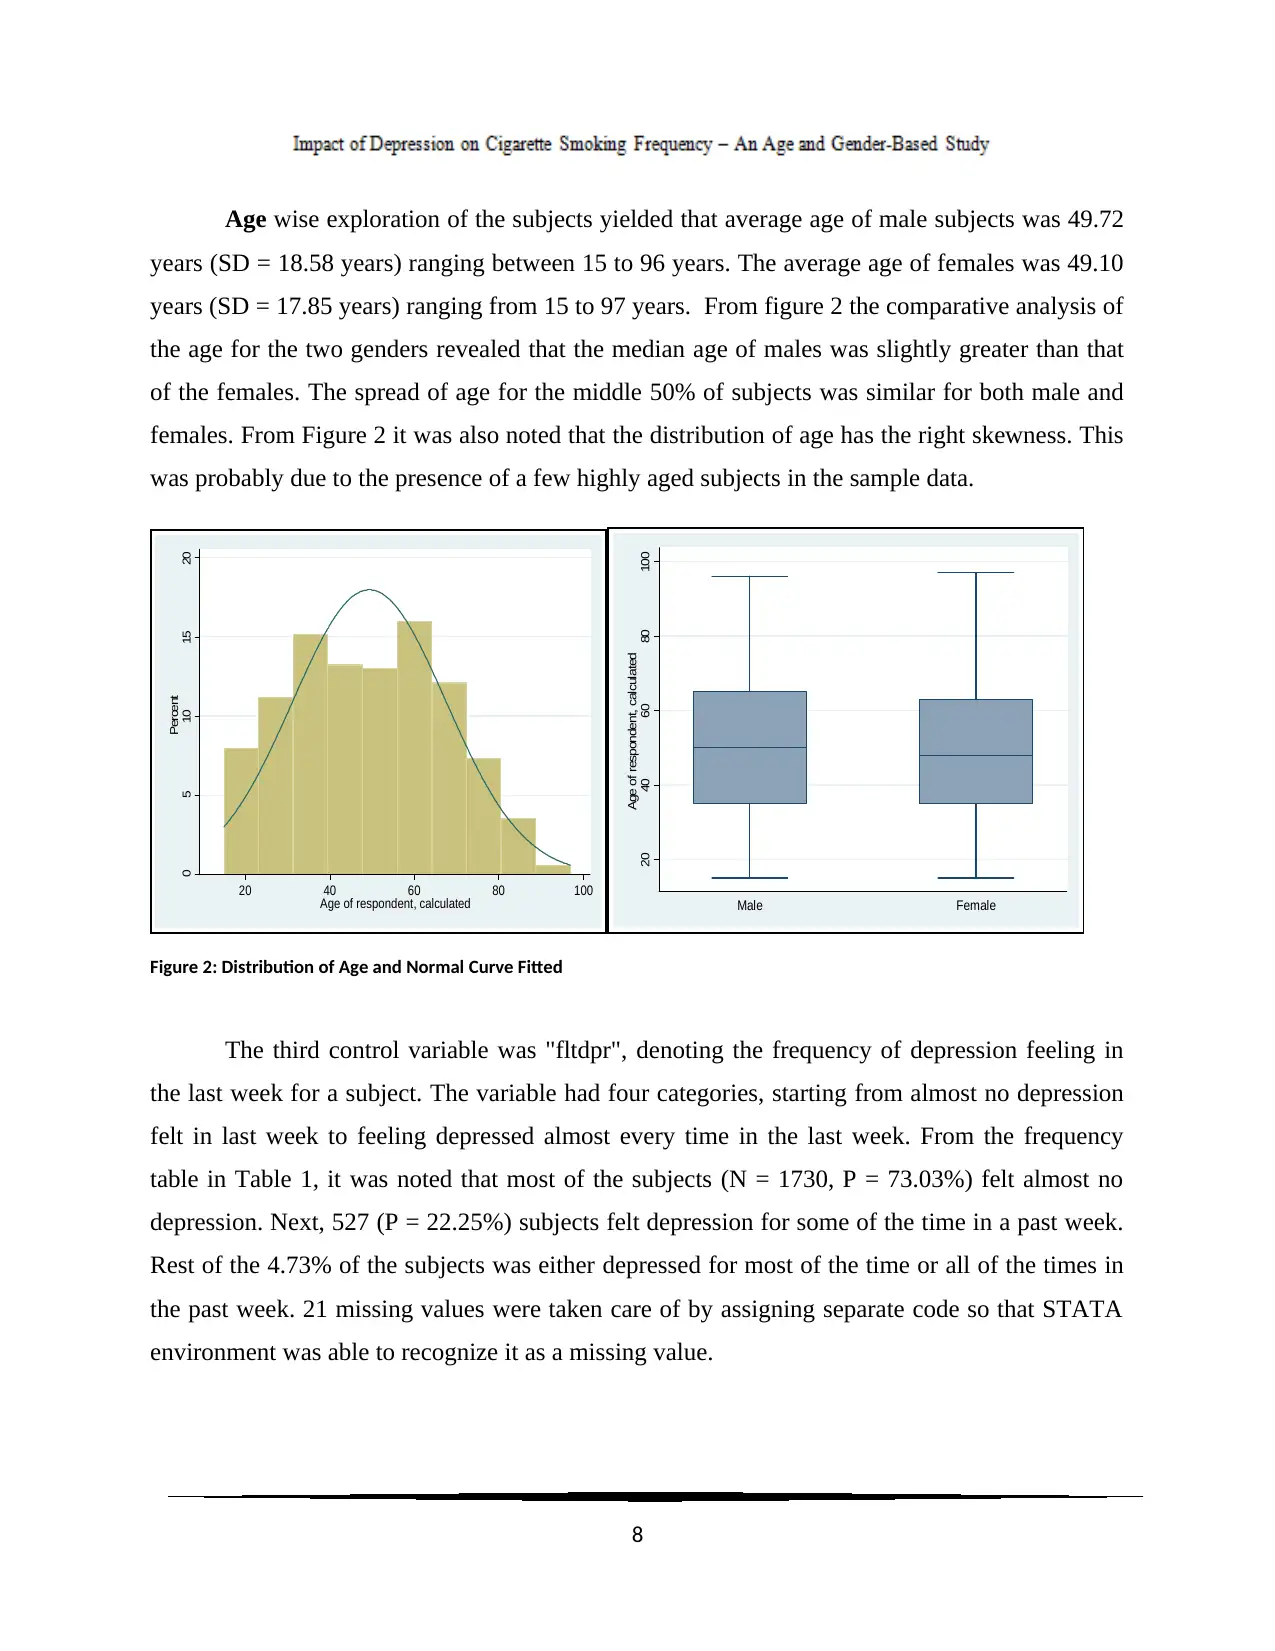
Age wise exploration of the subjects yielded that average age of male subjects was 49.72
years (SD = 18.58 years) ranging between 15 to 96 years. The average age of females was 49.10
years (SD = 17.85 years) ranging from 15 to 97 years. From figure 2 the comparative analysis of
the age for the two genders revealed that the median age of males was slightly greater than that
of the females. The spread of age for the middle 50% of subjects was similar for both male and
females. From Figure 2 it was also noted that the distribution of age has the right skewness. This
was probably due to the presence of a few highly aged subjects in the sample data.
0 5 10 15 20
Percent
20 40 60 80 100
Age of respondent, calculated
20 40 60 80 100
Age of respondent, calculated
Male Female
Figure 2: Distribution of Age and Normal Curve Fitted
The third control variable was "fltdpr", denoting the frequency of depression feeling in
the last week for a subject. The variable had four categories, starting from almost no depression
felt in last week to feeling depressed almost every time in the last week. From the frequency
table in Table 1, it was noted that most of the subjects (N = 1730, P = 73.03%) felt almost no
depression. Next, 527 (P = 22.25%) subjects felt depression for some of the time in a past week.
Rest of the 4.73% of the subjects was either depressed for most of the time or all of the times in
the past week. 21 missing values were taken care of by assigning separate code so that STATA
environment was able to recognize it as a missing value.
8
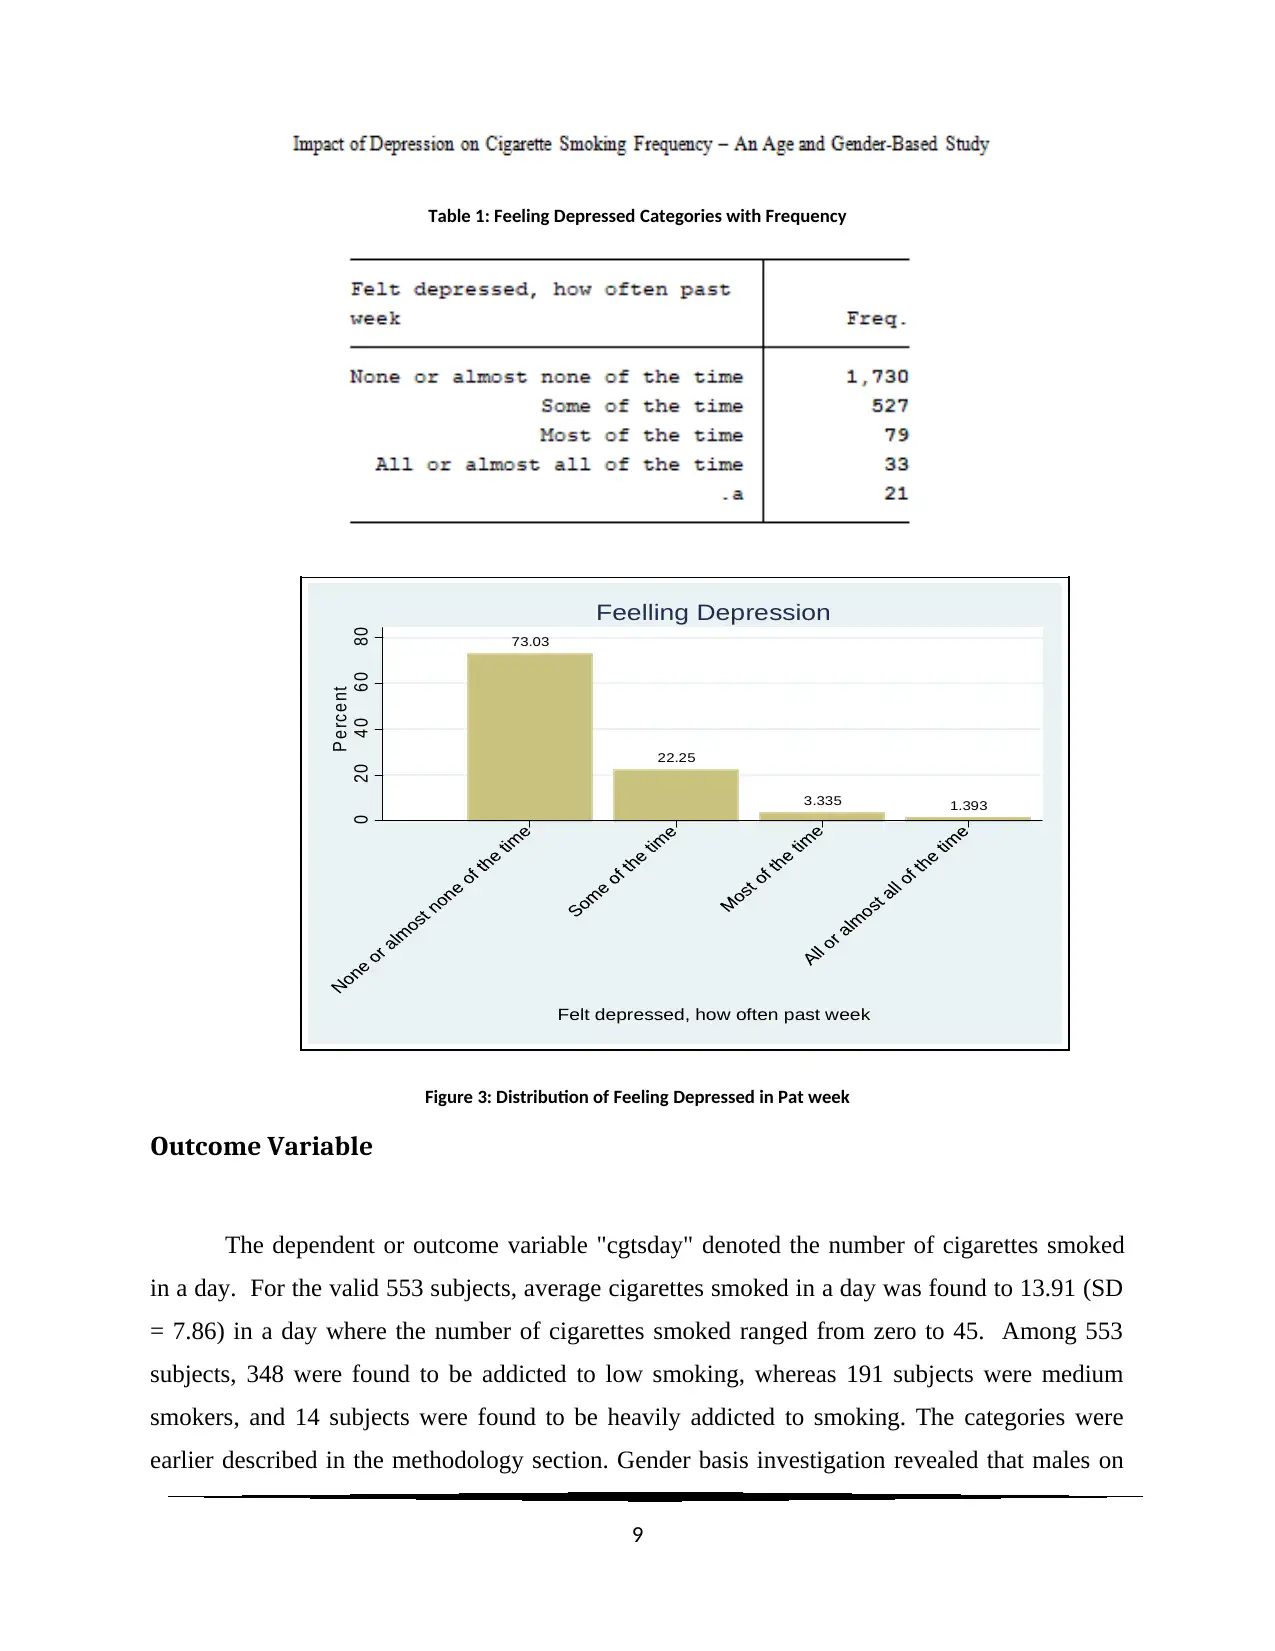
Table 1: Feeling Depressed Categories with Frequency
73.03
22.25
3.335 1.393
0 20 40 60 80
P e rce nt
Felt depressed, how often past week
Feelling Depression
Figure 3: Distribution of Feeling Depressed in Pat week
Outcome Variable
The dependent or outcome variable "cgtsday" denoted the number of cigarettes smoked
in a day. For the valid 553 subjects, average cigarettes smoked in a day was found to 13.91 (SD
= 7.86) in a day where the number of cigarettes smoked ranged from zero to 45. Among 553
subjects, 348 were found to be addicted to low smoking, whereas 191 subjects were medium
smokers, and 14 subjects were found to be heavily addicted to smoking. The categories were
earlier described in the methodology section. Gender basis investigation revealed that males on
9
⊘ This is a preview!⊘
Do you want full access?
Subscribe today to unlock all pages.
Trusted by 1+ million students worldwide
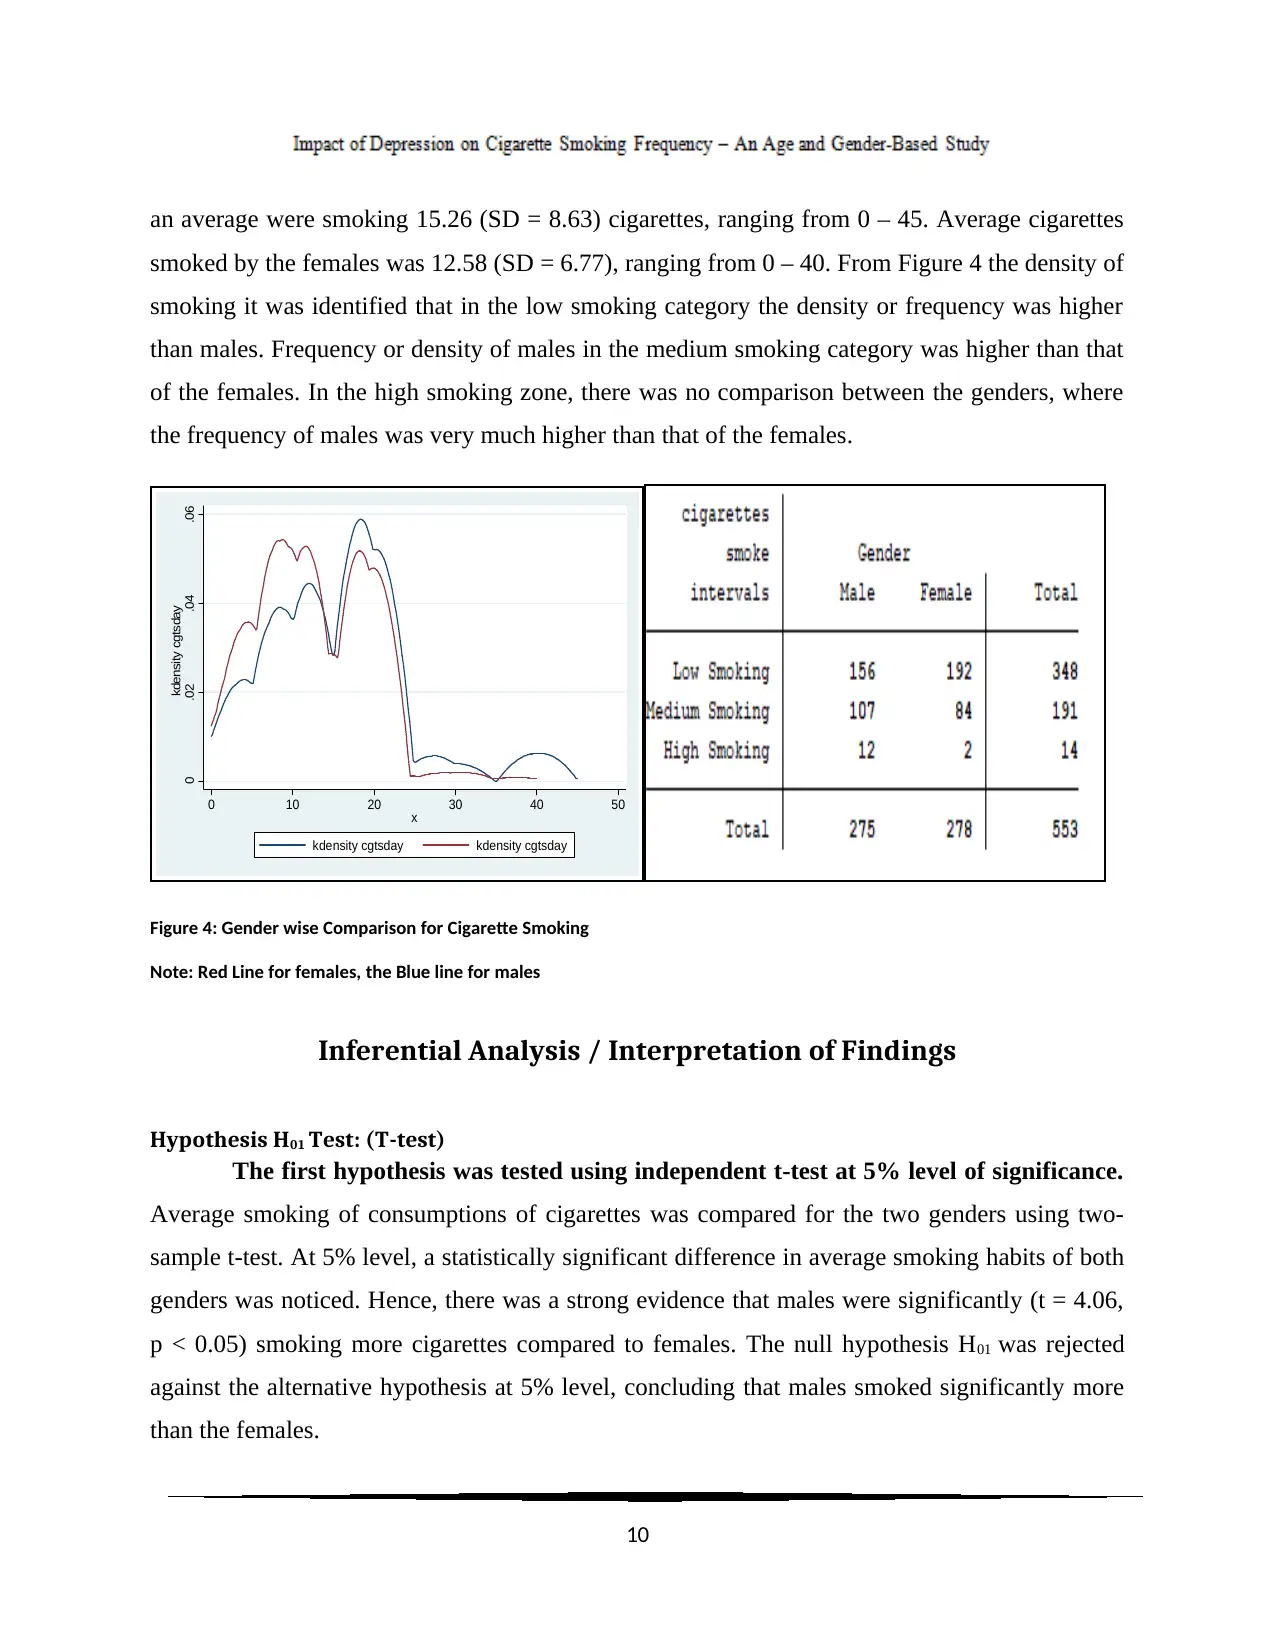
an average were smoking 15.26 (SD = 8.63) cigarettes, ranging from 0 – 45. Average cigarettes
smoked by the females was 12.58 (SD = 6.77), ranging from 0 – 40. From Figure 4 the density of
smoking it was identified that in the low smoking category the density or frequency was higher
than males. Frequency or density of males in the medium smoking category was higher than that
of the females. In the high smoking zone, there was no comparison between the genders, where
the frequency of males was very much higher than that of the females.
0 .02 .04 .06
kdensity cgtsday
0 10 20 30 40 50
x
kdensity cgtsday kdensity cgtsday
Figure 4: Gender wise Comparison for Cigarette Smoking
Note: Red Line for females, the Blue line for males
Inferential Analysis / Interpretation of Findings
Hypothesis H01 Test: (T-test)
The first hypothesis was tested using independent t-test at 5% level of significance.
Average smoking of consumptions of cigarettes was compared for the two genders using two-
sample t-test. At 5% level, a statistically significant difference in average smoking habits of both
genders was noticed. Hence, there was a strong evidence that males were significantly (t = 4.06,
p < 0.05) smoking more cigarettes compared to females. The null hypothesis H01 was rejected
against the alternative hypothesis at 5% level, concluding that males smoked significantly more
than the females.
10
Paraphrase This Document
Need a fresh take? Get an instant paraphrase of this document with our AI Paraphraser
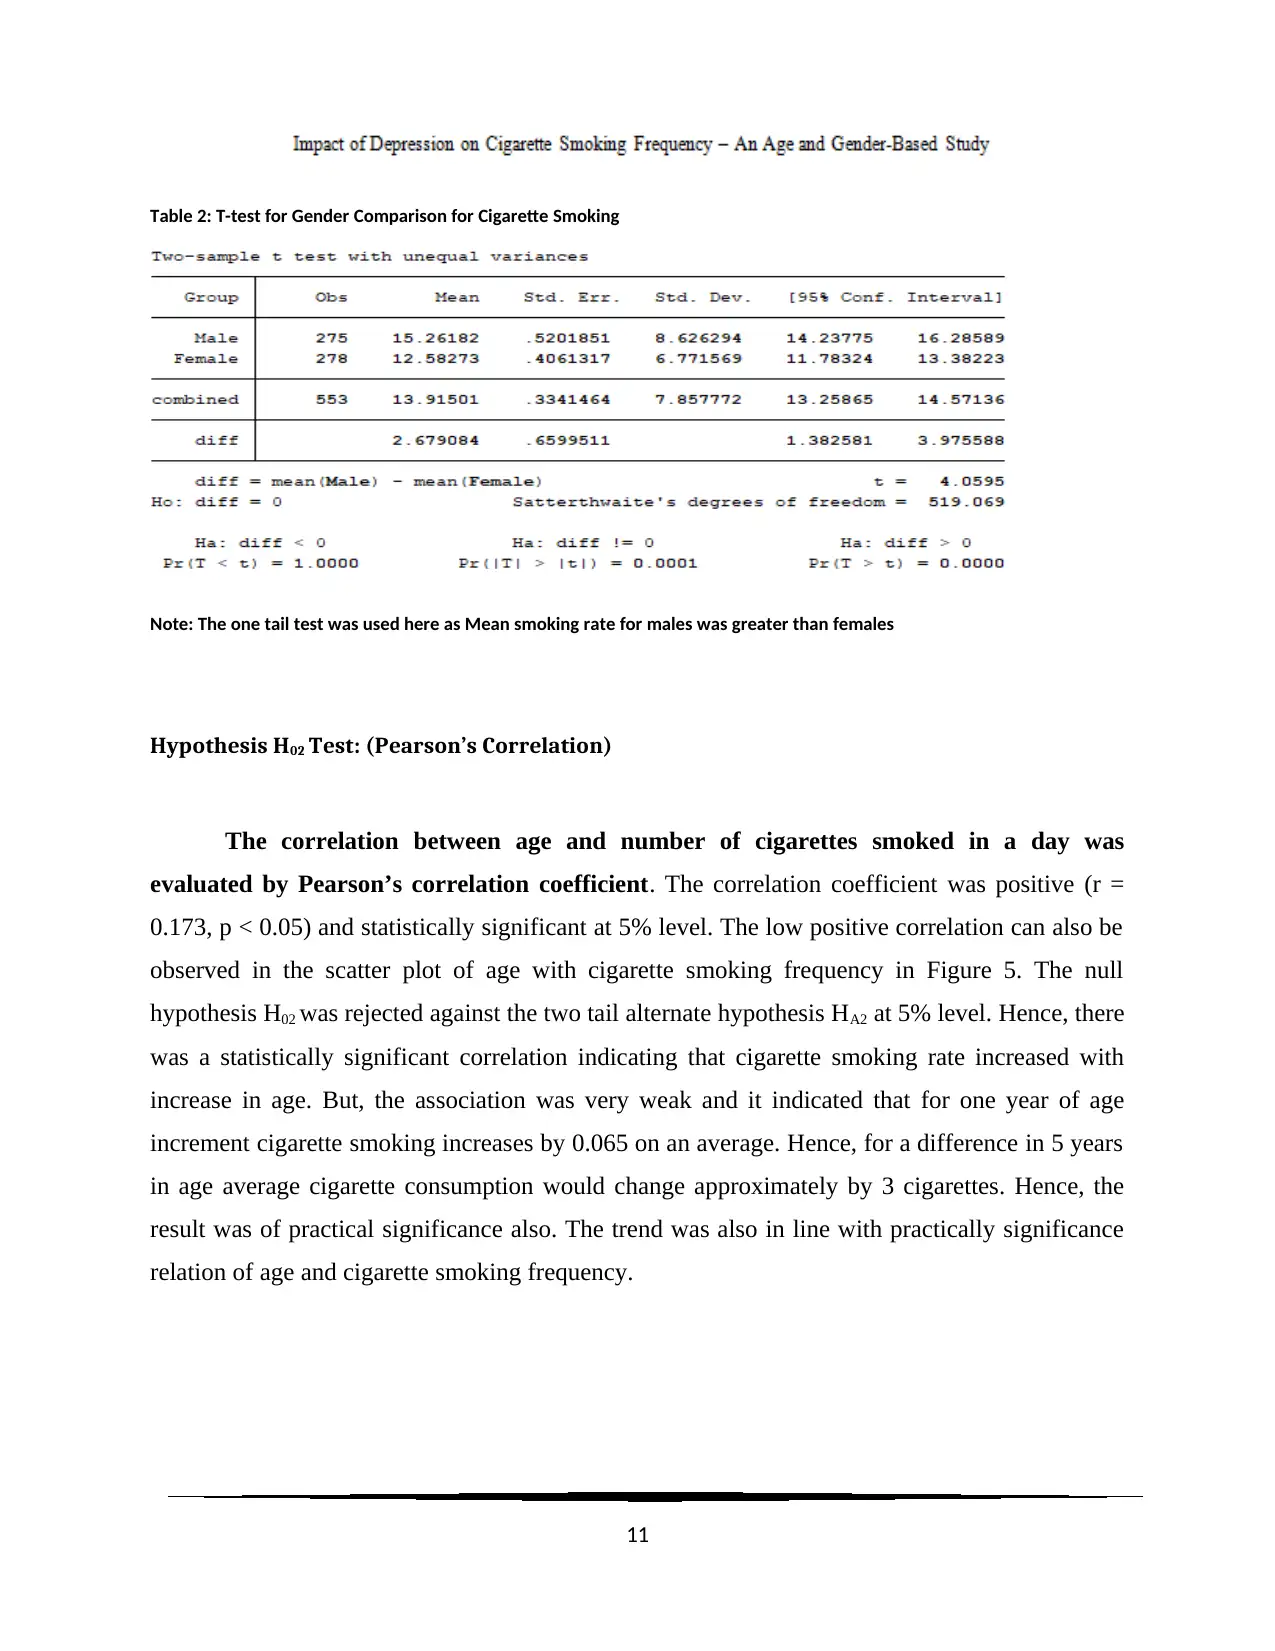
Table 2: T-test for Gender Comparison for Cigarette Smoking
Note: The one tail test was used here as Mean smoking rate for males was greater than females
Hypothesis H02 Test: (Pearson’s Correlation)
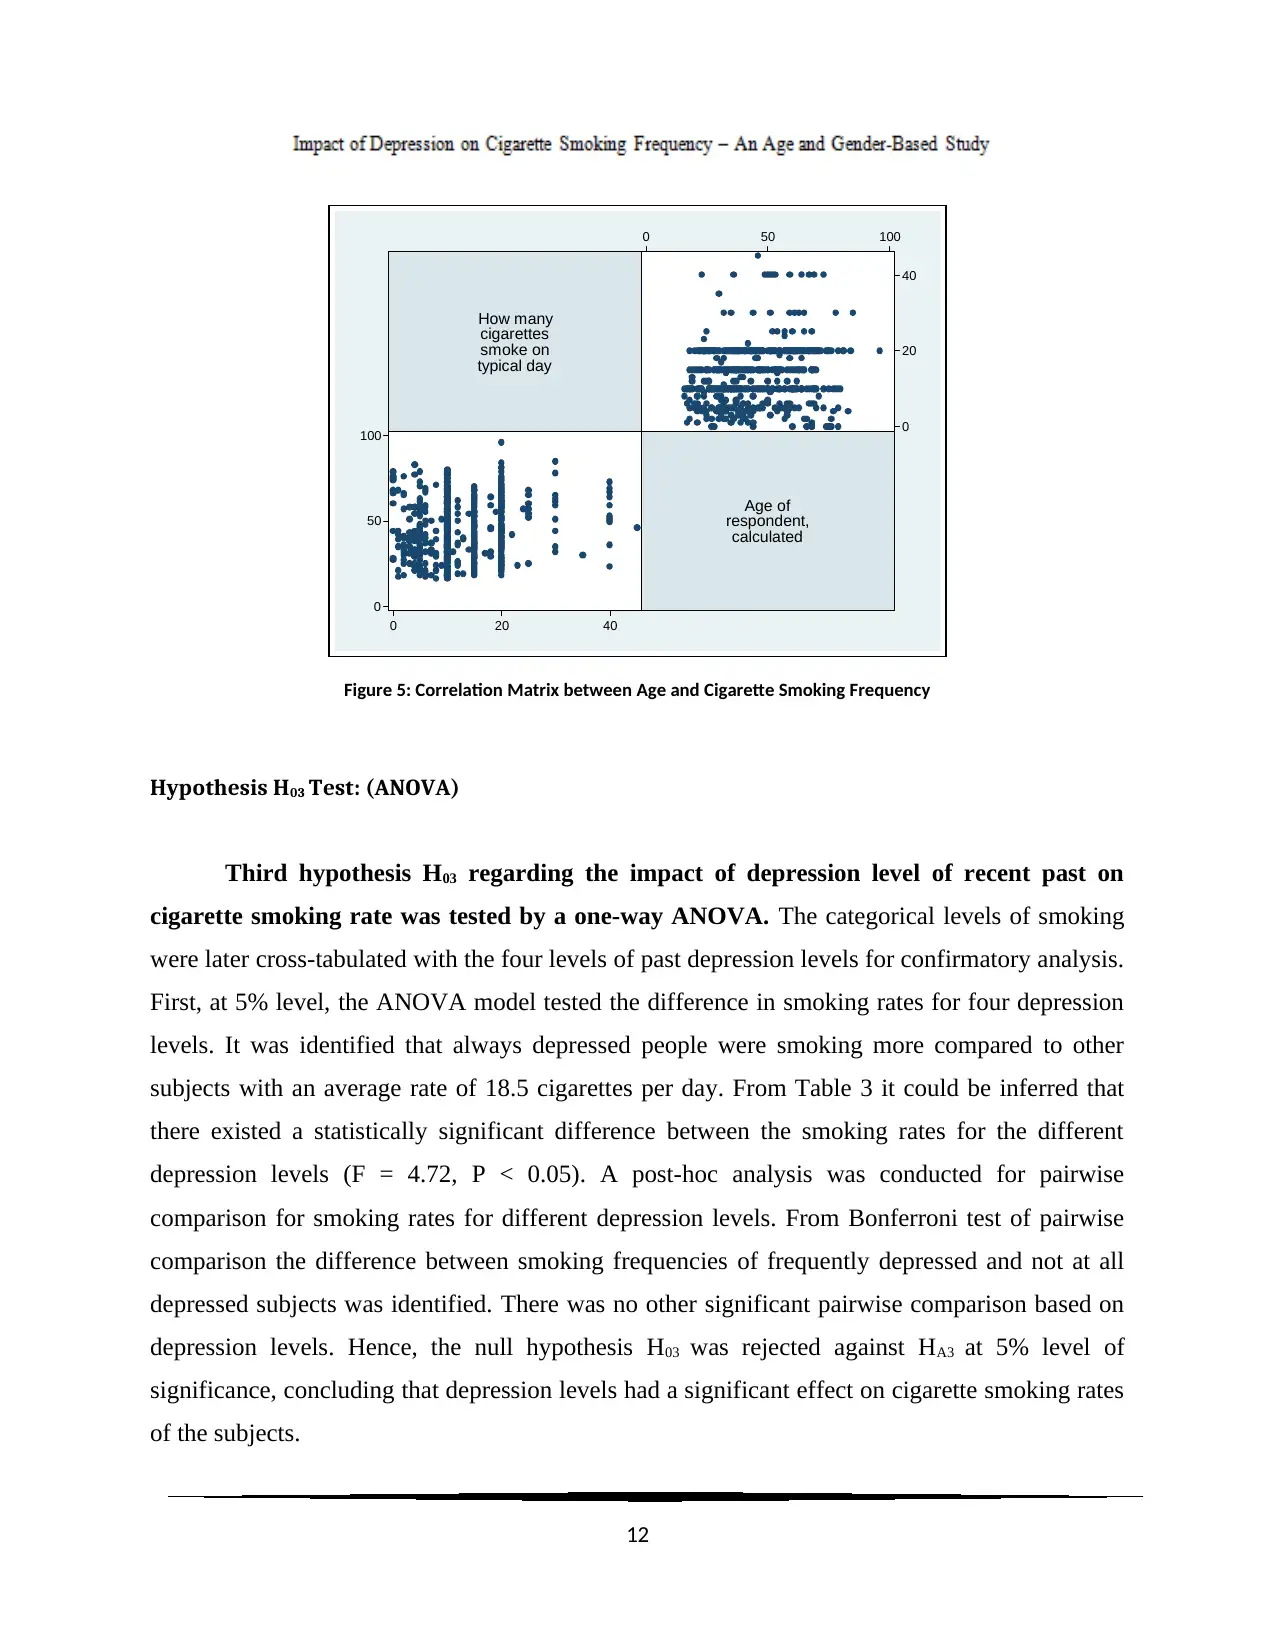
The correlation between age and number of cigarettes smoked in a day was
evaluated by Pearson’s correlation coefficient. The correlation coefficient was positive (r =
0.173, p < 0.05) and statistically significant at 5% level. The low positive correlation can also be
observed in the scatter plot of age with cigarette smoking frequency in Figure 5. The null
hypothesis H02 was rejected against the two tail alternate hypothesis HA2 at 5% level. Hence, there
was a statistically significant correlation indicating that cigarette smoking rate increased with
increase in age. But, the association was very weak and it indicated that for one year of age
increment cigarette smoking increases by 0.065 on an average. Hence, for a difference in 5 years
in age average cigarette consumption would change approximately by 3 cigarettes. Hence, the
result was of practical significance also. The trend was also in line with practically significance
relation of age and cigarette smoking frequency.
11
Note: The one tail test was used here as Mean smoking rate for males was greater than females
Hypothesis H02 Test: (Pearson’s Correlation)
The correlation between age and number of cigarettes smoked in a day was
evaluated by Pearson’s correlation coefficient. The correlation coefficient was positive (r =
0.173, p < 0.05) and statistically significant at 5% level. The low positive correlation can also be
observed in the scatter plot of age with cigarette smoking frequency in Figure 5. The null
hypothesis H02 was rejected against the two tail alternate hypothesis HA2 at 5% level. Hence, there
was a statistically significant correlation indicating that cigarette smoking rate increased with
increase in age. But, the association was very weak and it indicated that for one year of age
increment cigarette smoking increases by 0.065 on an average. Hence, for a difference in 5 years
in age average cigarette consumption would change approximately by 3 cigarettes. Hence, the
result was of practical significance also. The trend was also in line with practically significance
relation of age and cigarette smoking frequency.
11
How many
cigarettes
smoke on
typical day
Age of
respondent,
calculated
0
20
40
0 20 40
0
50
100
0 50 100
Figure 5: Correlation Matrix between Age and Cigarette Smoking Frequency
Hypothesis H03 Test: (ANOVA)
Third hypothesis H03 regarding the impact of depression level of recent past on
cigarette smoking rate was tested by a one-way ANOVA. The categorical levels of smoking
were later cross-tabulated with the four levels of past depression levels for confirmatory analysis.
First, at 5% level, the ANOVA model tested the difference in smoking rates for four depression
levels. It was identified that always depressed people were smoking more compared to other
subjects with an average rate of 18.5 cigarettes per day. From Table 3 it could be inferred that
there existed a statistically significant difference between the smoking rates for the different
depression levels (F = 4.72, P < 0.05). A post-hoc analysis was conducted for pairwise
comparison for smoking rates for different depression levels. From Bonferroni test of pairwise
comparison the difference between smoking frequencies of frequently depressed and not at all
depressed subjects was identified. There was no other significant pairwise comparison based on
depression levels. Hence, the null hypothesis H03 was rejected against HA3 at 5% level of
significance, concluding that depression levels had a significant effect on cigarette smoking rates
of the subjects.
12
⊘ This is a preview!⊘
Do you want full access?
Subscribe today to unlock all pages.
Trusted by 1+ million students worldwide
1 out of 24
Your All-in-One AI-Powered Toolkit for Academic Success.
+13062052269
info@desklib.com
Available 24*7 on WhatsApp / Email
![[object Object]](/_next/static/media/star-bottom.7253800d.svg)
Unlock your academic potential
Copyright © 2020–2026 A2Z Services. All Rights Reserved. Developed and managed by ZUCOL.