Descriptive Statistics Analysis: Health Attributes of Hospital Nurses
VerifiedAdded on 2022/08/23
|7
|981
|22
Report
AI Summary
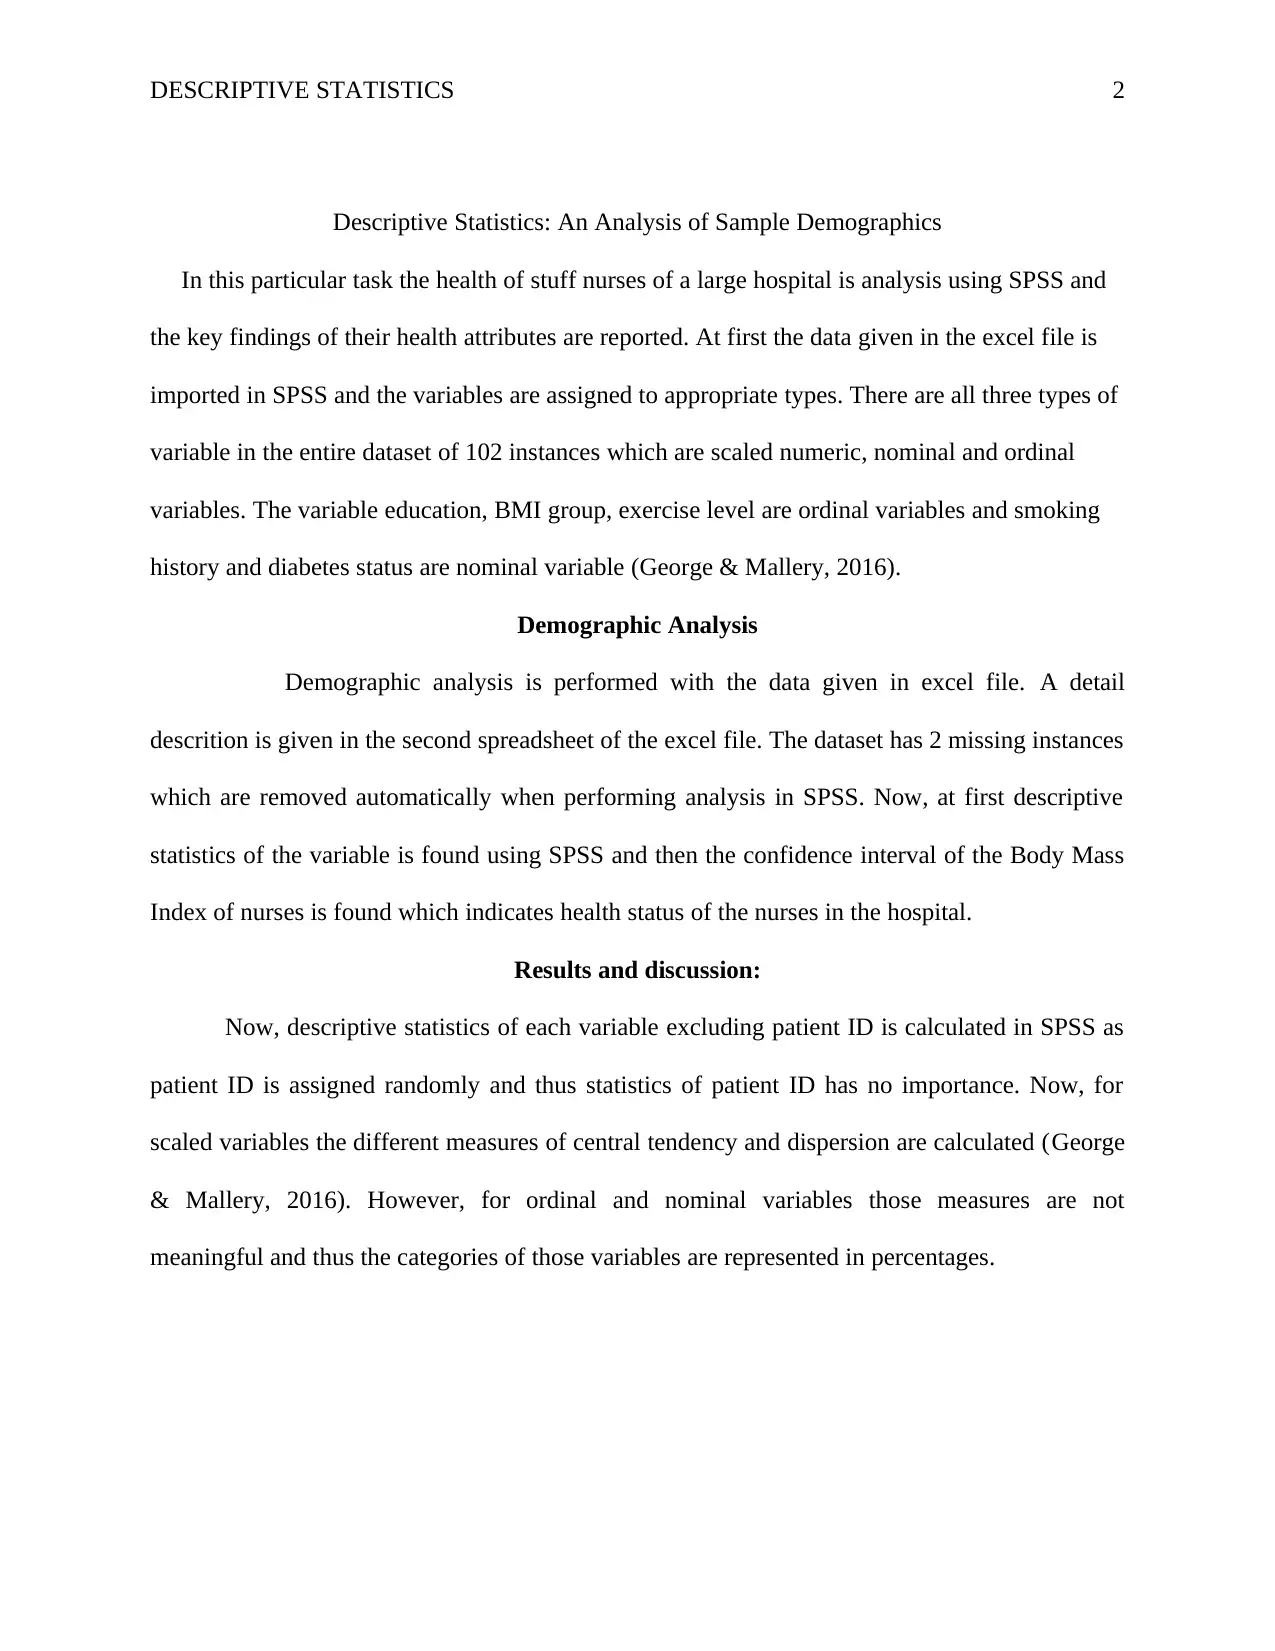
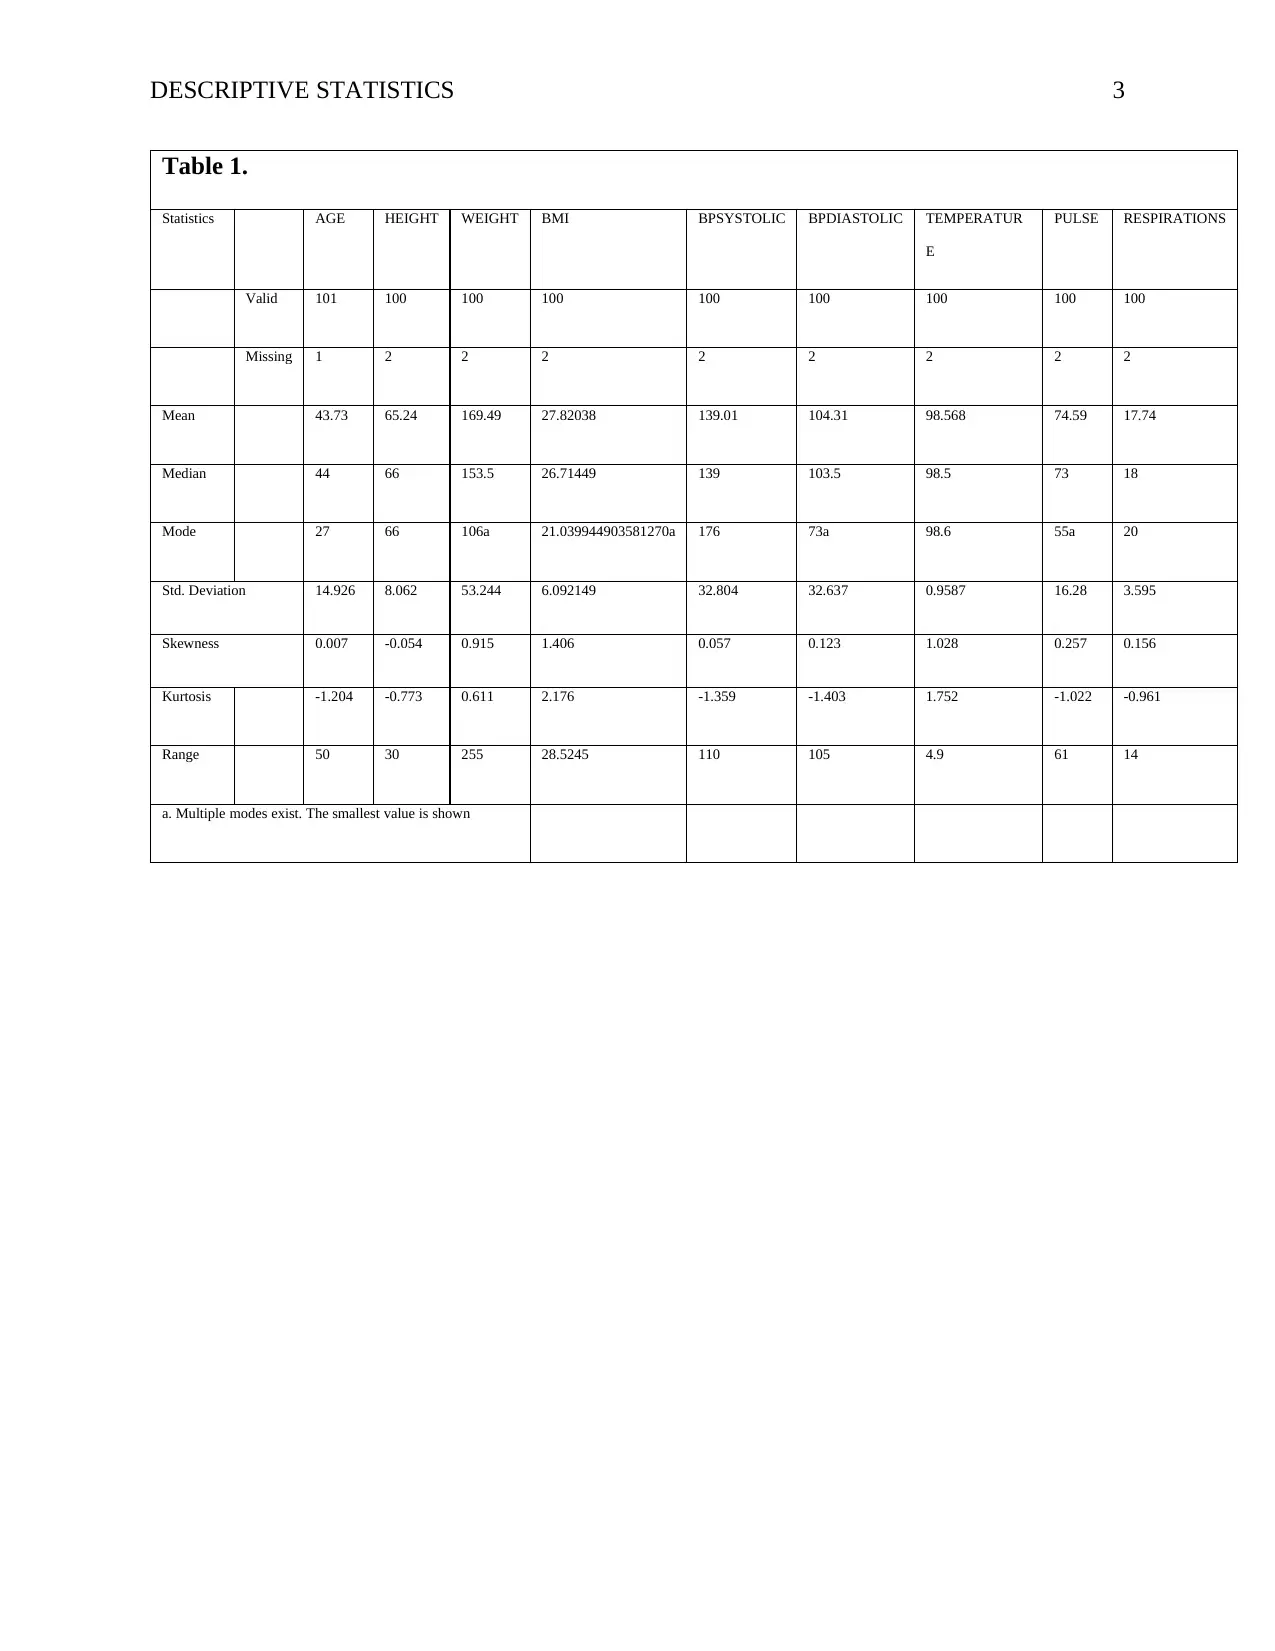
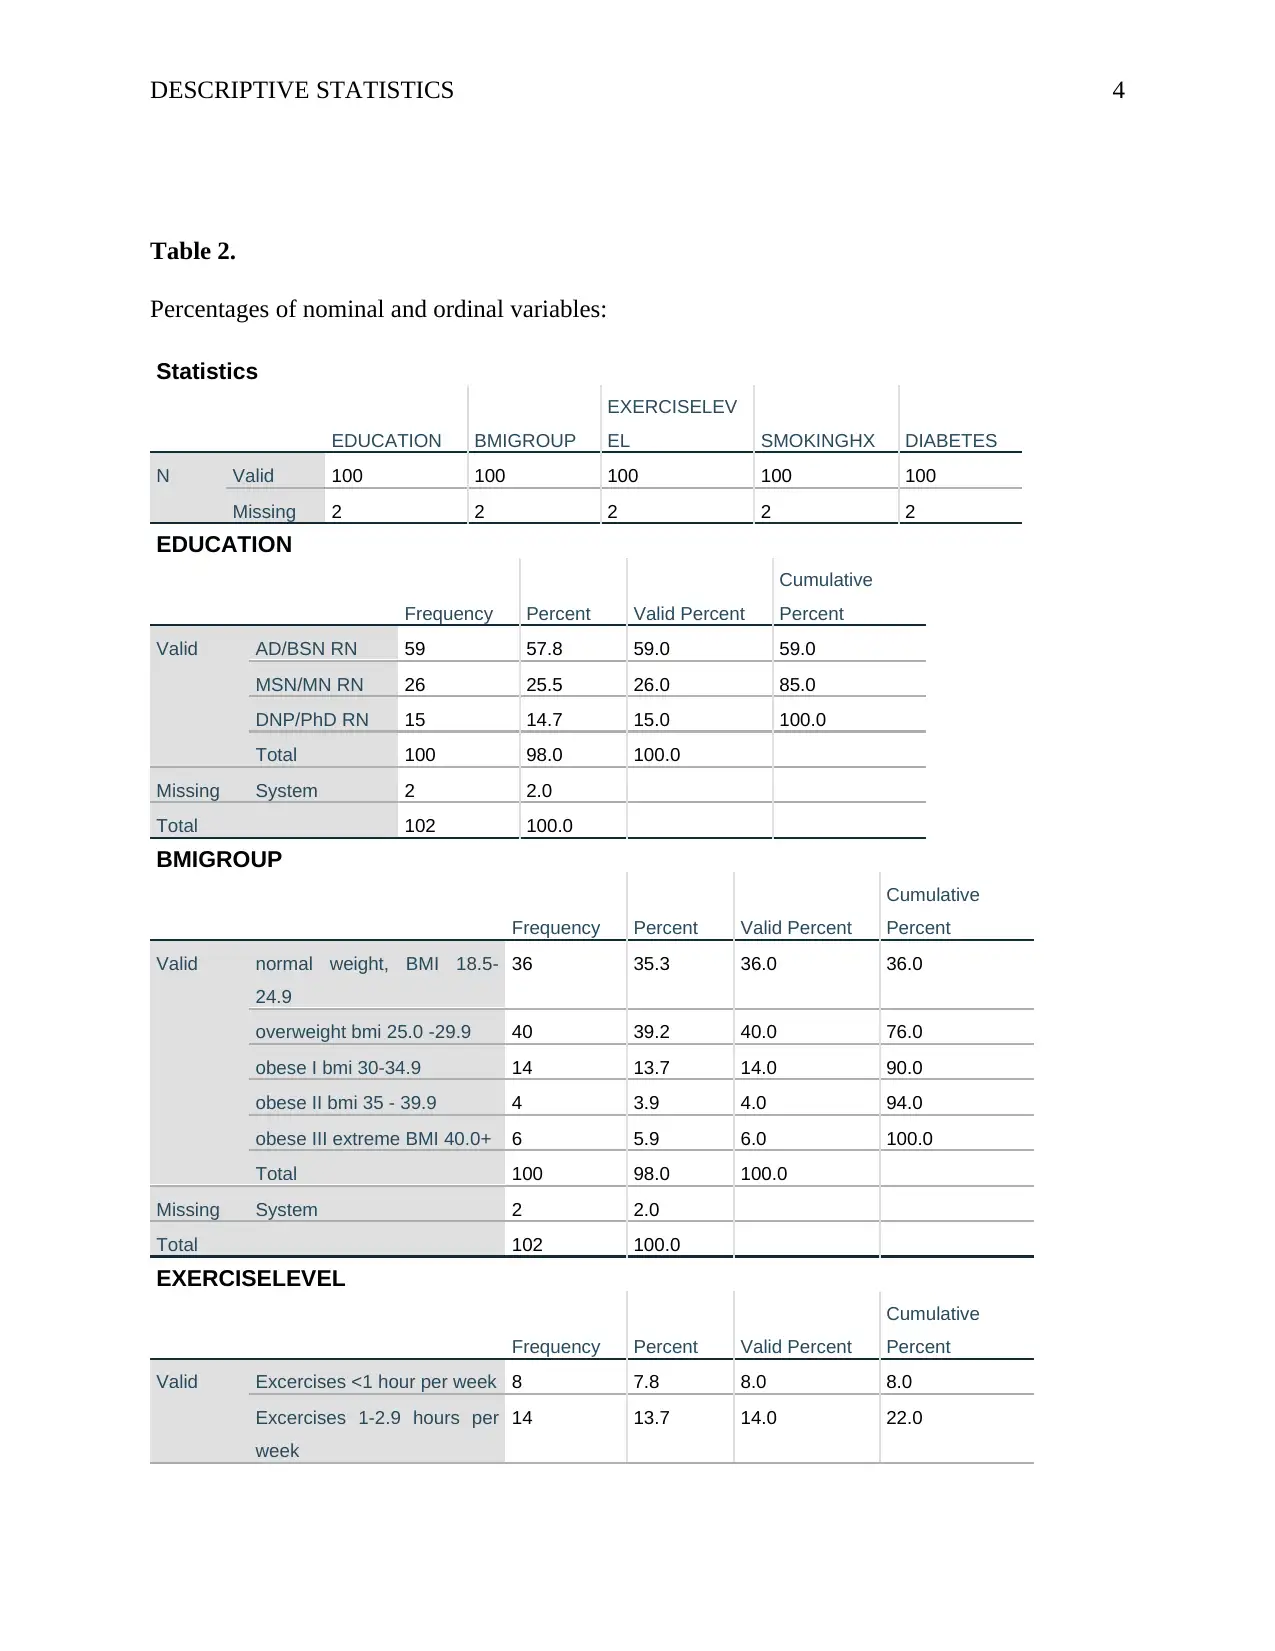
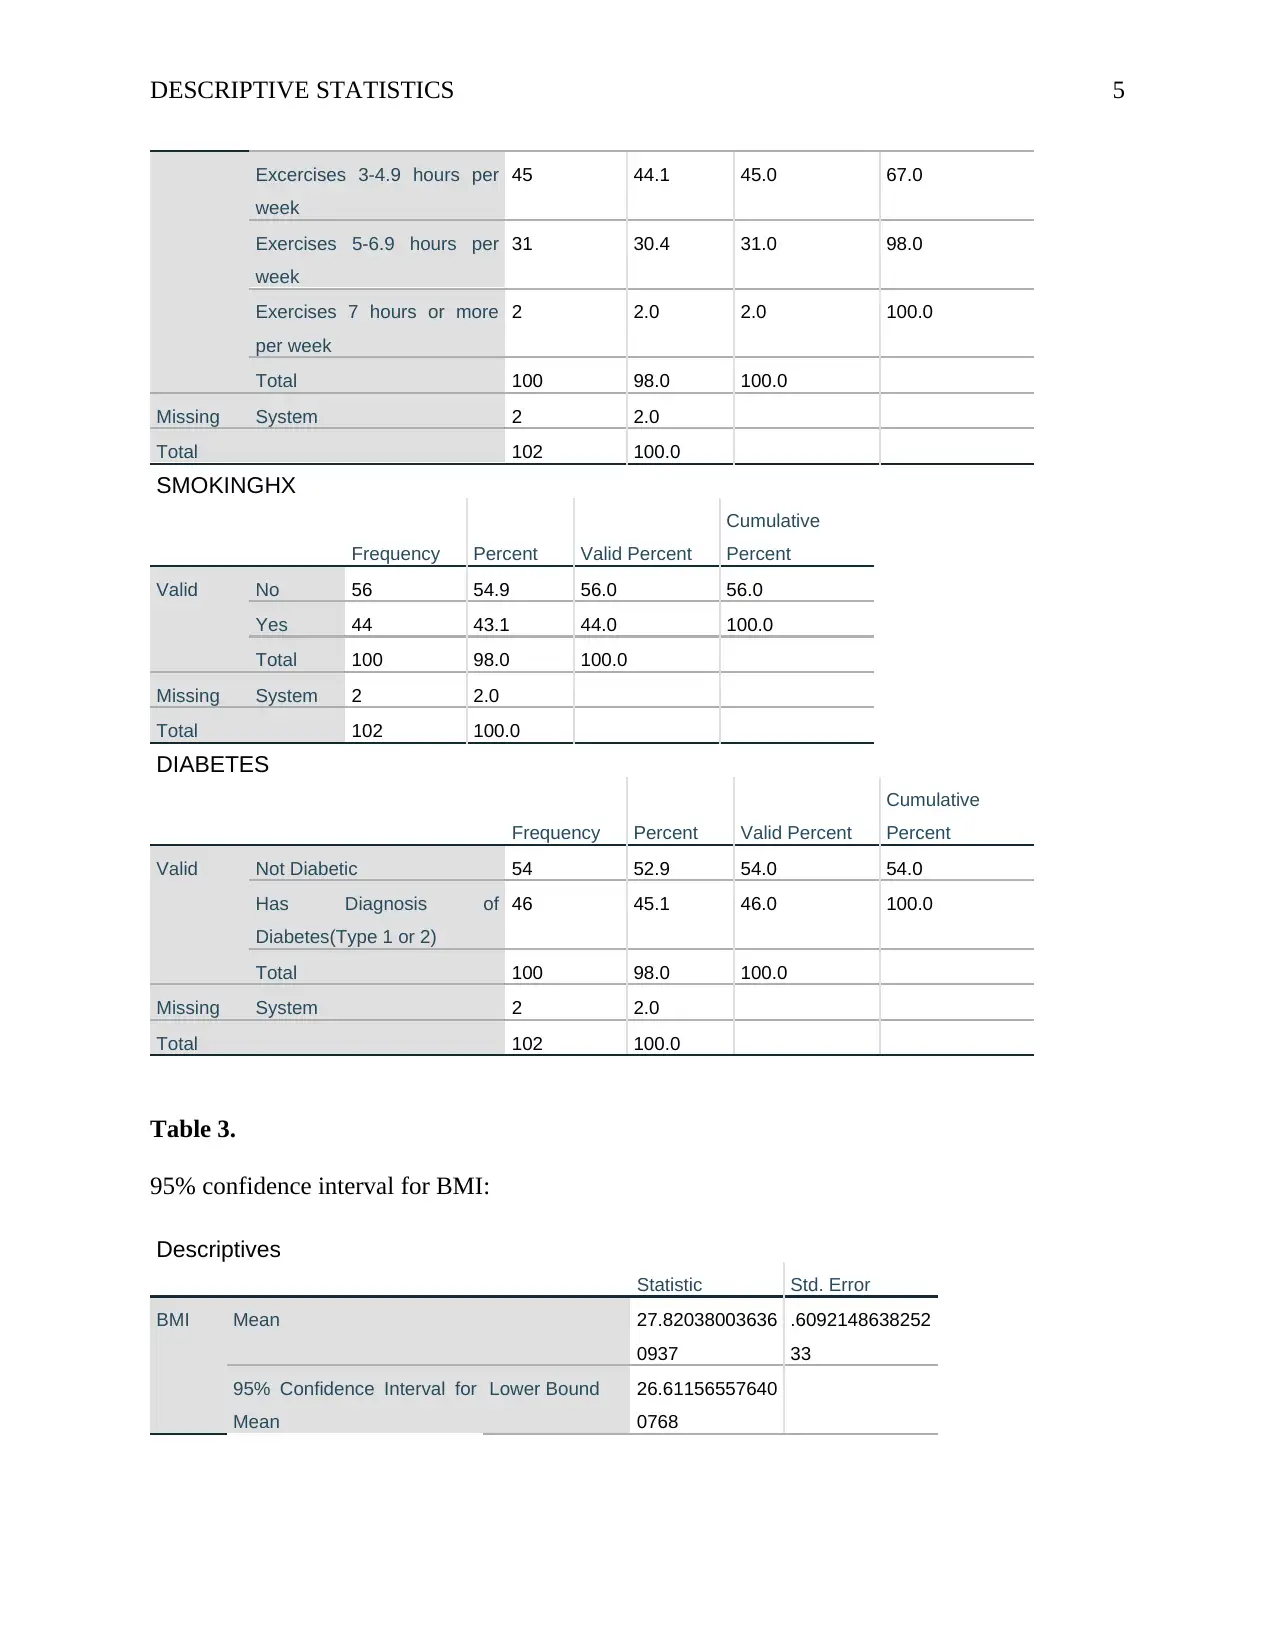
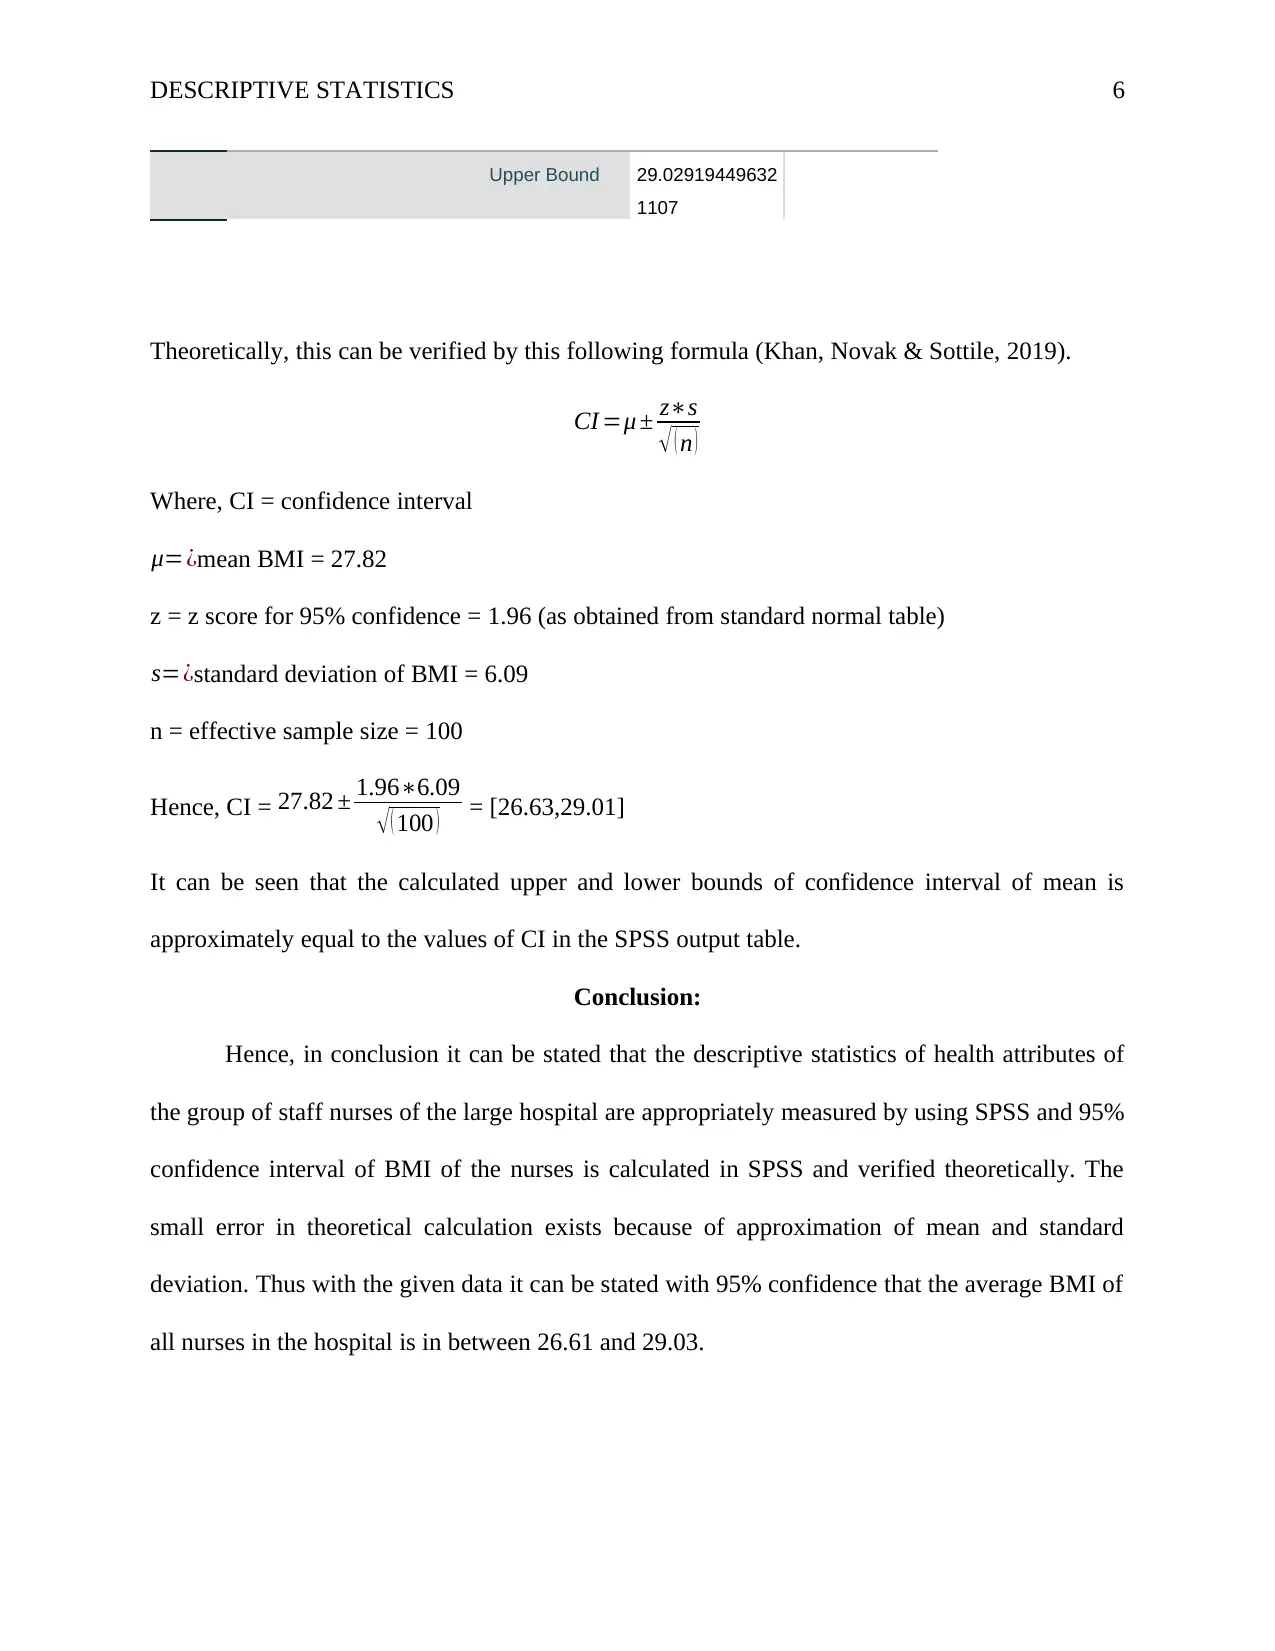
This report presents a descriptive statistical analysis of the health attributes of staff nurses at a large hospital. The analysis was performed using SPSS, importing data from an Excel file and assigning appropriate variable types (scaled numeric, nominal, and ordinal). Descriptive statistics, including measures of central tendency and dispersion for scaled variables, and percentages for ordinal and nominal variables, were calculated. The study focused on variables like age, height, weight, BMI, blood pressure, temperature, pulse, respirations, education, BMI group, exercise level, smoking history, and diabetes status. A 95% confidence interval for the nurses' BMI was calculated and verified theoretically. The findings indicated the average BMI of the nurses fell between 26.61 and 29.03. The report concludes that the descriptive statistics appropriately measure the health attributes of the nurses, offering insights into their overall health profile.

Running head: DESCRIPTIVE STATISTICS 1
Descriptive statistics
Name of the Student
Name of the University
Author Note
Descriptive statistics
Name of the Student
Name of the University
Author Note
Paraphrase This Document
Need a fresh take? Get an instant paraphrase of this document with our AI Paraphraser

DESCRIPTIVE STATISTICS
Descriptive Statistics: An Analysis of Sample Demographics
In this particular task the health of stuff nurses of a large hospital is analysis using SPSS and
the key findings of their health attributes are reported. At first the data given in the excel file is
imported in SPSS and the variables are assigned to appropriate types. There are all three types of
variable in the entire dataset of 102 instances which are scaled numeric, nominal and ordinal
variables. The variable education, BMI group, exercise level are ordinal variables and smoking
history and diabetes status are nominal variable (George & Mallery, 2016).
Demographic Analysis
Demographic analysis is performed with the data given in excel file. A detail
descrition is given in the second spreadsheet of the excel file. The dataset has 2 missing instances
which are removed automatically when performing analysis in SPSS. Now, at first descriptive
statistics of the variable is found using SPSS and then the confidence interval of the Body Mass
Index of nurses is found which indicates health status of the nurses in the hospital.
Results and discussion:
Now, descriptive statistics of each variable excluding patient ID is calculated in SPSS as
patient ID is assigned randomly and thus statistics of patient ID has no importance. Now, for
scaled variables the different measures of central tendency and dispersion are calculated (George
& Mallery, 2016). However, for ordinal and nominal variables those measures are not
meaningful and thus the categories of those variables are represented in percentages.
2

DESCRIPTIVE STATISTICS
Table 1.
Statistics AGE HEIGHT WEIGHT BMI BPSYSTOLIC BPDIASTOLIC TEMPERATUR
E
PULSE RESPIRATIONS
Valid 101 100 100 100 100 100 100 100 100
Missing 1 2 2 2 2 2 2 2 2
Mean 43.73 65.24 169.49 27.82038 139.01 104.31 98.568 74.59 17.74
Median 44 66 153.5 26.71449 139 103.5 98.5 73 18
Mode 27 66 106a 21.039944903581270a 176 73a 98.6 55a 20
Std. Deviation 14.926 8.062 53.244 6.092149 32.804 32.637 0.9587 16.28 3.595
Skewness 0.007 -0.054 0.915 1.406 0.057 0.123 1.028 0.257 0.156
Kurtosis -1.204 -0.773 0.611 2.176 -1.359 -1.403 1.752 -1.022 -0.961
Range 50 30 255 28.5245 110 105 4.9 61 14
a. Multiple modes exist. The smallest value is shown
3
⊘ This is a preview!⊘
Do you want full access?
Subscribe today to unlock all pages.

Trusted by 1+ million students worldwide

DESCRIPTIVE STATISTICS
Table 2.
Percentages of nominal and ordinal variables:
Statistics
EDUCATION BMIGROUP
EXERCISELEV
EL SMOKINGHX DIABETES
N Valid 100 100 100 100 100
Missing 2 2 2 2 2
EDUCATION
Frequency Percent Valid Percent
Cumulative
Percent
Valid AD/BSN RN 59 57.8 59.0 59.0
MSN/MN RN 26 25.5 26.0 85.0
DNP/PhD RN 15 14.7 15.0 100.0
Total 100 98.0 100.0
Missing System 2 2.0
Total 102 100.0
BMIGROUP
Frequency Percent Valid Percent
Cumulative
Percent
Valid normal weight, BMI 18.5-
24.9
36 35.3 36.0 36.0
overweight bmi 25.0 -29.9 40 39.2 40.0 76.0
obese I bmi 30-34.9 14 13.7 14.0 90.0
obese II bmi 35 - 39.9 4 3.9 4.0 94.0
obese III extreme BMI 40.0+ 6 5.9 6.0 100.0
Total 100 98.0 100.0
Missing System 2 2.0
Total 102 100.0
EXERCISELEVEL
Frequency Percent Valid Percent
Cumulative
Percent
Valid Excercises <1 hour per week 8 7.8 8.0 8.0
Excercises 1-2.9 hours per
week
14 13.7 14.0 22.0
4
Paraphrase This Document
Need a fresh take? Get an instant paraphrase of this document with our AI Paraphraser

DESCRIPTIVE STATISTICS
Excercises 3-4.9 hours per
week
45 44.1 45.0 67.0
Exercises 5-6.9 hours per
week
31 30.4 31.0 98.0
Exercises 7 hours or more
per week
2 2.0 2.0 100.0
Total 100 98.0 100.0
Missing System 2 2.0
Total 102 100.0
SMOKINGHX
Frequency Percent Valid Percent
Cumulative
Percent
Valid No 56 54.9 56.0 56.0
Yes 44 43.1 44.0 100.0
Total 100 98.0 100.0
Missing System 2 2.0
Total 102 100.0
DIABETES
Frequency Percent Valid Percent
Cumulative
Percent
Valid Not Diabetic 54 52.9 54.0 54.0
Has Diagnosis of
Diabetes(Type 1 or 2)
46 45.1 46.0 100.0
Total 100 98.0 100.0
Missing System 2 2.0
Total 102 100.0
Table 3.
95% confidence interval for BMI:
Descriptives
Statistic Std. Error
BMI Mean 27.82038003636
0937
.6092148638252
33
95% Confidence Interval for
Mean
Lower Bound 26.61156557640
0768
5

DESCRIPTIVE STATISTICS
Upper Bound 29.02919449632
1107
Theoretically, this can be verified by this following formula (Khan, Novak & Sottile, 2019).
CI =μ ± z∗s
√ ( n )
Where, CI = confidence interval
μ=¿mean BMI = 27.82
z = z score for 95% confidence = 1.96 (as obtained from standard normal table)
s=¿standard deviation of BMI = 6.09
n = effective sample size = 100
Hence, CI = 27.82 ± 1.96∗6.09
√ ( 100 ) = [26.63,29.01]
It can be seen that the calculated upper and lower bounds of confidence interval of mean is
approximately equal to the values of CI in the SPSS output table.
Conclusion:
Hence, in conclusion it can be stated that the descriptive statistics of health attributes of
the group of staff nurses of the large hospital are appropriately measured by using SPSS and 95%
confidence interval of BMI of the nurses is calculated in SPSS and verified theoretically. The
small error in theoretical calculation exists because of approximation of mean and standard
deviation. Thus with the given data it can be stated with 95% confidence that the average BMI of
all nurses in the hospital is in between 26.61 and 29.03.
6
⊘ This is a preview!⊘
Do you want full access?
Subscribe today to unlock all pages.

Trusted by 1+ million students worldwide

DESCRIPTIVE STATISTICS
References
George, D., & Mallery, P. (2016). Descriptive statistics. In IBM SPSS Statistics 23 Step by
Step (pp. 126-134). Routledge.
Khan, A. I., Novak, T., & Sottile, J. (2019). Assessment of Lognormally Distributed Respirable
Coal Dust Exposure via 95% Confidence Interval Calculation. International Journal of
Intelligent Technologies & Applied Statistics, 12(1).
7
1 out of 7
Related Documents

Your All-in-One AI-Powered Toolkit for Academic Success.
+13062052269
info@desklib.com
Available 24*7 on WhatsApp / Email
Unlock your academic potential
Copyright © 2020–2025 A2Z Services. All Rights Reserved. Developed and managed by ZUCOL.