Principles of Business Analytics BUS5PB Assignment 02 Report

Verified

Added on  2020/09/15

|20
|3478
|321
Report
AI Summary
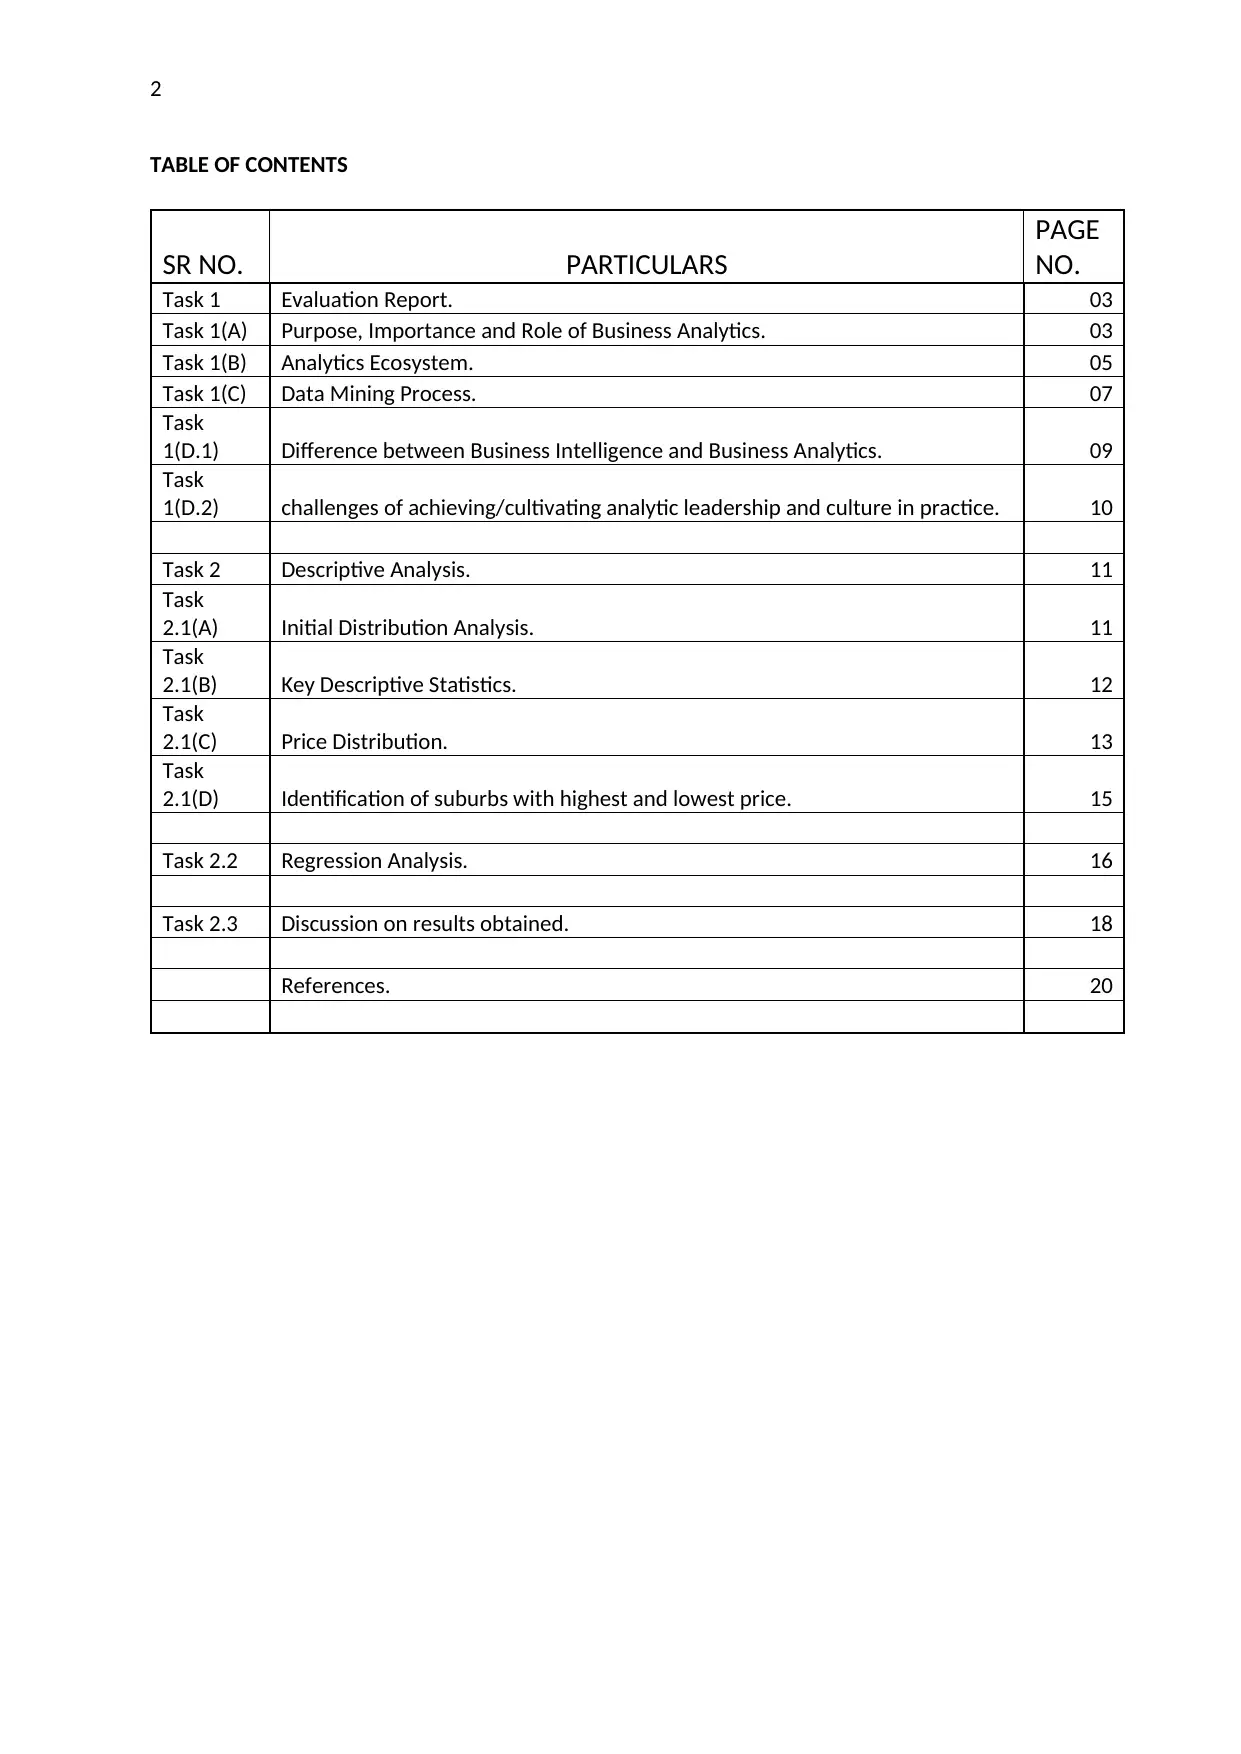
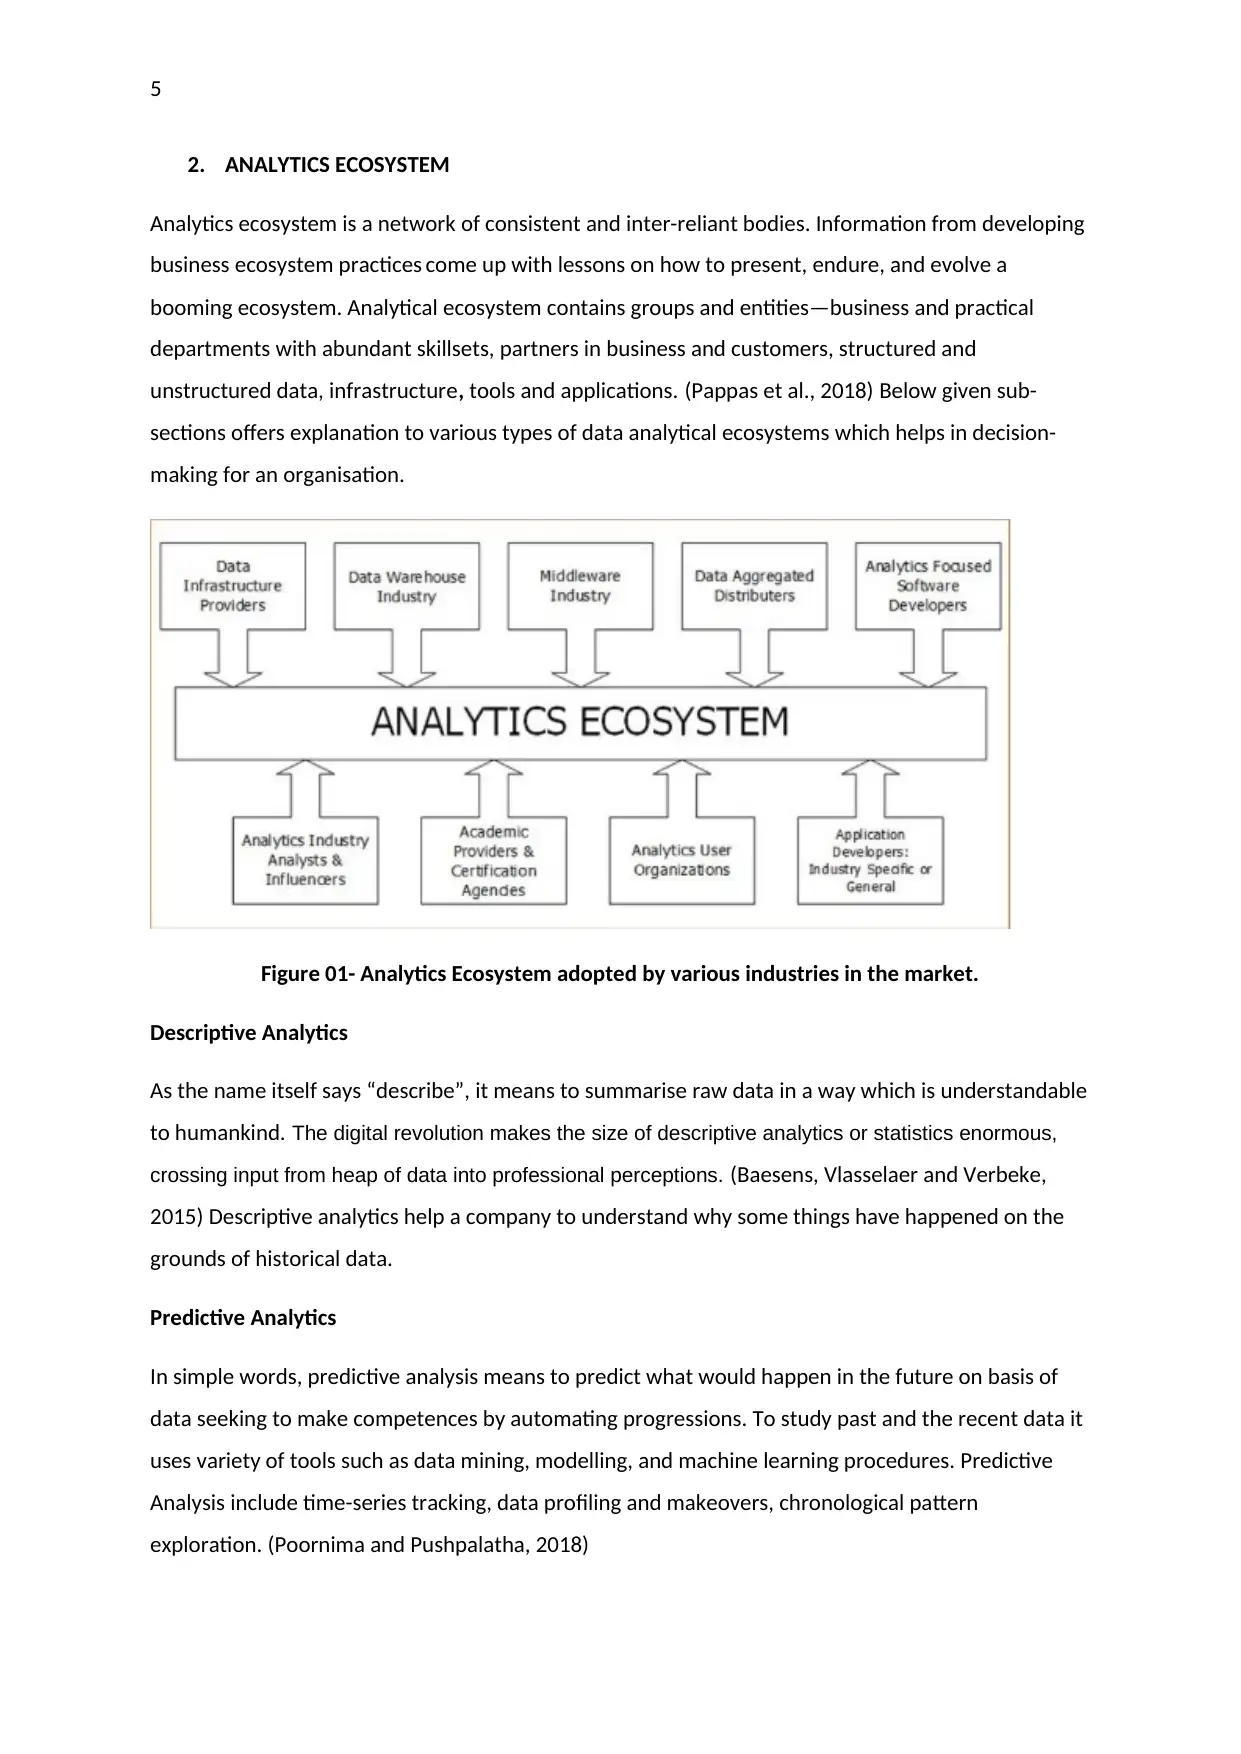
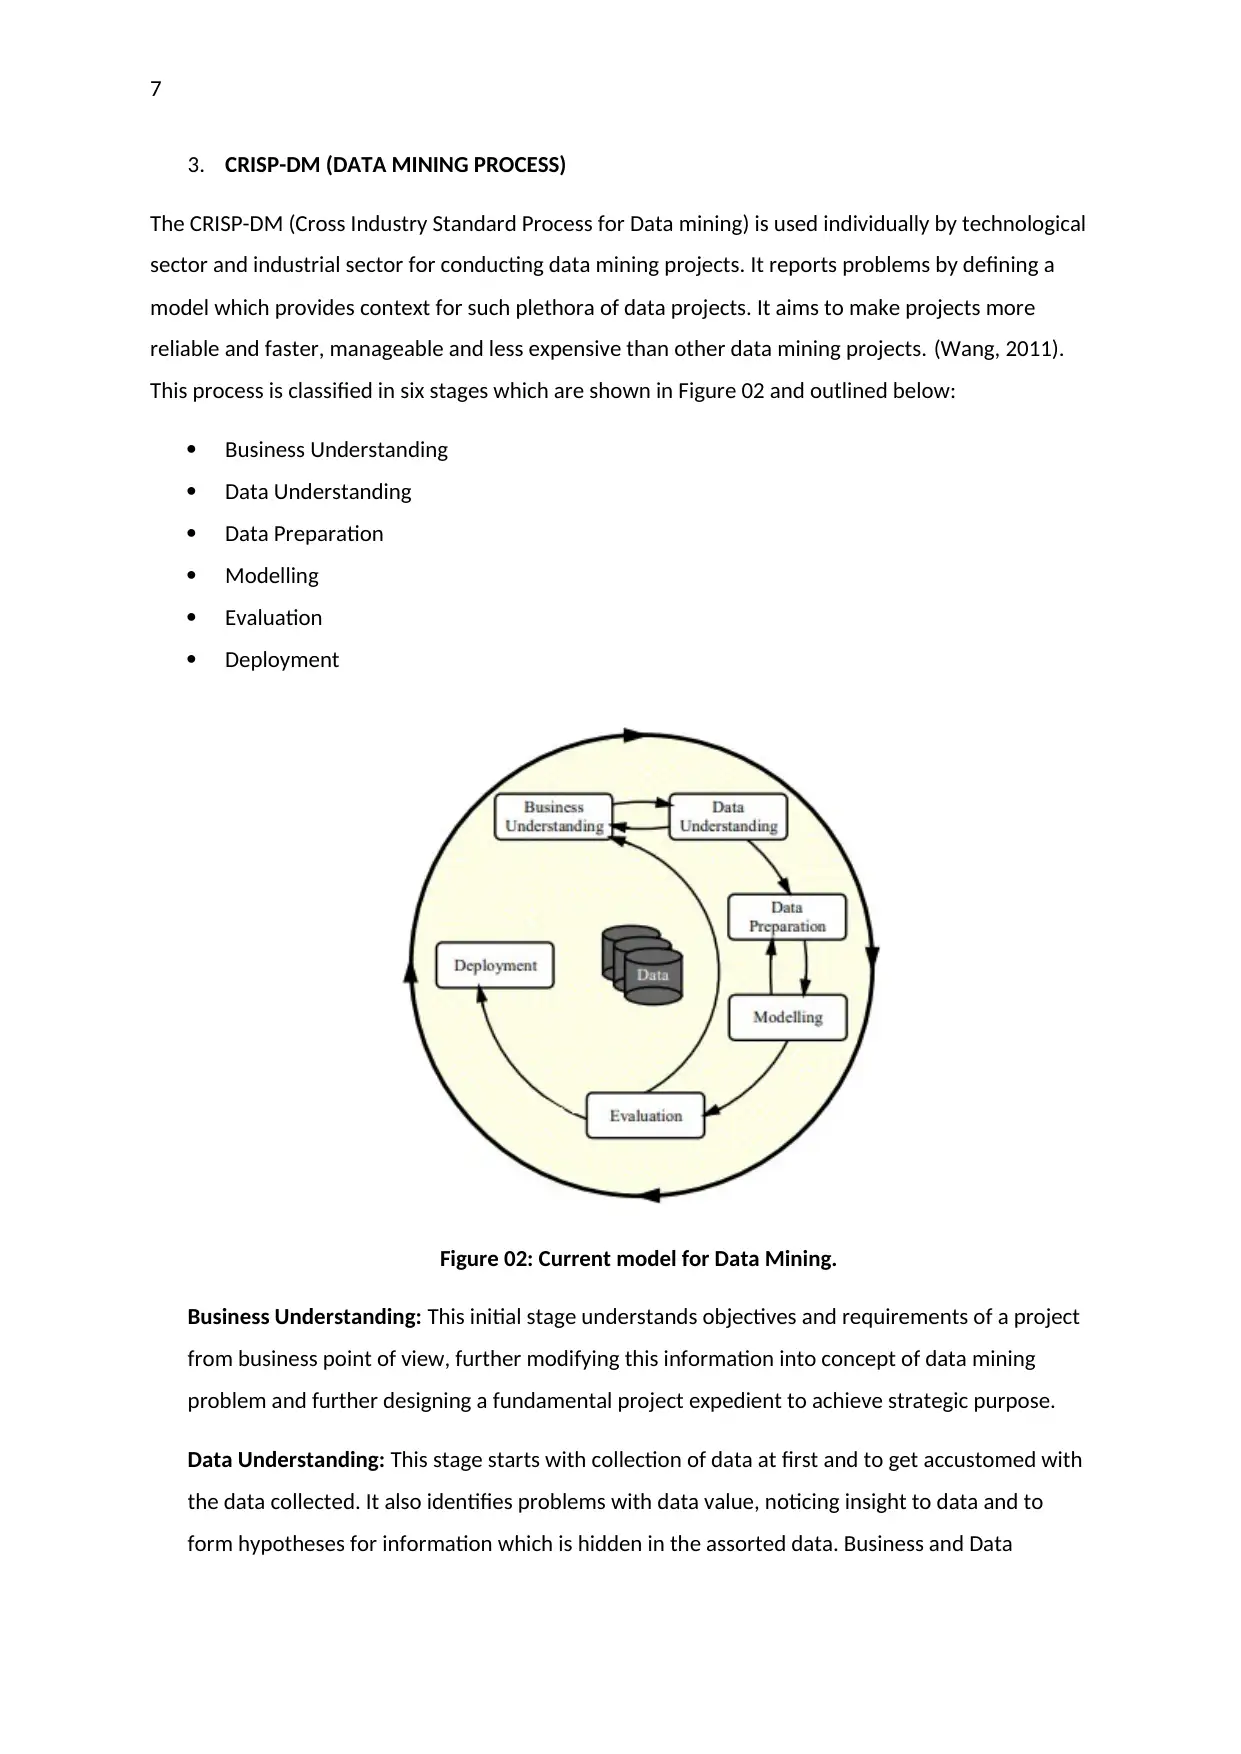
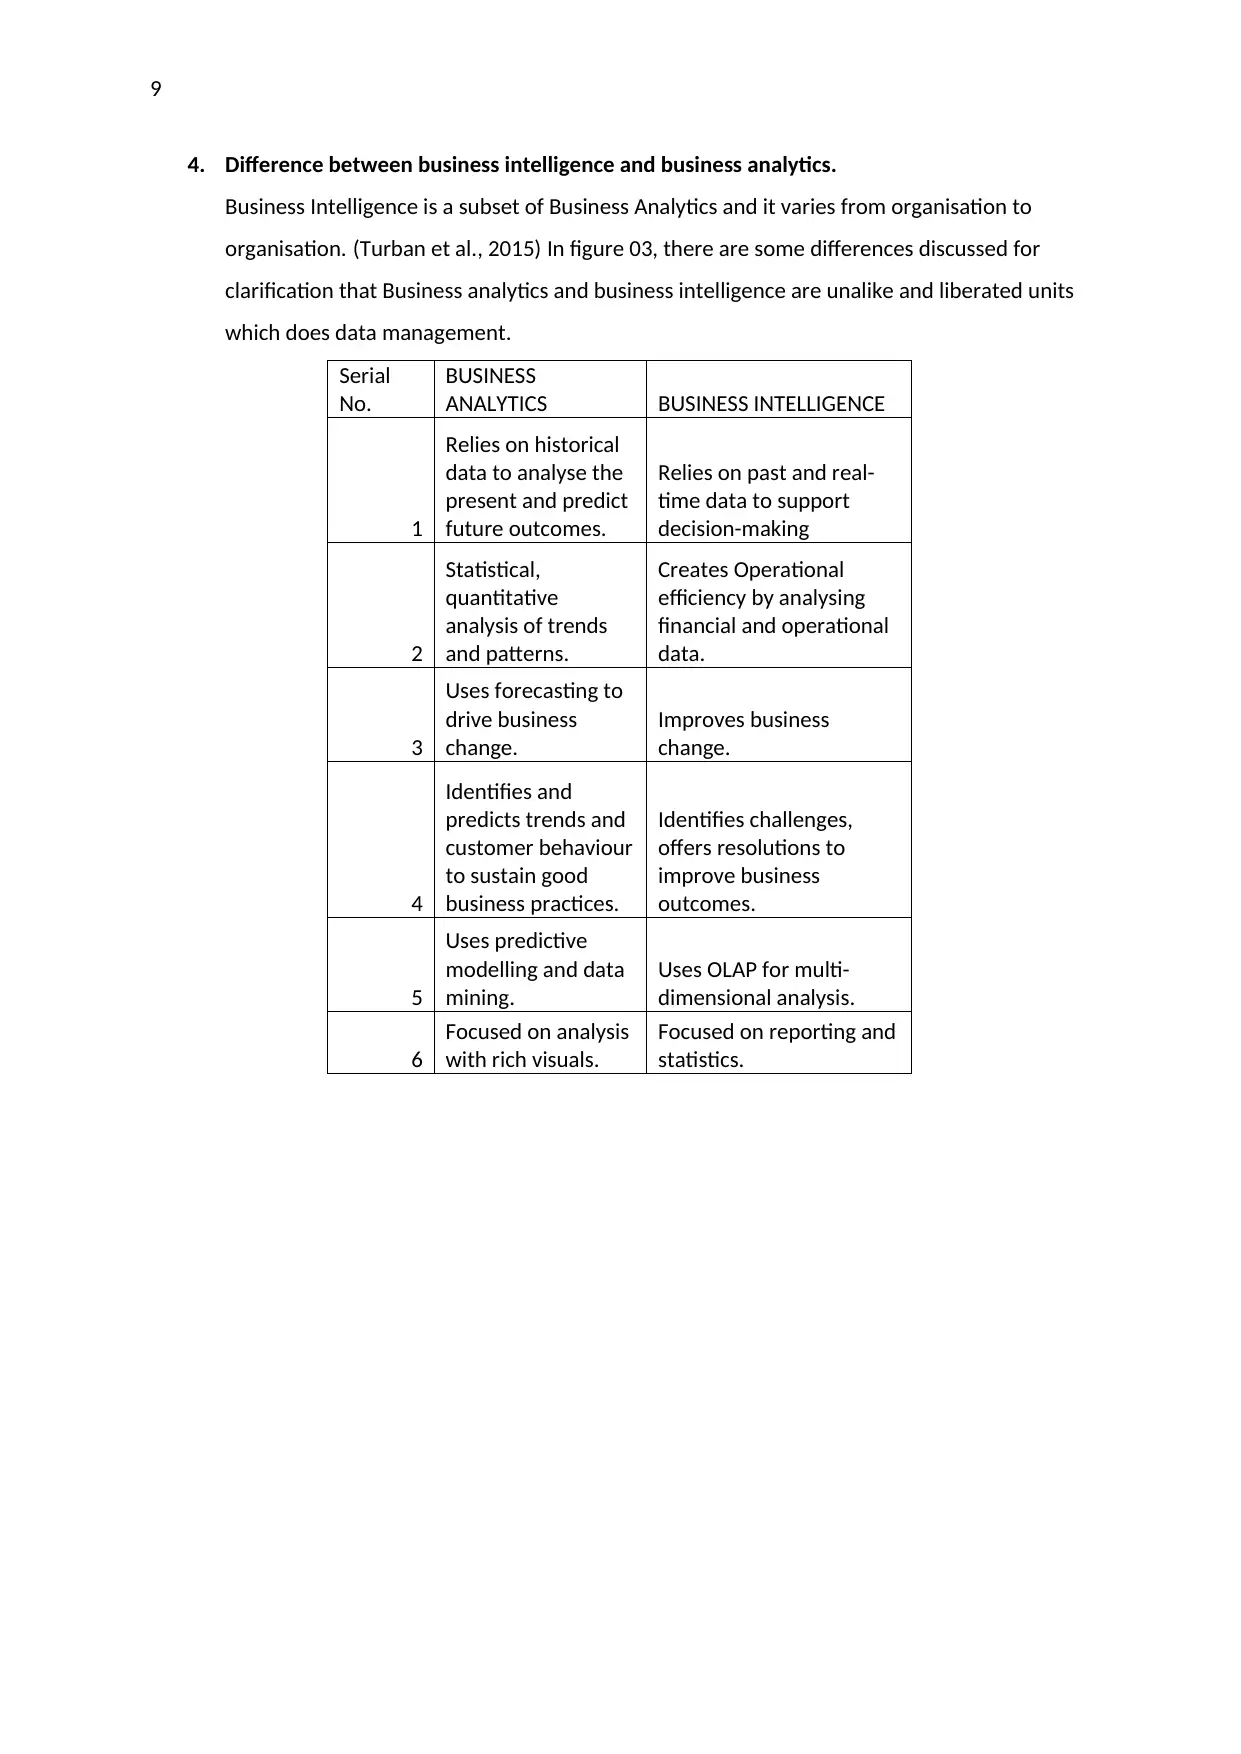
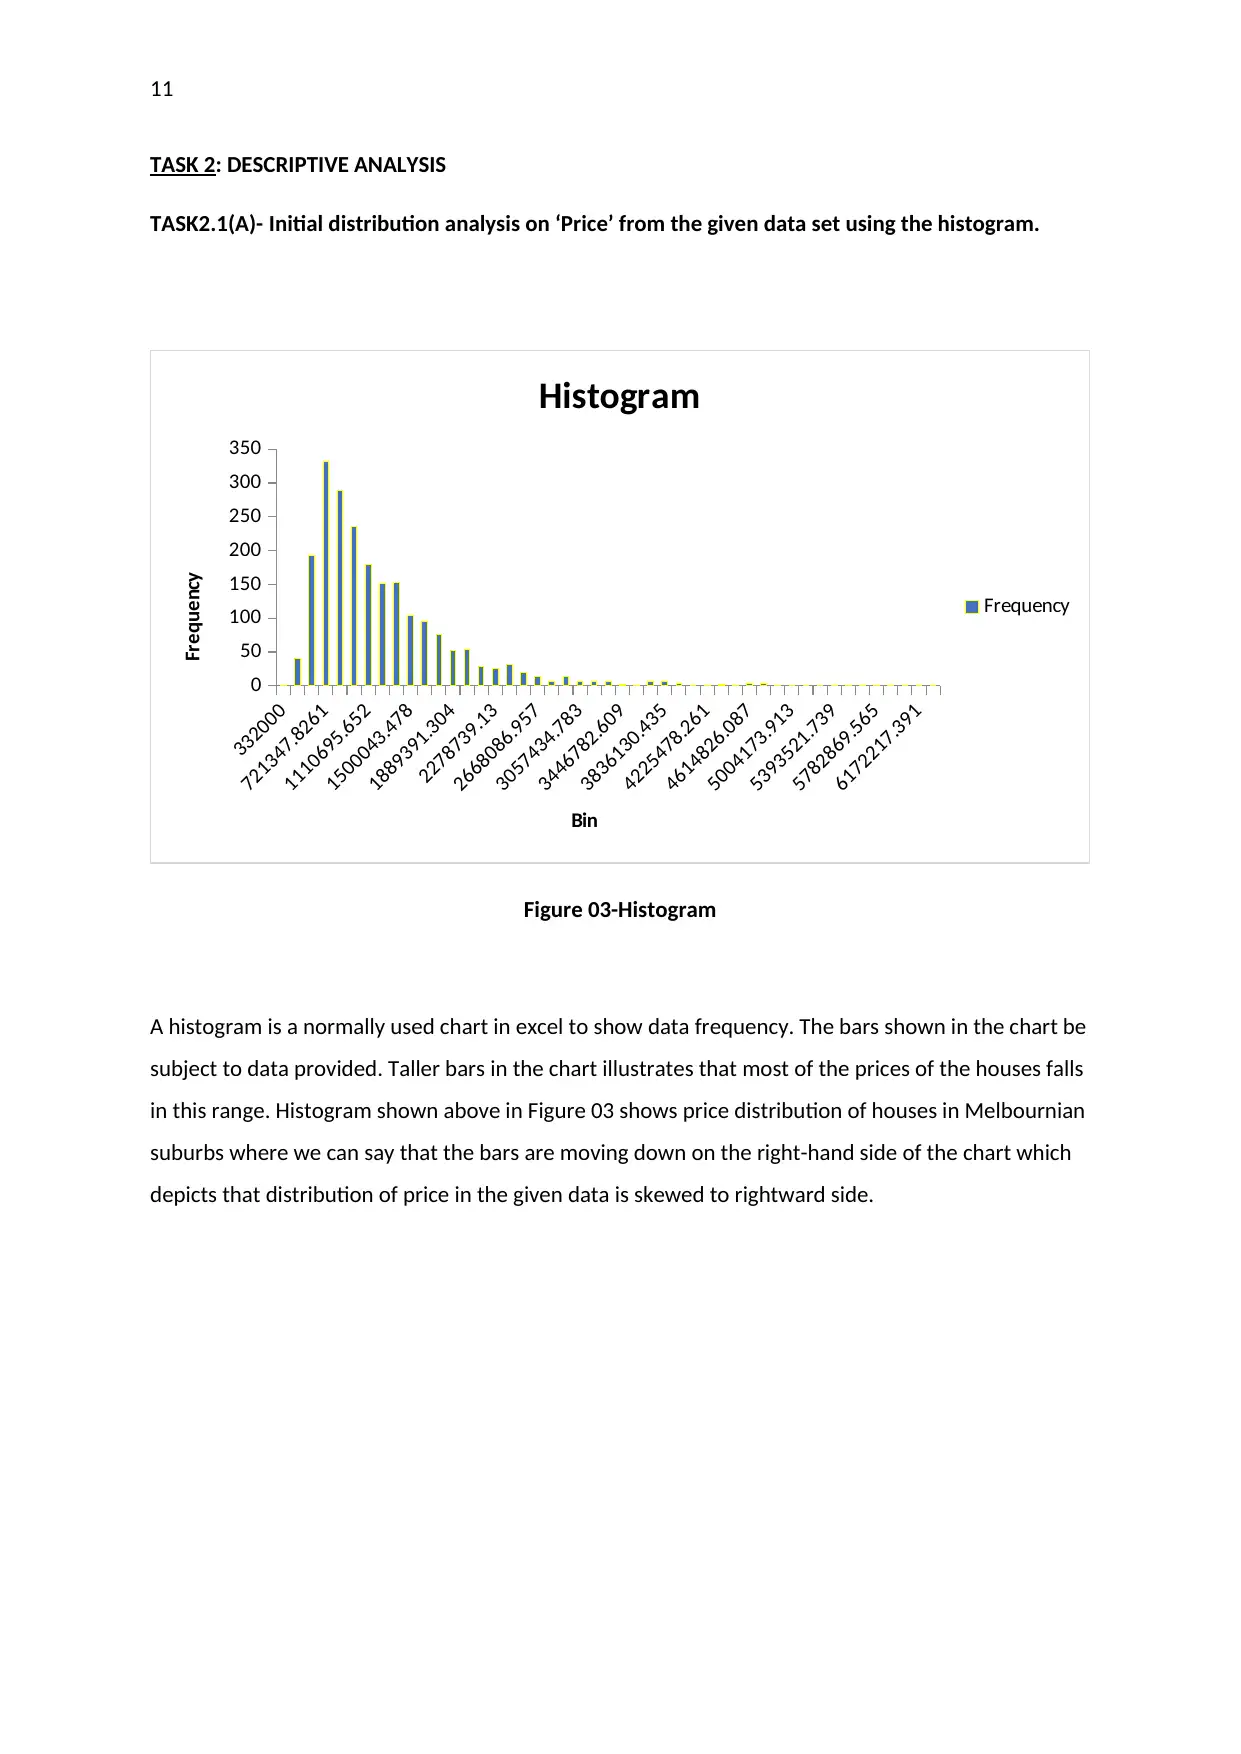
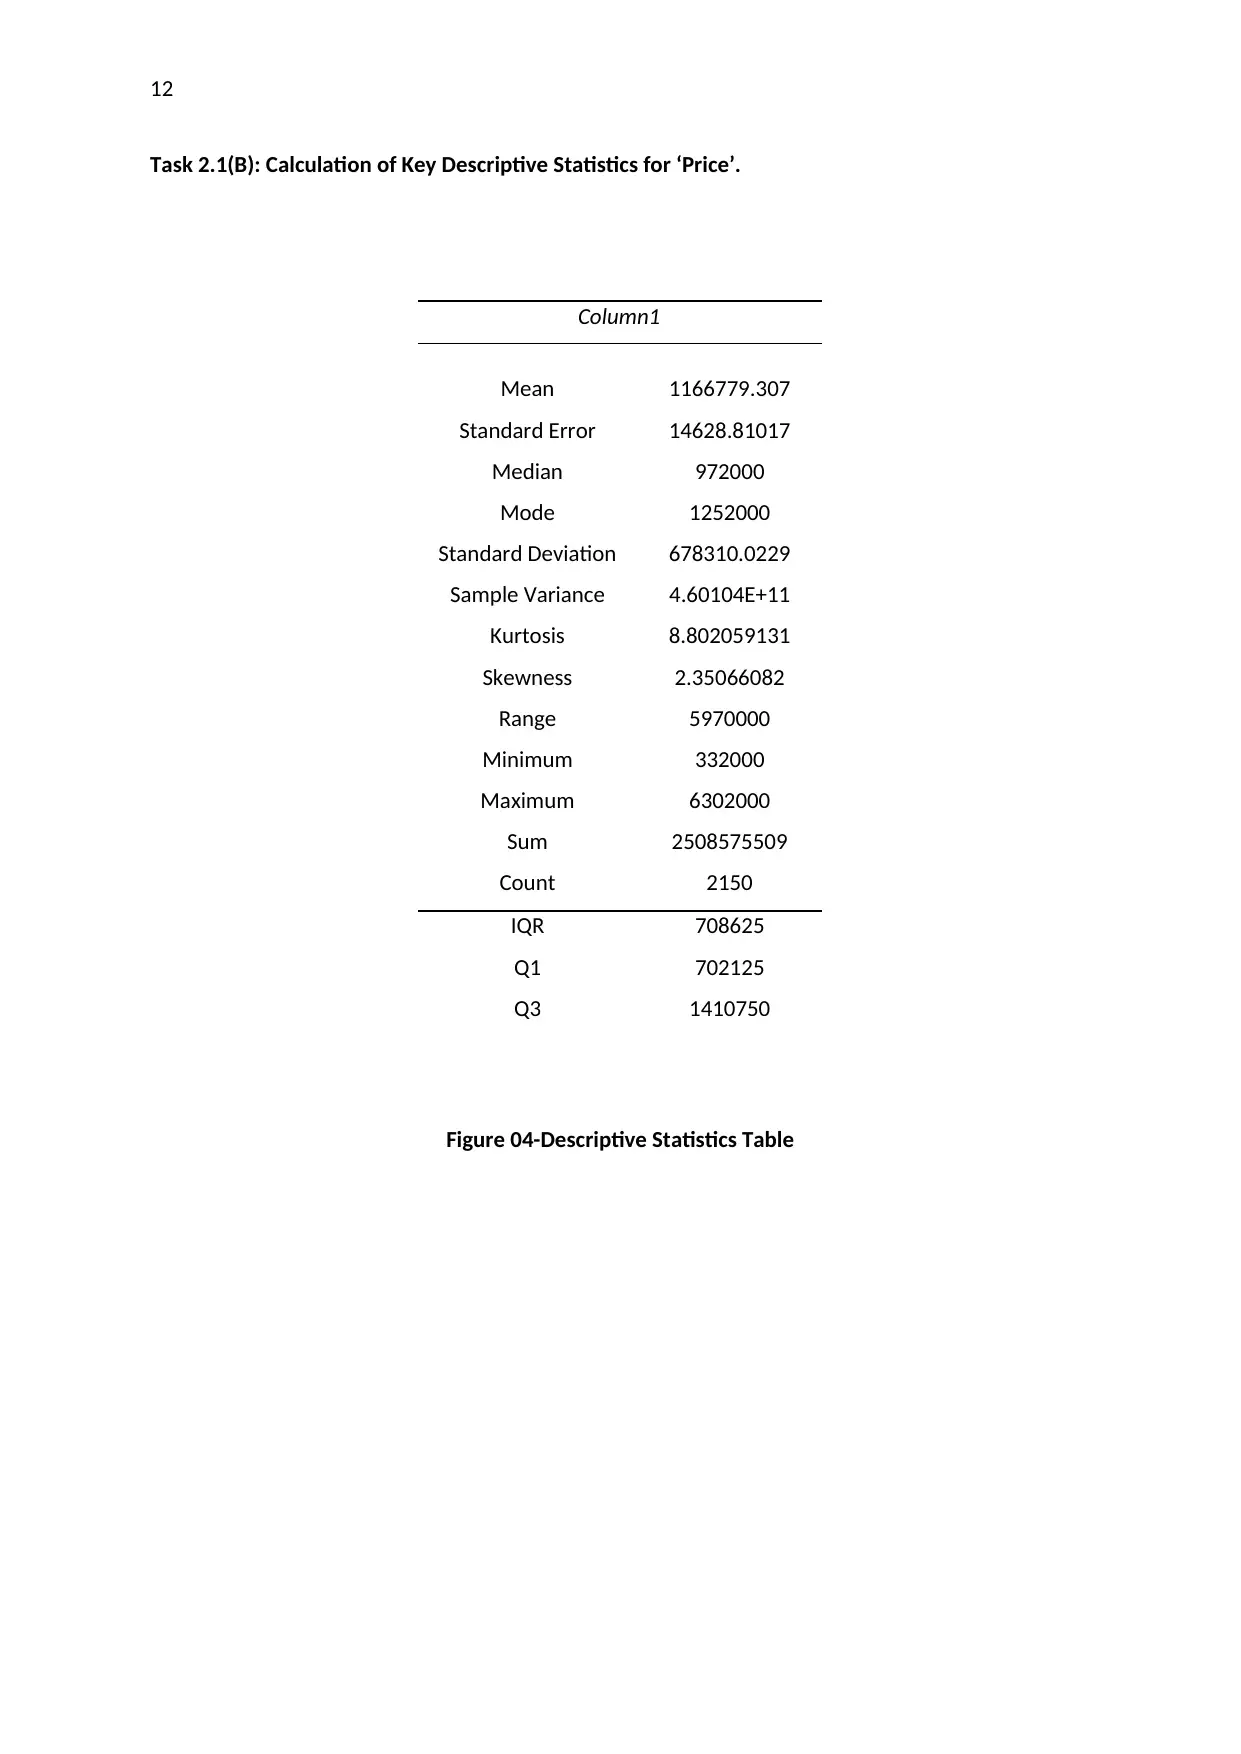
This report, a solution for BUS5PB Principles of Business Analytics Assignment 02, delves into descriptive analytics in a business context. It begins with an evaluation report, defining the purpose, importance, and role of business analytics in creating strategic value and competitive advantage, followed by an overview of the analytics ecosystem, including descriptive, predictive, prescriptive, and exploratory analytics. The report then explores the CRISP-DM (Cross-Industry Standard Process for Data Mining) process, outlining its six stages and addressing implementation challenges. A comparison between Business Intelligence and Business Analytics is presented, alongside the challenges of cultivating analytic leadership. Task 2 focuses on descriptive analysis, including initial distribution analysis using histograms, key descriptive statistics, price distribution comparisons between Eastern and Western Metropolitan suburbs using box plots, and identification of suburbs with highest and lowest prices. Finally, it includes a regression analysis and discussion of the results obtained.
Document Page
1
BUS5PB - Principles of Business Analytics
Assignment 02: Descriptive Analytics in Practice
tabler-icon-diamond-filled.svg

Paraphrase This Document

Need a fresh take? Get an instant paraphrase of this document with our AI Paraphraser
Document Page
2
TABLE OF CONTENTS
SR NO. PARTICULARS
PAGE
NO.
Task 1 Evaluation Report. 03
Task 1(A) Purpose, Importance and Role of Business Analytics. 03
Task 1(B) Analytics Ecosystem. 05
Task 1(C) Data Mining Process. 07
Task
1(D.1) Difference between Business Intelligence and Business Analytics. 09
Task
1(D.2) challenges of achieving/cultivating analytic leadership and culture in practice. 10
Task 2 Descriptive Analysis. 11
Task
2.1(A) Initial Distribution Analysis. 11
Task
2.1(B) Key Descriptive Statistics. 12
Task
2.1(C) Price Distribution. 13
Task
2.1(D) Identification of suburbs with highest and lowest price. 15
Task 2.2 Regression Analysis. 16
Task 2.3 Discussion on results obtained. 18
References. 20
Document Page
3
TASK 1: EVALUATION REPORT
INTRODUCTION
Data is one of the indispensable aspects for every business to conduct major reforms in the
organization. Data can be visualised in various ways such as images, texts, media, graphs, charts, etc.
Understanding the data is vital where data analytics comes into play to manipulate data and derive
with results and information for the business understanding. Business analytics is one of the various
subjects under data analytics where it classifies several characters of business strategies, supplying,
executing and delivering business analytics based viable activities in creating strategic value and
competitive advantage.
Task 1.1
1. Purpose, Importance and Role of business analytics in creating strategic value and
competitive advantage.
Purpose of Business Analytics
Business Analytics comprises information and knowledge attained through analysis of data provided
and employing that information to fabricate new valuable strategies and creating modest leadership
in the economical market. The main purpose of business analytics is to connect two distant dots of
management and IT together at one place. It comprehends range of analysis around data to lure
information which could be used at various stages of organisation.
Importance of Business Analytics
Business Analytics imitates functioning of an organisation because it is a tool used to make thorough
decisions. It provides competitive advantage to an organisation by utilising the data in an efficient
way because in this digital era information is nearly the same which flows but exploiting significantly
gives advantage. It eases understanding of secondary and primary data which affects the
functioning activities in the organization. It also alters available data into worthful information which
makes it useful for concluding future strategies. It is important for making strategic investments for
many businesses and organisations. (Someh, Shanks and Davern, 2019). Global Tech LED Co. used
google analytics instant activation for remarketing where analytics automatically identified LED
prospects for target products. (Faggella, 2019)
Role of Business Analytics
Document Page
4
Business Analytics have become eminent tool for advancement, growth and clarity in conducting
business activities. Enormous amount of structured and unstructured data is being generated daily
which is dealt by analytical tools which turns them valuable. Due to Technological Expansion,
companies will be outlined and vigilant and will use Business analytics for Accuracy of data. Business
Analytics generates belief through sheerness and evangelism. (Stubbs, 2013)
tabler-icon-diamond-filled.svg

Paraphrase This Document

Need a fresh take? Get an instant paraphrase of this document with our AI Paraphraser
Document Page
5
2. ANALYTICS ECOSYSTEM
Analytics ecosystem is a network of consistent and inter-reliant bodies. Information from developing
business ecosystem practices come up with lessons on how to present, endure, and evolve a
booming ecosystem. Analytical ecosystem contains groups and entities—business and practical
departments with abundant skillsets, partners in business and customers, structured and
unstructured data, infrastructure, tools and applications. (Pappas et al., 2018) Below given sub-
sections offers explanation to various types of data analytical ecosystems which helps in decision-
making for an organisation.
Figure 01- Analytics Ecosystem adopted by various industries in the market.
Descriptive Analytics
As the name itself says “describe”, it means to summarise raw data in a way which is understandable
to humankind. The digital revolution makes the size of descriptive analytics or statistics enormous,
crossing input from heap of data into professional perceptions. (Baesens, Vlasselaer and Verbeke,
2015) Descriptive analytics help a company to understand why some things have happened on the
grounds of historical data.
Predictive Analytics
In simple words, predictive analysis means to predict what would happen in the future on basis of
data seeking to make competences by automating progressions. To study past and the recent data it
uses variety of tools such as data mining, modelling, and machine learning procedures. Predictive
Analysis include time-series tracking, data profiling and makeovers, chronological pattern
exploration. (Poornima and Pushpalatha, 2018)
Document Page
6
Prescriptive Analytics
Prescriptive analytics seeks at proposing decisive options in order to take full advantage of the future
projected from the data. It is one of the enlightened forms of business analytics which brings value
proposition to the business. (Lepenioti et al., 2019) Based on results of predictive analytics,
prescriptive effectuate bold decisions for the company.
Exploratory Analytics
A process which is directed towards exploring a scenario to identify anomalies is considered as
Exploratory data analysis. Apart from identifying anomalies it also discovers the patterns for testing
hypothesis, it examines assumptions as well, and making transformations to the system. It tells us
about the data beyond the statistical modelling, assumptions and testing of hypothesis.
Document Page
7
3. CRISP-DM (DATA MINING PROCESS)
The CRISP-DM (Cross Industry Standard Process for Data mining) is used individually by technological
sector and industrial sector for conducting data mining projects. It reports problems by defining a
model which provides context for such plethora of data projects. It aims to make projects more
reliable and faster, manageable and less expensive than other data mining projects. (Wang, 2011).
This process is classified in six stages which are shown in Figure 02 and outlined below:
Business Understanding
Data Understanding
Data Preparation
Modelling
Evaluation
Deployment
Figure 02: Current model for Data Mining.
Business Understanding: This initial stage understands objectives and requirements of a project
from business point of view, further modifying this information into concept of data mining
problem and further designing a fundamental project expedient to achieve strategic purpose.
Data Understanding: This stage starts with collection of data at first and to get accustomed with
the data collected. It also identifies problems with data value, noticing insight to data and to
form hypotheses for information which is hidden in the assorted data. Business and Data
tabler-icon-diamond-filled.svg

Paraphrase This Document

Need a fresh take? Get an instant paraphrase of this document with our AI Paraphraser
Document Page
8
understanding are both linked to each other and before formulating the problem or the project
plan it is required to have a little understanding of the data.
Data Preparation: It includes data collection, data pre-processing and data transformation. It
comprises of all sources of information and nominating well-suited subset of data for data-
mining application. It also includes studying of data quality and identifying the data mining
process which will be worthful if enforced. After Pre-processing, the data is transformed into
analytical model for operational sources. (Osei-Bryson and Barclay, 2015)
Modelling: There is a close relationship between Preparation of Data and Modelling because its
quite often that one gets idea to frame new data or one identifies problems while constructing a
model. In this stage various techniques of modelling are applied, and their constraints are
rectified to optimum values for same data mining process.
Evaluation: Before moving to the last stage of unfolding the model, it is necessary to evaluate
the model and review the stages executed for modelling the plan and be assured about the
business objectives required to be achieved. It is necessary to uncover if some business issue has
not been considered adequately.
Deployment: Deployment stage can be as simple as creating a report or it can even be
multifaceted as instigating a DM process, but it basically depends on the requirements. Creating
a model and deploying it is generally not considered as end stage. It depends on how customer
uses the knowledge which is organized and presented clearly.
CHALLENGES IN IMPLEMENTATION OF CRISP-DM:
This process of data mining process is an exceptional schema to derive real value of a business, but
many projects are using shortcut methods which are using CRISP-DM. There are various challenges
in implementing data mining process, some of them are:
Thoughtless rework on process.
Lack of clarity in relation to business needs.
Blind send-off to Information Technology.
Unsuccessful to Reiterate.
Failure in quality assurance.
Lack of accurate resources in CRISP-DM applications.
Document Page
9
4. Difference between business intelligence and business analytics.
Business Intelligence is a subset of Business Analytics and it varies from organisation to
organisation. (Turban et al., 2015) In figure 03, there are some differences discussed for
clarification that Business analytics and business intelligence are unalike and liberated units
which does data management.
Serial
No.
BUSINESS
ANALYTICS BUSINESS INTELLIGENCE
1
Relies on historical
data to analyse the
present and predict
future outcomes.
Relies on past and real-
time data to support
decision-making
2
Statistical,
quantitative
analysis of trends
and patterns.
Creates Operational
efficiency by analysing
financial and operational
data.
3
Uses forecasting to
drive business
change.
Improves business
change.
4
Identifies and
predicts trends and
customer behaviour
to sustain good
business practices.
Identifies challenges,
offers resolutions to
improve business
outcomes.
5
Uses predictive
modelling and data
mining.
Uses OLAP for multi-
dimensional analysis.
6
Focused on analysis
with rich visuals.
Focused on reporting and
statistics.
Document Page
10
5. Challenges of achieving/cultivating analytic leadership and culture in practice.
Business Analytical Technologies necessitates a leader who can influence a team and
behaviour of persons in the direction of the accomplishment of distinct purposes. Not
Surprisingly, there are various challenges faced by them on every stage. They are as follows:
Authorization is not anarchism. (Leadership in the Digital Era: Social Media, Big
Data, Virtual Reality, Computational Methods, and Deep Learning, 2019)
Organisational transformation requires a lot more than just changing structure of it.
Speediness matters to get analytical technologies into work.
Driving outcomes of business
Achieving Business Goals and accomplishments.
tabler-icon-diamond-filled.svg

Paraphrase This Document

Need a fresh take? Get an instant paraphrase of this document with our AI Paraphraser
Document Page
11
TASK 2: DESCRIPTIVE ANALYSIS
TASK2.1(A)- Initial distribution analysis on ‘Price’ from the given data set using the histogram.
332000
721347.8261
1110695.652
1500043.478
1889391.304
2278739.13
2668086.957
3057434.783
3446782.609
3836130.435
4225478.261
4614826.087
5004173.913
5393521.739
5782869.565
6172217.391
0
50
100
150
200
250
300
350
Histogram
Frequency
Bin
Frequency
Figure 03-Histogram
A histogram is a normally used chart in excel to show data frequency. The bars shown in the chart be
subject to data provided. Taller bars in the chart illustrates that most of the prices of the houses falls
in this range. Histogram shown above in Figure 03 shows price distribution of houses in Melbournian
suburbs where we can say that the bars are moving down on the right-hand side of the chart which
depicts that distribution of price in the given data is skewed to rightward side.
Document Page
12
Task 2.1(B): Calculation of Key Descriptive Statistics for ‘Price’.
Column1
Mean 1166779.307
Standard Error 14628.81017
Median 972000
Mode 1252000
Standard Deviation 678310.0229
Sample Variance 4.60104E+11
Kurtosis 8.802059131
Skewness 2.35066082
Range 5970000
Minimum 332000
Maximum 6302000
Sum 2508575509
Count 2150
IQR 708625
Q1 702125
Q3 1410750
Figure 04-Descriptive Statistics Table
chevron_up_icon
1 out of 20
circle_padding
hide_on_mobile
zoom_out_icon
[object Object]