Descriptive Analytics & Visualization: Claim Data Analysis Report
VerifiedAdded on 2023/06/14
|18
|2866
|189
Report
AI Summary
This report provides a comprehensive analysis of claims data, focusing on descriptive analytics and visualization techniques. It includes an overview of claimant amounts, a profile of a typical claimant, a comparison of current year claims to industry standards, and an examination of the relationship between medical practitioner specialization, claim severity, and average claim amounts. The analysis, conducted using Microsoft Excel, reveals an average claim payment of $73,458, with most claims falling between $51,547 and $101,547. A typical claimant is around 45 years old, with varying insurance types and risk levels. Hypothesis testing validates some industry beliefs, such as lower average claim payments compared to $77,500, while challenging others, such as differences in claim severity between genders. The report also explores the impact of private attorneys and the specialization of medical practitioners on claim severity and payment amounts.
Running head: DESCRIPTIVE ANALYTICS AND VISUALIZATION ASSIGNMENT
Descriptive analytics and visualization assignment
Name of Student
Name of University
Author Name
Descriptive analytics and visualization assignment
Name of Student
Name of University
Author Name
Paraphrase This Document
Need a fresh take? Get an instant paraphrase of this document with our AI Paraphraser
1DESCRIPTIVE ANALYTICS AND VISUALIZATION ASSIGNMENT
Table of Contents
Introduction......................................................................................................................................2
Discussion........................................................................................................................................2
Question 2....................................................................................................................................3
Question 3.1.................................................................................................................................4
Question 3.2.................................................................................................................................4
Question 3.3.................................................................................................................................4
Question 3.4.................................................................................................................................5
Question 3.5.................................................................................................................................5
Question 4.1.................................................................................................................................6
Question 4.2.................................................................................................................................6
Conclusion.......................................................................................................................................6
Appendix..........................................................................................................................................8
2DESCRIPTIVE ANALYTICS AND VISUALIZATION ASSIGNMENT
Introduction
Ever since third party data being made more accessible, insurance firms have been able to devise
ways to acquire more insights regarding claimants and medical practitioners to better understand
the risks that come with malpractice. Analytics has been able to utilise the information made
available by government and other third party sources to deliver such insights to the firms.
This report provides a set of such insights as requested by one Mr. Edmond. The areas of
discussion as requested, include an overall summarization of claimant amounts, profile of a
typical claimant, a comparison of the current year’s claims with respect to the industry’s
standards and the relationship between the specialization of the medical practitioner, how severe
the claim is, and the average claim amounts. The analysis has been carried out using Microsoft
Excel using statistical tools and theory to provide evidence based results.
Discussion
The available data of this year’s claimants with regard to some of the details of their
claims was analysed and used to gain insights as relevant to question regarding the claims
payment amount and a typical claimant’s profile. Additionally this year’s claims with respect to
the standards set in the industry has also been addressed. Moreover, relationship of the speciality
of the medical practitioner treating the patient to whom the claim belongs with the severity of the
claims, gender, attorney and paid amount have also been analysed and highlighted. The
following sections address these various aspects shedding light upon these areas as it had been
requested. Question 1
It was found that there has been an estimated average of $73458 claim payments this
year. A maximum of $228725 worth claim payment amount and a minimum of $1547 was
⊘ This is a preview!⊘
Do you want full access?
Subscribe today to unlock all pages.
Trusted by 1+ million students worldwide
3DESCRIPTIVE ANALYTICS AND VISUALIZATION ASSIGNMENT
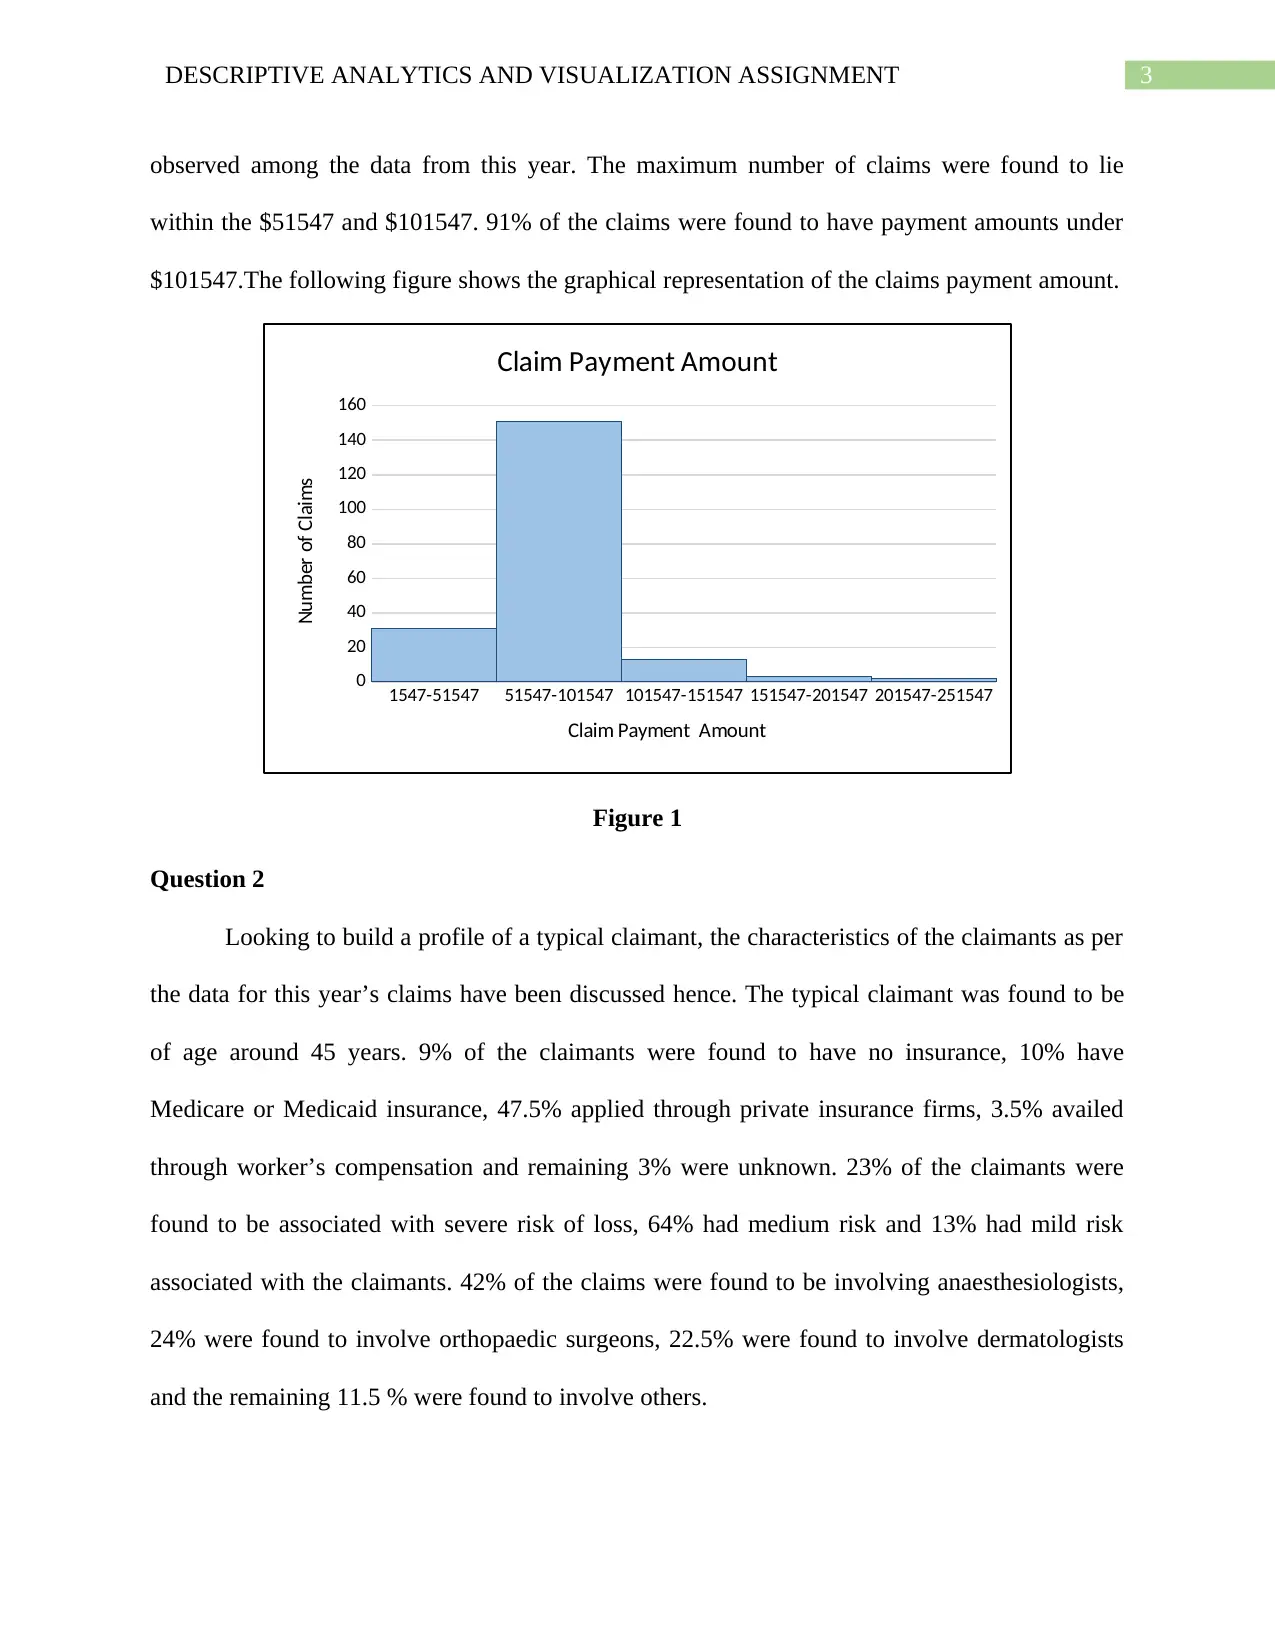
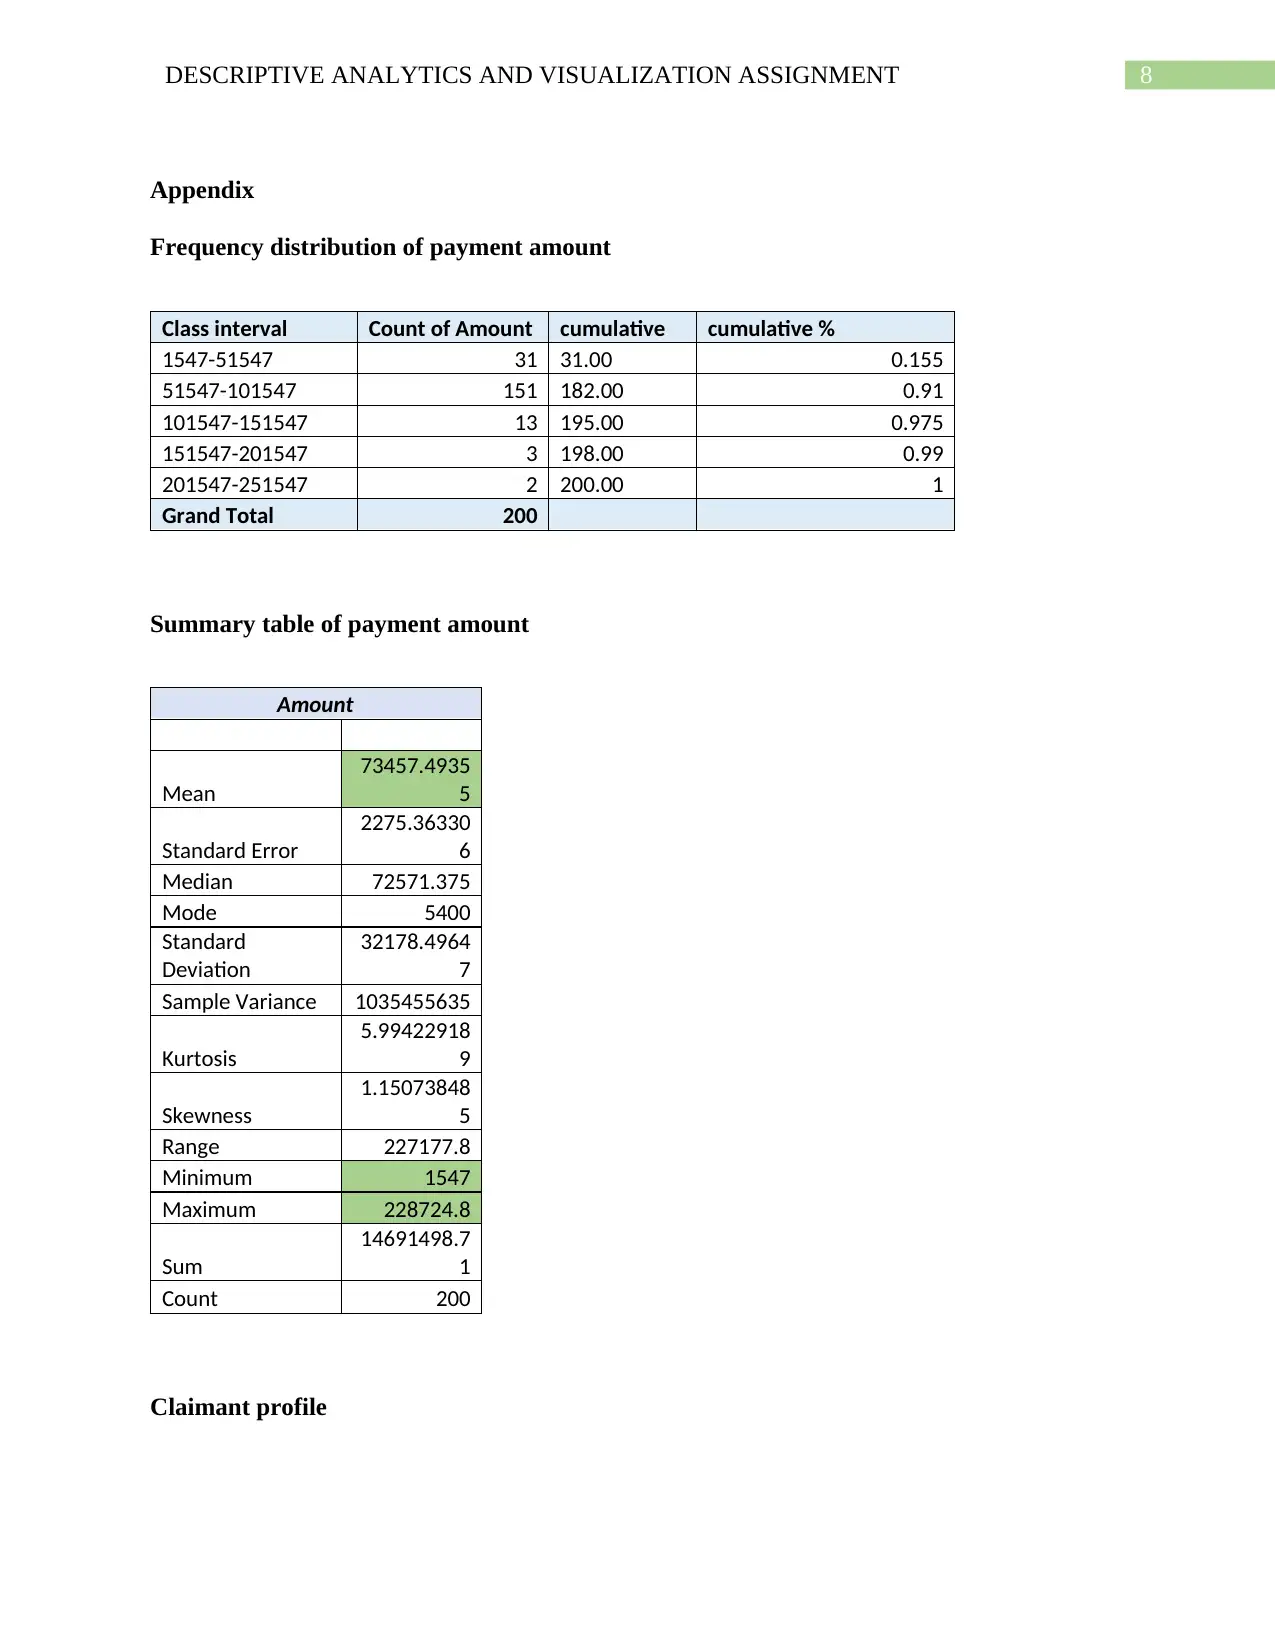
observed among the data from this year. The maximum number of claims were found to lie
within the $51547 and $101547. 91% of the claims were found to have payment amounts under
$101547.The following figure shows the graphical representation of the claims payment amount.
1547-51547 51547-101547 101547-151547 151547-201547 201547-251547
0
20
40
60
80
100
120
140
160
Claim Payment Amount
Claim Payment Amount
Number of Claims
Figure 1
Question 2
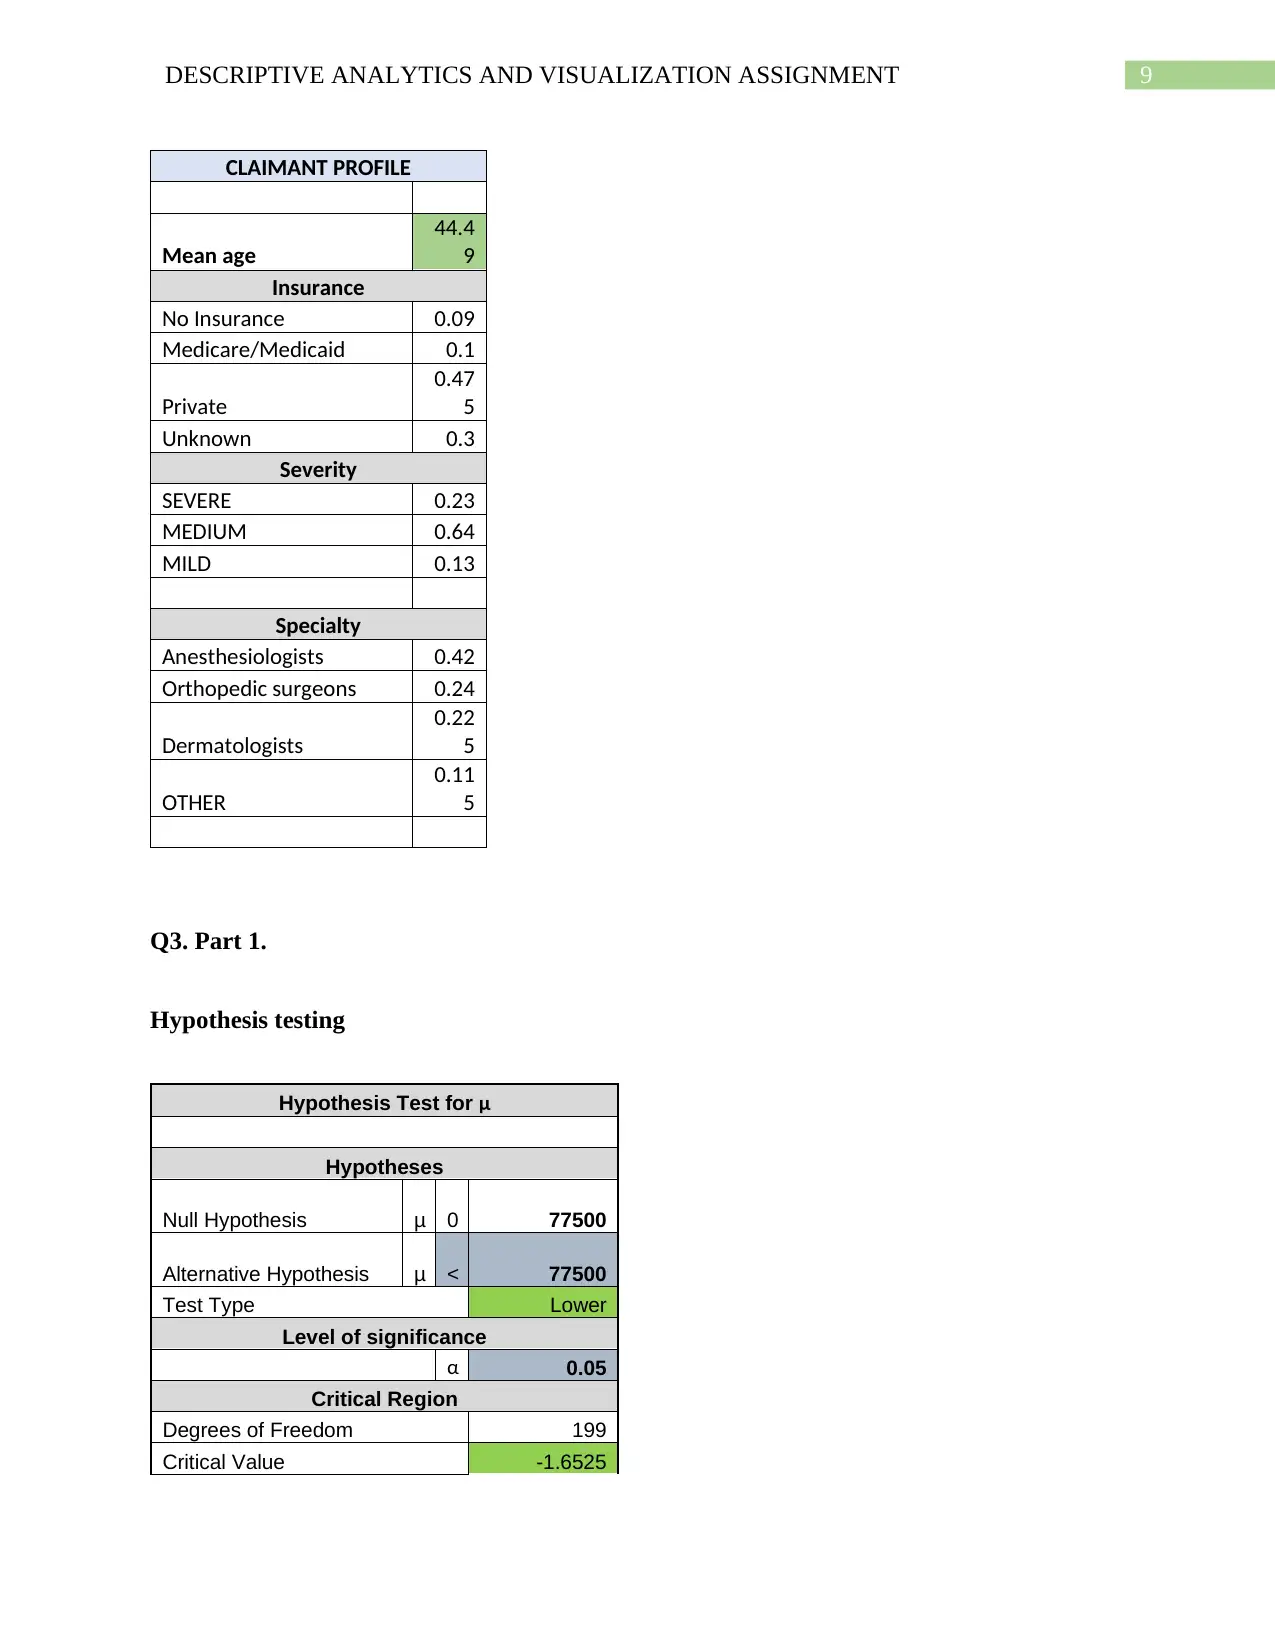
Looking to build a profile of a typical claimant, the characteristics of the claimants as per
the data for this year’s claims have been discussed hence. The typical claimant was found to be
of age around 45 years. 9% of the claimants were found to have no insurance, 10% have
Medicare or Medicaid insurance, 47.5% applied through private insurance firms, 3.5% availed
through worker’s compensation and remaining 3% were unknown. 23% of the claimants were
found to be associated with severe risk of loss, 64% had medium risk and 13% had mild risk
associated with the claimants. 42% of the claims were found to be involving anaesthesiologists,
24% were found to involve orthopaedic surgeons, 22.5% were found to involve dermatologists
and the remaining 11.5 % were found to involve others.
observed among the data from this year. The maximum number of claims were found to lie
within the $51547 and $101547. 91% of the claims were found to have payment amounts under
$101547.The following figure shows the graphical representation of the claims payment amount.
1547-51547 51547-101547 101547-151547 151547-201547 201547-251547
0
20
40
60
80
100
120
140
160
Claim Payment Amount
Claim Payment Amount
Number of Claims
Figure 1
Question 2
Looking to build a profile of a typical claimant, the characteristics of the claimants as per
the data for this year’s claims have been discussed hence. The typical claimant was found to be
of age around 45 years. 9% of the claimants were found to have no insurance, 10% have
Medicare or Medicaid insurance, 47.5% applied through private insurance firms, 3.5% availed
through worker’s compensation and remaining 3% were unknown. 23% of the claimants were
found to be associated with severe risk of loss, 64% had medium risk and 13% had mild risk
associated with the claimants. 42% of the claims were found to be involving anaesthesiologists,
24% were found to involve orthopaedic surgeons, 22.5% were found to involve dermatologists
and the remaining 11.5 % were found to involve others.
Paraphrase This Document
Need a fresh take? Get an instant paraphrase of this document with our AI Paraphraser
4DESCRIPTIVE ANALYTICS AND VISUALIZATION ASSIGNMENT
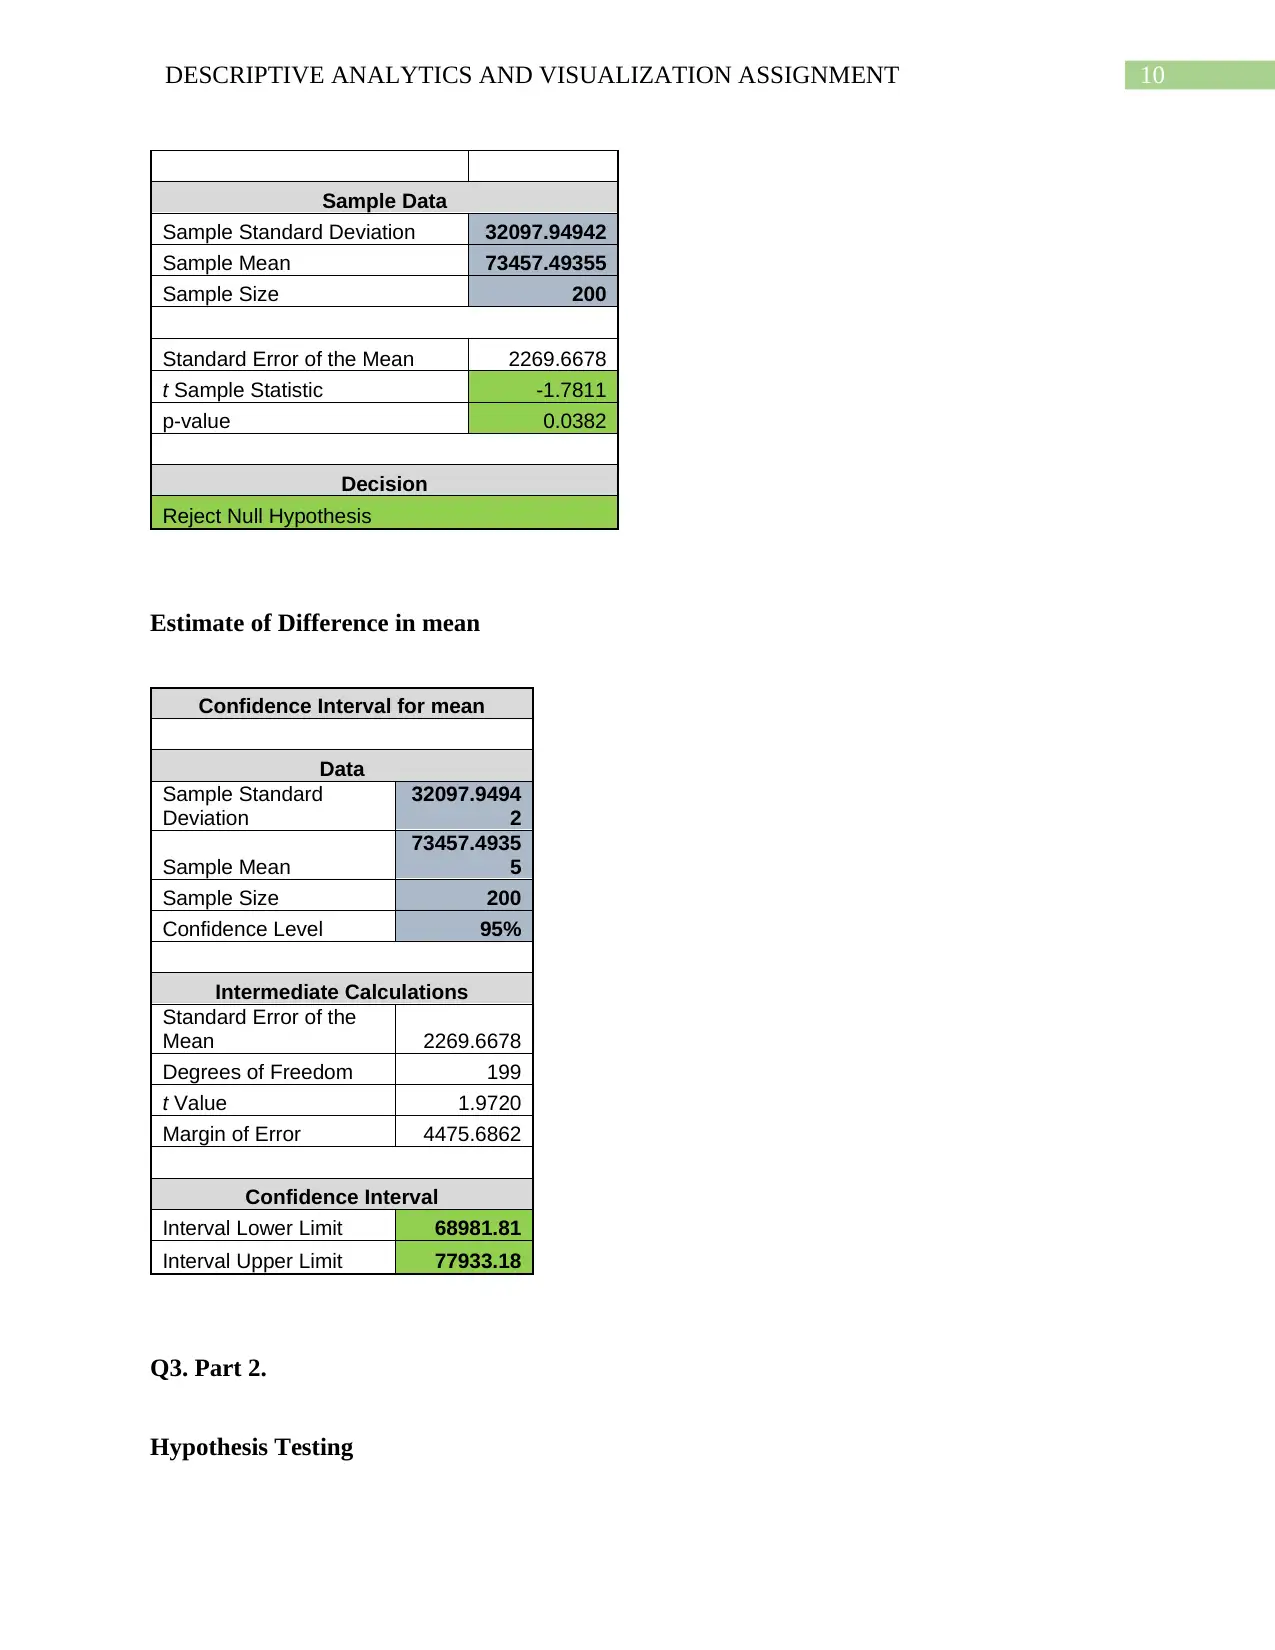
Question 3.1
An industry report said that the average amount of claim payments had dropped at a level
lower than $77,500. The validity of this statement by the study report, was scrutinized and tested
using the available information on average of the claim payment amount. Thereby, it was found
that there is sufficient evidence against the conjecture that average claim payment amount is
greater than or equal to the value $77,500 and hence it was concluded that the statement by the
report regarding average claims payment amount is indeed so. However there is a 5% that the
statement that the average amount of claim payments had dropped at a level lower than $77,500
might be untrue.
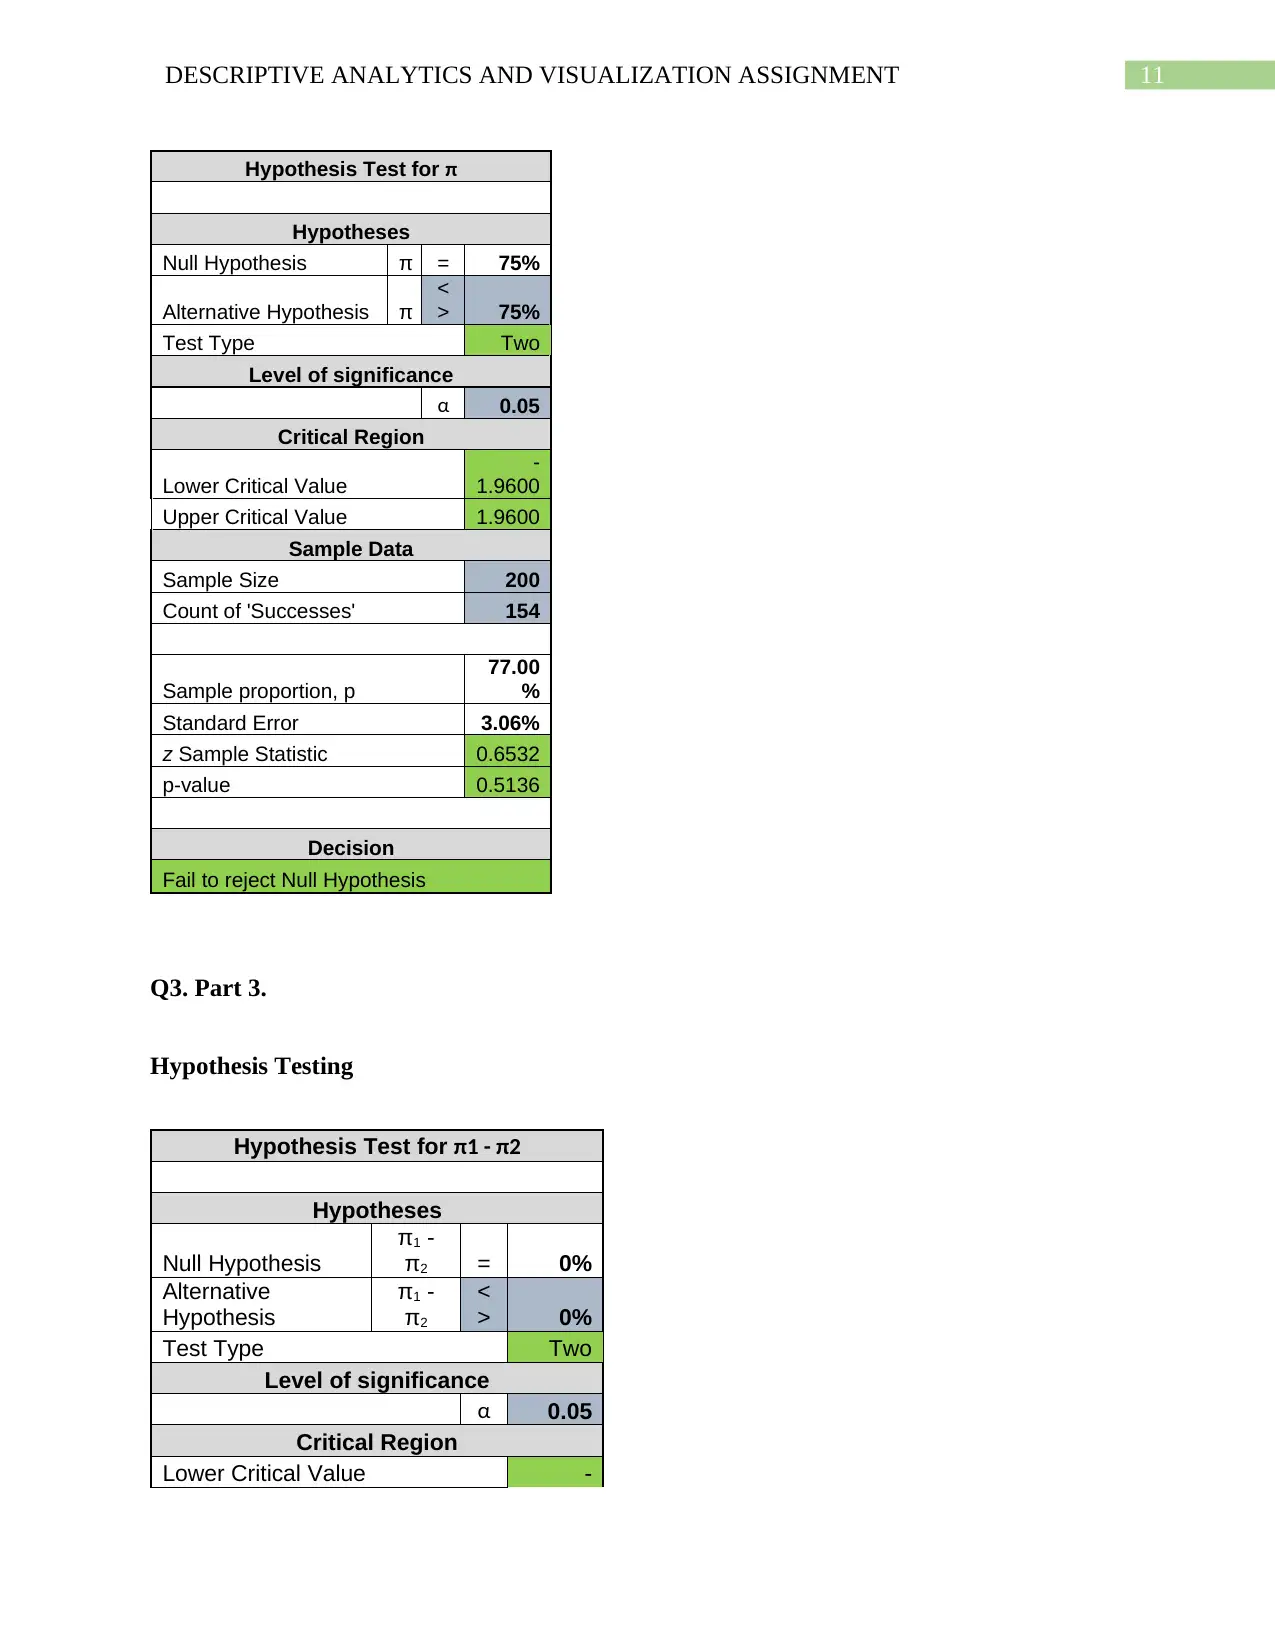
Question 3.2
Referring to another study, it was found to be saying that it had found 3 out of 4 or 75%
of the claims to be of either medium or mild level of severity conditions. The statement having
been tested for validity, based upon data for this year, as provided for the purpose of analysis and
found no significant evidence refuting the conjecture. There was therefore not enough evidence
against the conjecture that a proportion of three out of four of all claims made were of mild or
medium severity for this year. The statement is thus inferred upon to be a valid one for all the
patients. However there is a 5% chance that the conjecture that a proportion of three out of four
of all claims made were of mild or medium severity for this year might be untrue.
Question 3.3
The data provided for the purpose of analysis, failed to provide enough evidence to refute
the validity of the tentative statement that there is no difference in the proportion of males with
claims which are either mild or medium degree of severity with the proportion of females with
claims of mild or medium severity. There is therefore not enough evidence based on the given
Question 3.1
An industry report said that the average amount of claim payments had dropped at a level
lower than $77,500. The validity of this statement by the study report, was scrutinized and tested
using the available information on average of the claim payment amount. Thereby, it was found
that there is sufficient evidence against the conjecture that average claim payment amount is
greater than or equal to the value $77,500 and hence it was concluded that the statement by the
report regarding average claims payment amount is indeed so. However there is a 5% that the
statement that the average amount of claim payments had dropped at a level lower than $77,500
might be untrue.
Question 3.2
Referring to another study, it was found to be saying that it had found 3 out of 4 or 75%
of the claims to be of either medium or mild level of severity conditions. The statement having
been tested for validity, based upon data for this year, as provided for the purpose of analysis and
found no significant evidence refuting the conjecture. There was therefore not enough evidence
against the conjecture that a proportion of three out of four of all claims made were of mild or
medium severity for this year. The statement is thus inferred upon to be a valid one for all the
patients. However there is a 5% chance that the conjecture that a proportion of three out of four
of all claims made were of mild or medium severity for this year might be untrue.
Question 3.3
The data provided for the purpose of analysis, failed to provide enough evidence to refute
the validity of the tentative statement that there is no difference in the proportion of males with
claims which are either mild or medium degree of severity with the proportion of females with
claims of mild or medium severity. There is therefore not enough evidence based on the given
5DESCRIPTIVE ANALYTICS AND VISUALIZATION ASSIGNMENT
data that men and women have differing proportions when it comes to having mildly severe or
medium severe claims. However there is a 5% chance that the conjecture that there is no
difference in the proportion of males with claims which are either mild or medium degree of
severity with the proportion of females with claims of mild or medium severity is untrue.
Question 3.4
Depending on whether a private attorney had represented the claimant or not, it is
accepted in the industry that payment amounts may differ. The industry standard is stated to be
so that a private attorney would cost claimant a greater average amount than one who does not
have a private attorney. The data, provided for the purpose of analysis, reveals that there is
enough evidence to refute that there is no difference between average payment amounts when
attorney is private to when attorney is not private. The evidence supports that for claimants with
private attorneys, the average amount is greater than those with otherwise. The difference in the
average amounts for those whose attorney is private and those whose are not, was found to lie
between the amounts $31539 and $13182 with a chance of 95%. However there is a 5% chance
that the conjecture that for claimants with private attorneys, the average amount is greater than
those with non-private ones.
Question 3.5
Assessing the validity of the conjecture, as believed by stakeholders in the industry, that
use of private attorneys for representation is greater for severe claims cases than those which
have severity level of medium, it was ascertained that there exists enough evidence to support it.
This is due to the fact that enough evidence was found to refute the statement that proportion of
claimants with severe claims who have private attorneys are less or equal to proportion of
claimants with severe claims who do not have private attorneys. There is 5% chance that the
⊘ This is a preview!⊘
Do you want full access?
Subscribe today to unlock all pages.
Trusted by 1+ million students worldwide
6DESCRIPTIVE ANALYTICS AND VISUALIZATION ASSIGNMENT
conjecture is however false and that private attorneys are not involved more in severe condition
cases than in medium condition ones.
Question 4.1
Investigating the data to evaluate whether cases involving orthopaedic surgeons have a
lower chance of being of severe severity level, enough evidence was found to refute the
conjecture of proportion of severe cases to be equal to ones that are not when orthopaedic
surgeons are found to be involved. Thus it could be said that there is enough evidence to support
the statement that cases involving orthopaedic surgeons have lesser proportion of severe claims.
The proportion with severe condition cases when orthopaedic surgeons were involved was found
to be less than proportion with severe claims when it was not an orthopaedic surgeon involved,
where the value of difference lied with ninety five percent chance, between 85.65% and 44.78%.
However, there is 5% chance that the conjecture is false and there is no difference.
Question 4.2
There is not sufficient evidence, refuting the conjecture that the claim payment amount
for severe claim cases involving orthopaedic surgeons is no different to the average amount for
severe claim cases where specialization of the medical practitioner associated with the patient is
not an orthopaedic surgeon. The claim that the average of claims payment amount is lower for
severe cases associated with orthopaedic surgeons is thus not supported by the evidence.
However, there is 5% chance that the conjecture is false and there is difference.
Conclusion
The analysis therefore concludes with the insights that the average amount of claim is
around $51574 and $101547. Furthermore a typical claimant was found to be of age 45 with a
Paraphrase This Document
Need a fresh take? Get an instant paraphrase of this document with our AI Paraphraser
7DESCRIPTIVE ANALYTICS AND VISUALIZATION ASSIGNMENT
9% chance that he or she has no insurance and 23% of severe severity. 47.5% of the claimants
had private attorneys. Significant evidence to prove that three out of four or 75% of total cases
were mild and medium severity cases was found, However, no significant differences between
the proportion of mild and medium cases of men and women could be found. Again, private
attorneys were found to be associated with higher payment amounts. Sufficient evidence was
found to support this however not enough evidence to show proportion of severe cases involving
private attorneys was equal to proportion medium severity cases with private attorneys. Finally,
it was found that there are lesser severe cases with orthopaedic surgeons being involved than
others, however the average amount of claim payment was not found to be significantly different
for orthopaedic surgeons with those of other specialities when it came to cases of severe severity
claims.
8DESCRIPTIVE ANALYTICS AND VISUALIZATION ASSIGNMENT
Appendix
Frequency distribution of payment amount
Class interval Count of Amount cumulative cumulative %
1547-51547 31 31.00 0.155
51547-101547 151 182.00 0.91
101547-151547 13 195.00 0.975
151547-201547 3 198.00 0.99
201547-251547 2 200.00 1
Grand Total 200
Summary table of payment amount
Amount
Mean
73457.4935
5
Standard Error
2275.36330
6
Median 72571.375
Mode 5400
Standard
Deviation
32178.4964
7
Sample Variance 1035455635
Kurtosis
5.99422918
9
Skewness
1.15073848
5
Range 227177.8
Minimum 1547
Maximum 228724.8
Sum
14691498.7
1
Count 200
Claimant profile
⊘ This is a preview!⊘
Do you want full access?
Subscribe today to unlock all pages.
Trusted by 1+ million students worldwide
9DESCRIPTIVE ANALYTICS AND VISUALIZATION ASSIGNMENT
CLAIMANT PROFILE
Mean age
44.4
9
Insurance
No Insurance 0.09
Medicare/Medicaid 0.1
Private
0.47
5
Unknown 0.3
Severity
SEVERE 0.23
MEDIUM 0.64
MILD 0.13
Specialty
Anesthesiologists 0.42
Orthopedic surgeons 0.24
Dermatologists
0.22
5
OTHER
0.11
5
Q3. Part 1.
Hypothesis testing
Hypothesis Test for μ
Hypotheses
Null Hypothesis μ 0 77500
Alternative Hypothesis μ < 77500
Test Type Lower
Level of significance
α 0.05
Critical Region
Degrees of Freedom 199
Critical Value -1.6525
Paraphrase This Document
Need a fresh take? Get an instant paraphrase of this document with our AI Paraphraser
10DESCRIPTIVE ANALYTICS AND VISUALIZATION ASSIGNMENT
Sample Data
Sample Standard Deviation 32097.94942
Sample Mean 73457.49355
Sample Size 200
Standard Error of the Mean 2269.6678
t Sample Statistic -1.7811
p-value 0.0382
Decision
Reject Null Hypothesis
Estimate of Difference in mean
Confidence Interval for mean
Data
Sample Standard
Deviation
32097.9494
2
Sample Mean
73457.4935
5
Sample Size 200
Confidence Level 95%
Intermediate Calculations
Standard Error of the
Mean 2269.6678
Degrees of Freedom 199
t Value 1.9720
Margin of Error 4475.6862
Confidence Interval
Interval Lower Limit 68981.81
Interval Upper Limit 77933.18
Q3. Part 2.
Hypothesis Testing
11DESCRIPTIVE ANALYTICS AND VISUALIZATION ASSIGNMENT
Hypothesis Test for π
Hypotheses
Null Hypothesis π = 75%
Alternative Hypothesis π
<
> 75%
Test Type Two
Level of significance
α 0.05
Critical Region
Lower Critical Value
-
1.9600
Upper Critical Value 1.9600
Sample Data
Sample Size 200
Count of 'Successes' 154
Sample proportion, p
77.00
%
Standard Error 3.06%
z Sample Statistic 0.6532
p-value 0.5136
Decision
Fail to reject Null Hypothesis
Q3. Part 3.
Hypothesis Testing
Hypothesis Test for π1 - π2
Hypotheses
Null Hypothesis
π1 -
π2 = 0%
Alternative
Hypothesis
π1 -
π2
<
> 0%
Test Type Two
Level of significance
α 0.05
Critical Region
Lower Critical Value -
⊘ This is a preview!⊘
Do you want full access?
Subscribe today to unlock all pages.
Trusted by 1+ million students worldwide
1 out of 18
Related Documents


Your All-in-One AI-Powered Toolkit for Academic Success.
+13062052269
info@desklib.com
Available 24*7 on WhatsApp / Email
![[object Object]](/_next/static/media/star-bottom.7253800d.svg)
Unlock your academic potential
Copyright © 2020–2026 A2Z Services. All Rights Reserved. Developed and managed by ZUCOL.