MIS771: Descriptive Analytics and Visualisation Report on Beer Sales
VerifiedAdded on 2023/01/16
|22
|3829
|64
Report
AI Summary
This report analyzes Mad Dog Craft Beer's (MDCB) sales data using descriptive analytics and visualization techniques. It begins with descriptive statistics of customer order quantities, identifying the average, minimum, maximum, and distribution of sales. The report then identifies significant variables impacting order quantity through correlation analysis, determining that shipping cost, quality, and shipping speed have the highest correlations. Two multiple regression models are built to predict order quantity, with the second model incorporating only the significant variables of quality, brand image, and shipping cost, achieving an R-squared of 0.4571. An interaction effect between brand image and quality is explored, revealing a significant impact on order quantity. Furthermore, the report employs logistic regression to predict the probability of customers recommending MDCB's beer, incorporating variables such as distribution channel, quality, brand image, and shipping speed, achieving an overall accuracy of 76%. Predictive models are developed to explore how brand image and quality influence the probability of recommendation across different distribution channels. The analysis provides insights into factors driving beer sales and customer recommendations, offering strategic recommendations for MDCB to enhance sales and customer loyalty.
Running head: MIS771DESCRIPTIVE ANALYTICS AND VISUALISATION
Descriptive Analytics and Visualisation
Name of the student
Name of the university
Author’s note
Descriptive Analytics and Visualisation
Name of the student
Name of the university
Author’s note
Paraphrase This Document
Need a fresh take? Get an instant paraphrase of this document with our AI Paraphraser
1MIS771DESCRIPTIVE ANALYTICS AND VISUALISATION
Table of Contents
Introduction......................................................................................................................................2
Main Body.......................................................................................................................................2
Task 1 Descriptive Statistics........................................................................................................2
Task 2.1 - Identify the significant variable for the Model...........................................................3
Task 2.2 – Model Building..........................................................................................................4
2.2a - First Model........................................................................................................................4
2.2b - Second model....................................................................................................................5
Task 2.3 – Interaction Effect.......................................................................................................6
Task 3...........................................................................................................................................7
Task 3.1 – Predictive Model 1.....................................................................................................7
Task 3.2 – Predictive Model 2.....................................................................................................8
Task 3.3 – Predictive Model 3...................................................................................................10
Task 4.........................................................................................................................................11
Time series for predicting turnover...........................................................................................11
Conclusion.....................................................................................................................................11
Appendix........................................................................................................................................14
2MIS771DESCRIPTIVE ANALYTICS AND VISUALISATION
Introduction
Mad Dog Craft Beer (MDCB), is an ale brewing micro-brewery, located in Australia. It
primarily supplies Pale Ale beer to the regions of Melbourne and Victoria. It has seen a
substantial growth in business for the last fifteen years. As a matter of fact, the people of the
region are liking the beer being produced by the organization. In fact, to meet the growing
demand of beer the organization was forced to increase the production to more than 3 ML/year
last year (2018).
The organization, is expecting a phenomenal growth in beer sales due to it being liked by
Victorians. More importantly there has been an increased interest in micro-brewing culture.
Thus, MDCB feels that it should investigate the relation between its product and customers. The
organization understands, that quality of their beer has been the force behind its growth. Herein,
we investigate the relation between the quality of MDCB’s beer and sales. The quality of beer
has been measured using nine different parameters. We explore which of the factors are highly
responsible for the success of MDCB. Further, we also examine the reasons behind customers
recommending Pale Ale Beer manufactured by MDCB. To investigate the success of beer,
information has been collected from 200 customers. The information is segregated into three
broad sections. Part of the information regarding loyalty and distribution channel is collected
from Warehouse of MDCB. The information regarding the perception of the customers is
collected from survey. The last group of information relates to the recommendation of the beer
and order quantity. The information is reviewed so that MDCB can increase its customer base.
Main Body
⊘ This is a preview!⊘
Do you want full access?
Subscribe today to unlock all pages.
Trusted by 1+ million students worldwide
3MIS771DESCRIPTIVE ANALYTICS AND VISUALISATION
Task 1 Descriptive Statistics
From the survey it is found that the average sales of Beer to each customer is 7670 bottles
with a variation of 890 bottles. The minimum and maximum number of bottles purchased by a
customer is 4300 and 9900 bottles respectively. The total number of bottles purchased by the 200
customers who were surveyed was 15330. Further it is found that 50% of the customers less than
7600 bottles (Table 1). Further, it is also visualised that the variable order quantity is normally
distributed (Figure 1). Hence, the variable order quantity can be used as the outcome variable.
The survey revealed that 51% of the customers surveyed would recommend beer
produced by MDCB (figure 2). Thus it is found that more customers would recommend
MDCB’s Pale Ale Beer. However, the difference in percentage of customers who would
recommend to would not recommend the beer is only 2%.
Task 2.1 - Identify the significant variable for the Model
In order to identify variables which might significantly affect order quantity of beer, 9
variables were identified. The distribution of dependent variable (order quantity) was tested. It
was found that order quantity was normally distributed. Thus, the relation between order quantity
and the nine variables was analysed. Karl-pearson correlation was used to reveal the relation
between order quantity and the variables. The analysis revealed that most of the customers
believed that competitive pricing and flexible pricing does not impact (has a negative impact) the
order quantity. Thus the two variables were dropped from further studies (Table 2).
From the seven variables which have a positive correlation it is found that Shipping cost
has the highest correlation (p = 0.5044) with order quantity. The correlation between Quality and
Paraphrase This Document
Need a fresh take? Get an instant paraphrase of this document with our AI Paraphraser
4MIS771DESCRIPTIVE ANALYTICS AND VISUALISATION
Shipping speed with Order Quantity are 0.4334 and 0.4251 respectively. Hence, Quality,
Shipping speed and shipping cost are moderately correlated with order quantity.
The correlation between Brand image and Order fulfilment and Order quantity are found
to be 0.3380 and 0.3146 respectively. Moreover, SM presence and Advertisement have a
correlation of 0.2352 and 0.2370 respectively with order quantity. Thus from correlation
analysis it is found that brand image, order fulfilment, sm presence and advertisement have a low
correlation with order quantity.
Task 2.2 – Model Building
2.2a - First Model
The variables selected to predict the order quantity of beer are Product Quality, Social
Media Presence, Advertising, Brand Image, Order & Billing, Shipping Speed and Shipping Cost.
These seven variables have been selected from the initial process wherein they have been found
to be positively correlated with order quantity.
As a first step towards building a model to predict order quantity linear multiple
regression is used.
The order quantity can be predicted as:
Order Quanity=3.0334+0.2774∗Quality−0.1560∗SM Presence−0.0180∗Advert+0. .3219∗Brand Image−
Analysis of the regression coefficients reveal that keeping other variables constant for
unit increase in brand image, order quantity increases by a factor of 0.3219. Similarly, for
one-unit increase in shipping cost, order quantity increases by a factor 0.2568. In addition,
5MIS771DESCRIPTIVE ANALYTICS AND VISUALISATION
for unit increase in quality of beer, order quantity increases by 0.2774 (Table 3). Further,
from the regression coefficients table it is found that the p-value for Quality, Brand Image
and Shipping Cost are 0.0000, 0.0000 and 0.0008 respectively. Thus at 5% level of
significance the coefficients of the variables are found to be significant.
Further, it is found that for unit increase in SM presence there is a decrease in
order quantity by 0.1560. Moreover, at 5% level of significance the regression coefficient is
not significant (p-value = 0.1195). For unit increase in Advertisement there is a decrease in
order quantity by 0.0180. Moreover, at 5% level of significance the regression coefficient is
not significant (p-value = 0.7384). For unit increase in order fulfilment there is a decrease in
order quantity by 0.1493. In addition, at 5% level of significance the regression coefficient is
not significant (p-value = 0.0713). Thus, it is found that the independent variables SM
presence, Advertisement and shipping cost reduce order quantity.
For unit increase in shipping speed there is an increase in order quantity by 0.1738.
However, at 5% level of significance the regression coefficient is not significant (p-value =
0.2026).
Thus the four variables (SM presence, advertisement, order fulfilment and shipping
speed) are dropped in further studies of order quantity.
The analysis revealed that 47.29% of order quantity can be predicted from the seven
variables. Moreover, it was also found that the independent variables significantly affected order
quantity, at 5% level of significance, F-value (7, 192) = 24.6039 (Table 3).
⊘ This is a preview!⊘
Do you want full access?
Subscribe today to unlock all pages.
Trusted by 1+ million students worldwide
6MIS771DESCRIPTIVE ANALYTICS AND VISUALISATION
2.2b - Second model
In order to build a better model to predict the order quantity of MDCB’s Pale Ale Beer,
SM Presence, Advertisement, Order fulfilment and Shipping Speed were removed from the
model. The variables had a p-value of more than 0.05 in the initial model. After removing the
variables order quantity was predicted through Quality, Brand Image and Shipping Cost. From
the model order quantity can be predicted as:
Order Quantity=2.9235+0.2677∗Quality+ 0.2204∗Brand Image+0.2733∗Shipping Cost
For the above linear model R2 is found to be 0.4571. Thus, 45.71% of order quantity of
MDCB’s beer can be predicted from the three variables. Moreover, at 5% level of significance,
the variables can predict the order quantity, F-value (3, 196) = 55.0029 (Table 4).
From the analysis it is found that the three variables have a significant impact on order
quantity, p-value < 0.05. Keeping quality and brand image constant, it was found that for each
unit increase in perception towards shipping cost, order quantity increases by 0.2733. Similarly,
while quality and shipping cost are kept constant, for unit increase in perception\on towards
brand image, order quantity increases by 0.2204. Further, it is also revealed that perception of
quality increase order quantity by 0.2677, when brand image and shipping cost are constant
(Table 4).
Thus, in order to predict order quantity of MDCB’s Pale Ale Beer, the organization should
consider Quality, Brand Image and Shipping Cost perception of customers.
Task 2.3 – Interaction Effect
In order to study the interaction effect of Brand Image on the relation between Quality
and Order Quantity an interaction variable is created. The interaction variable is the product of
Paraphrase This Document
Need a fresh take? Get an instant paraphrase of this document with our AI Paraphraser
7MIS771DESCRIPTIVE ANALYTICS AND VISUALISATION
customer responses of quality and brand image. The three variables Quality, Brand image and
Interaction term serve as the independent variables. Order quantity is the dependent variable.
Multiple linear regression is used to study the interaction effect.
From the study it is found that when brand image interacts with quality of MDCB’s beer
then order quantity can be predicted by:
Order Quanity=0.5011+ 0.6911∗Quality +0.8643∗Brand Image−0.0686∗Quality∗Brand Image
Further, it is found that the coefficient of interaction has a p-value of 0.0387, less than 0.05
(Table 5).
Thus there is a significant interaction of brand image on the relation between Quality and
order quantity.
The interaction effect can be interpreted as: Quality has a more significant impact on order
quantity of beer when the quality of beer is low (Figure 3).
Task 3
Task 3.1 – Predictive Model 1
In order to investigate the probability of recommending MDCB’s beer through the four
variables selected by Todd, logistic regression is used. Logistic regression is used since the
variable “recommended” is a binary variable. In addition, it is also found that distribution
channel is a binary variable. The independent variables brand image, quality and shipping speed
are continuous variables.
The probability of recommending MDCB’s Pale Ale beer is:
8MIS771DESCRIPTIVE ANALYTICS AND VISUALISATION
P ( recommend )= 1
1+ e13.28−0.97∗DistCannel −0.65∗Quality−0.62∗Brand Image −1.16∗Shipping Speed
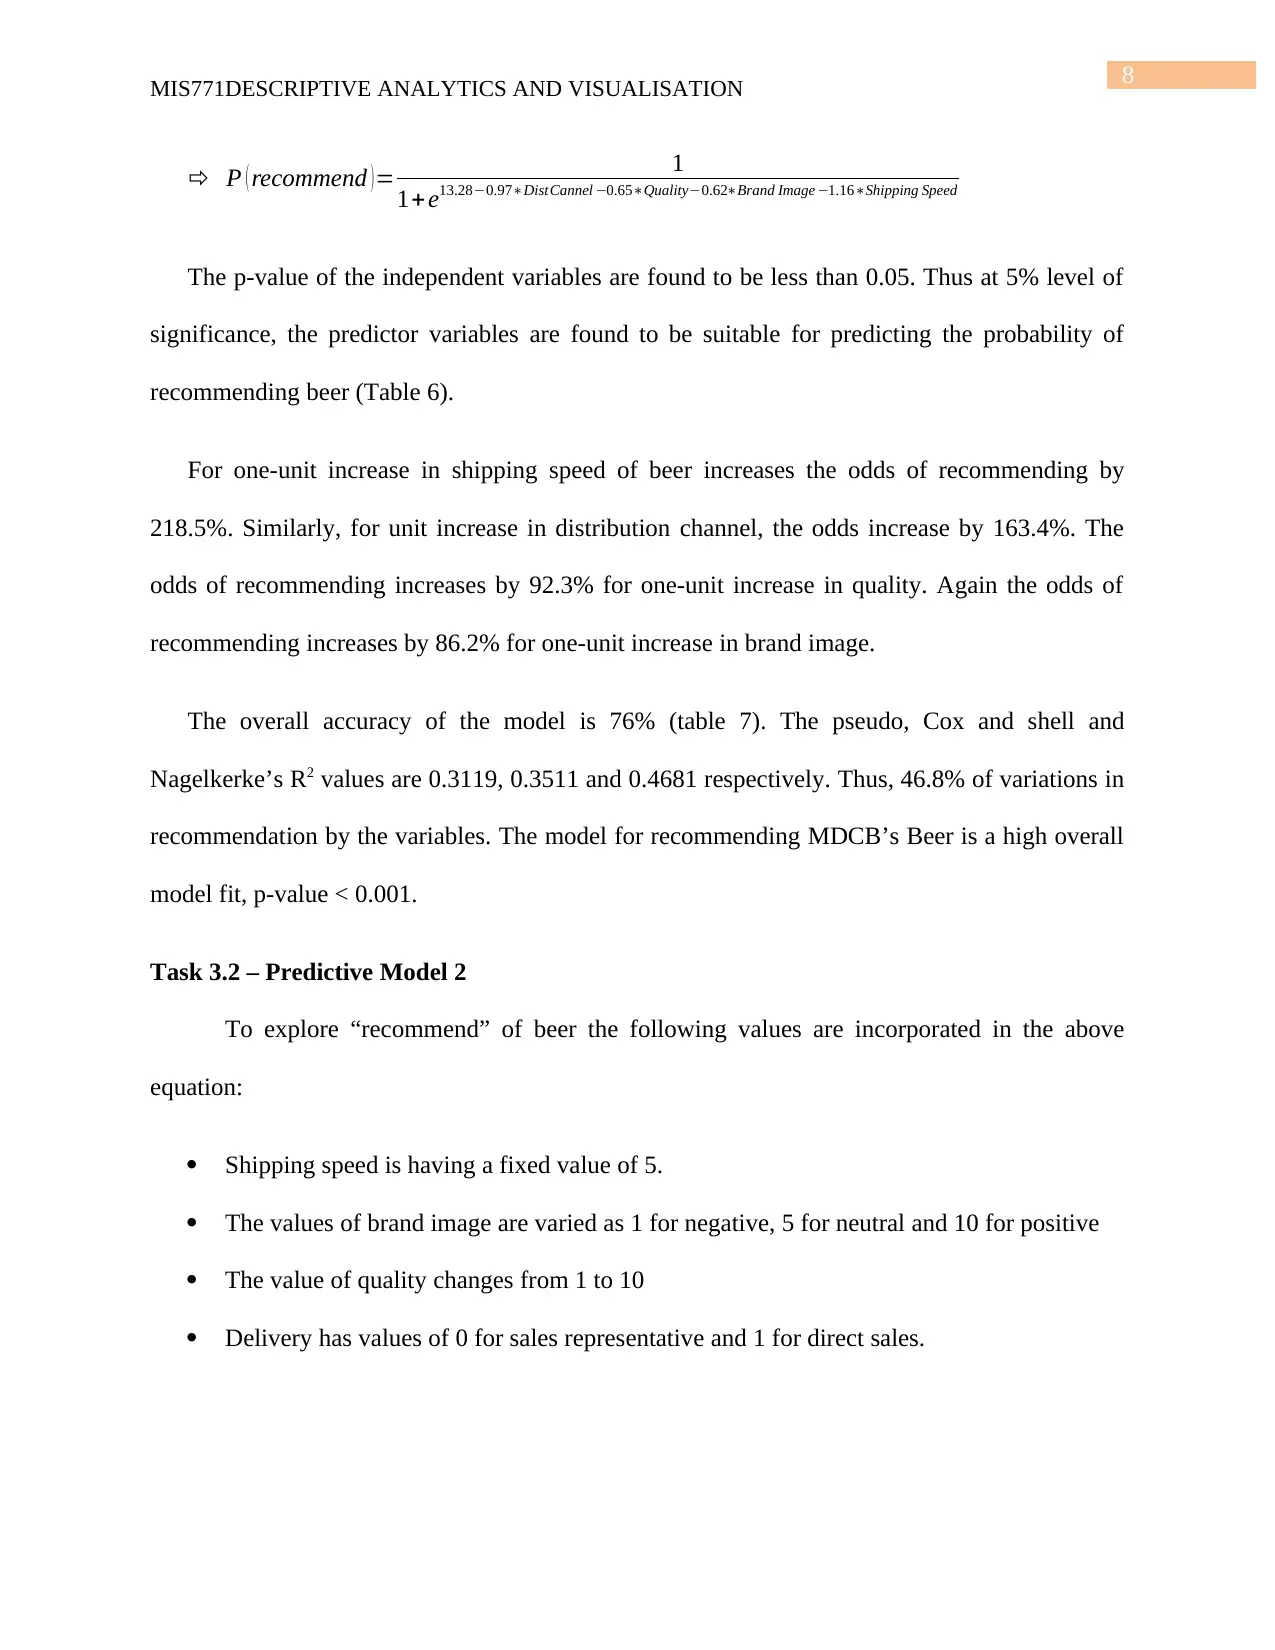
The p-value of the independent variables are found to be less than 0.05. Thus at 5% level of
significance, the predictor variables are found to be suitable for predicting the probability of
recommending beer (Table 6).
For one-unit increase in shipping speed of beer increases the odds of recommending by
218.5%. Similarly, for unit increase in distribution channel, the odds increase by 163.4%. The
odds of recommending increases by 92.3% for one-unit increase in quality. Again the odds of
recommending increases by 86.2% for one-unit increase in brand image.
The overall accuracy of the model is 76% (table 7). The pseudo, Cox and shell and
Nagelkerke’s R2 values are 0.3119, 0.3511 and 0.4681 respectively. Thus, 46.8% of variations in
recommendation by the variables. The model for recommending MDCB’s Beer is a high overall
model fit, p-value < 0.001.
Task 3.2 – Predictive Model 2
To explore “recommend” of beer the following values are incorporated in the above
equation:
Shipping speed is having a fixed value of 5.
The values of brand image are varied as 1 for negative, 5 for neutral and 10 for positive
The value of quality changes from 1 to 10
Delivery has values of 0 for sales representative and 1 for direct sales.
P ( recommend )= 1
1+ e13.28−0.97∗DistCannel −0.65∗Quality−0.62∗Brand Image −1.16∗Shipping Speed
The p-value of the independent variables are found to be less than 0.05. Thus at 5% level of
significance, the predictor variables are found to be suitable for predicting the probability of
recommending beer (Table 6).
For one-unit increase in shipping speed of beer increases the odds of recommending by
218.5%. Similarly, for unit increase in distribution channel, the odds increase by 163.4%. The
odds of recommending increases by 92.3% for one-unit increase in quality. Again the odds of
recommending increases by 86.2% for one-unit increase in brand image.
The overall accuracy of the model is 76% (table 7). The pseudo, Cox and shell and
Nagelkerke’s R2 values are 0.3119, 0.3511 and 0.4681 respectively. Thus, 46.8% of variations in
recommendation by the variables. The model for recommending MDCB’s Beer is a high overall
model fit, p-value < 0.001.
Task 3.2 – Predictive Model 2
To explore “recommend” of beer the following values are incorporated in the above
equation:
Shipping speed is having a fixed value of 5.
The values of brand image are varied as 1 for negative, 5 for neutral and 10 for positive
The value of quality changes from 1 to 10
Delivery has values of 0 for sales representative and 1 for direct sales.
⊘ This is a preview!⊘
Do you want full access?
Subscribe today to unlock all pages.
Trusted by 1+ million students worldwide
9MIS771DESCRIPTIVE ANALYTICS AND VISUALISATION
negative neutral positive negative neutral positive
Sales Representative Direct Purchase
0.0000
0.1000
0.2000
0.3000
0.4000
0.5000
0.6000
0.7000
0.8000
0.9000
1.0000
Probablity of Recommendation
1 2 3 4 5 6 7 8 9 10
Quality
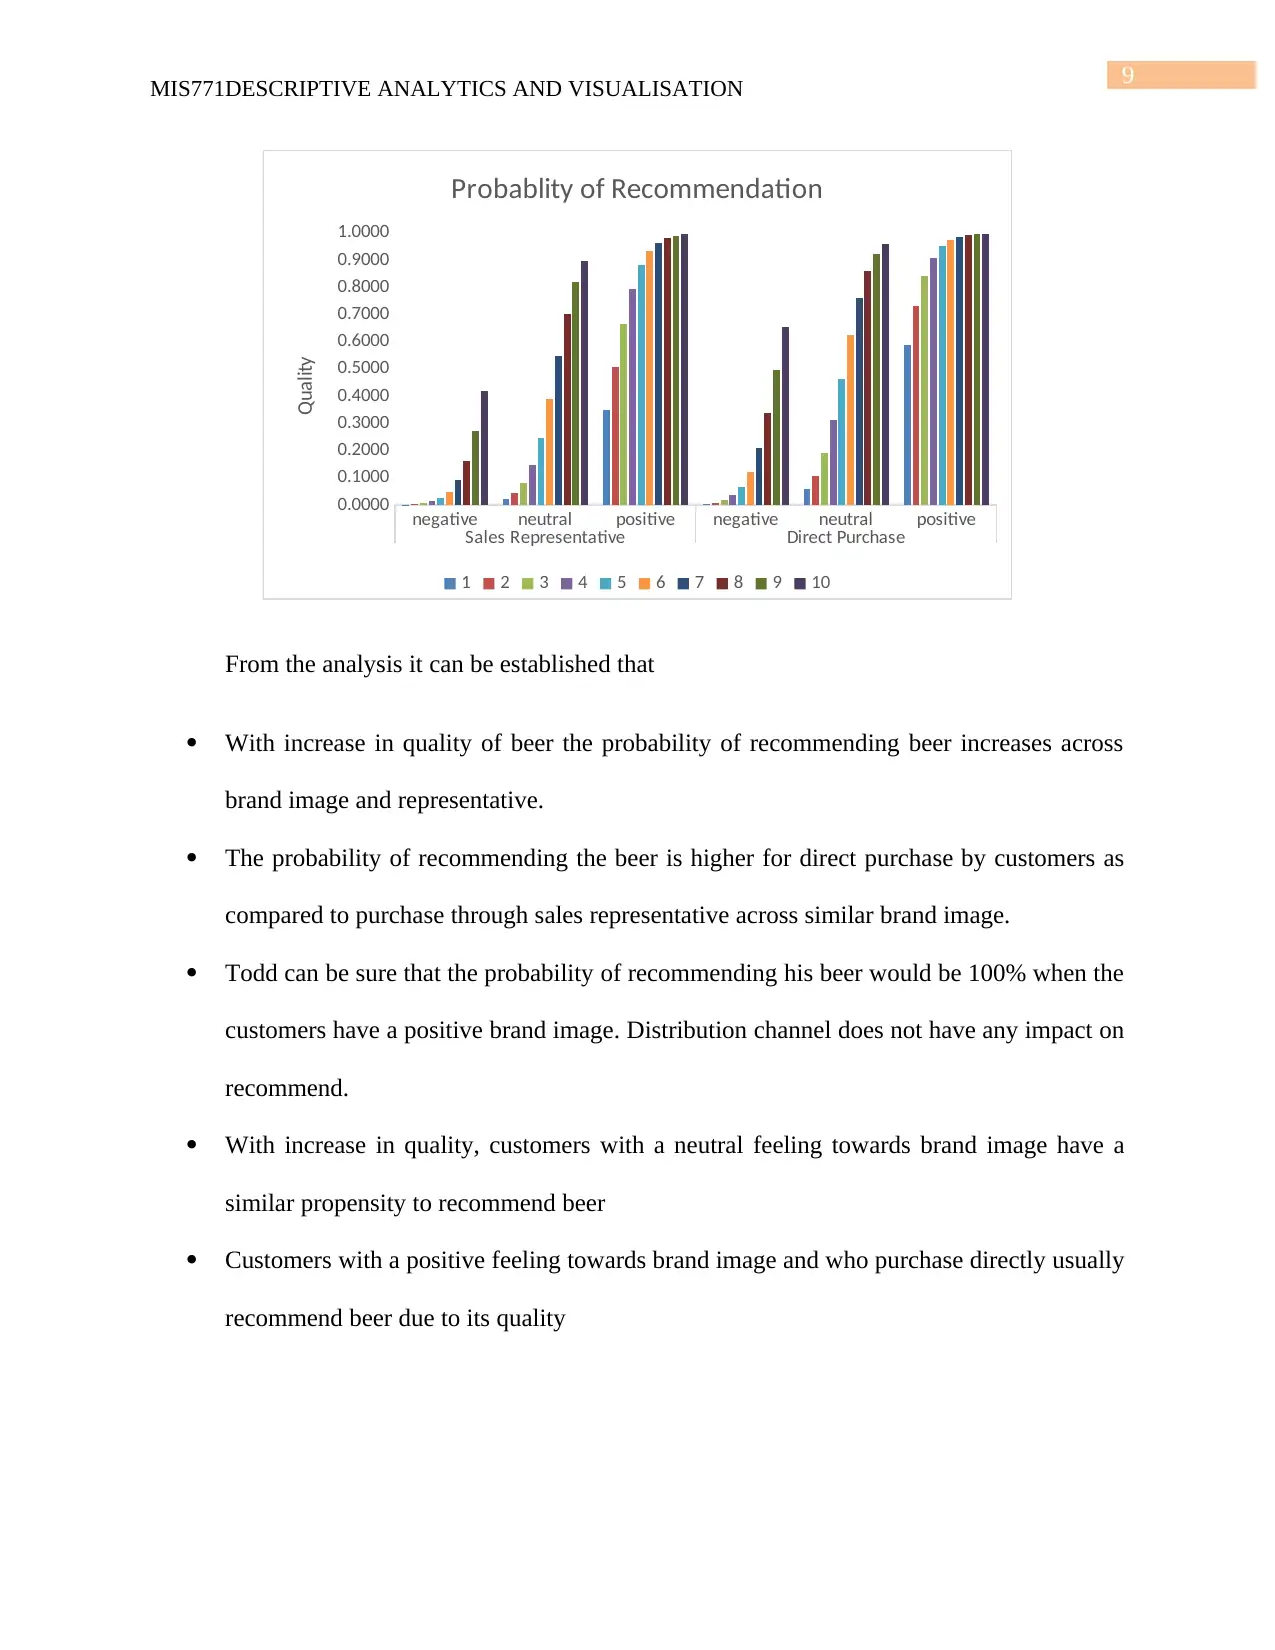
From the analysis it can be established that
With increase in quality of beer the probability of recommending beer increases across
brand image and representative.
The probability of recommending the beer is higher for direct purchase by customers as
compared to purchase through sales representative across similar brand image.
Todd can be sure that the probability of recommending his beer would be 100% when the
customers have a positive brand image. Distribution channel does not have any impact on
recommend.
With increase in quality, customers with a neutral feeling towards brand image have a
similar propensity to recommend beer
Customers with a positive feeling towards brand image and who purchase directly usually
recommend beer due to its quality
negative neutral positive negative neutral positive
Sales Representative Direct Purchase
0.0000
0.1000
0.2000
0.3000
0.4000
0.5000
0.6000
0.7000
0.8000
0.9000
1.0000
Probablity of Recommendation
1 2 3 4 5 6 7 8 9 10
Quality
From the analysis it can be established that
With increase in quality of beer the probability of recommending beer increases across
brand image and representative.
The probability of recommending the beer is higher for direct purchase by customers as
compared to purchase through sales representative across similar brand image.
Todd can be sure that the probability of recommending his beer would be 100% when the
customers have a positive brand image. Distribution channel does not have any impact on
recommend.
With increase in quality, customers with a neutral feeling towards brand image have a
similar propensity to recommend beer
Customers with a positive feeling towards brand image and who purchase directly usually
recommend beer due to its quality
Paraphrase This Document
Need a fresh take? Get an instant paraphrase of this document with our AI Paraphraser
10MIS771DESCRIPTIVE ANALYTICS AND VISUALISATION
1 2 3 4 5 6 7 8 9 10
0.0000
0.2000
0.4000
0.6000
0.8000
1.0000
Probablity of Recommend
Sales Representative negative Sales Representative neutral
Sales Representative positive Direct Purchase negative
Direct Purchase neutral Direct Purchase positive
Quality
Probablity
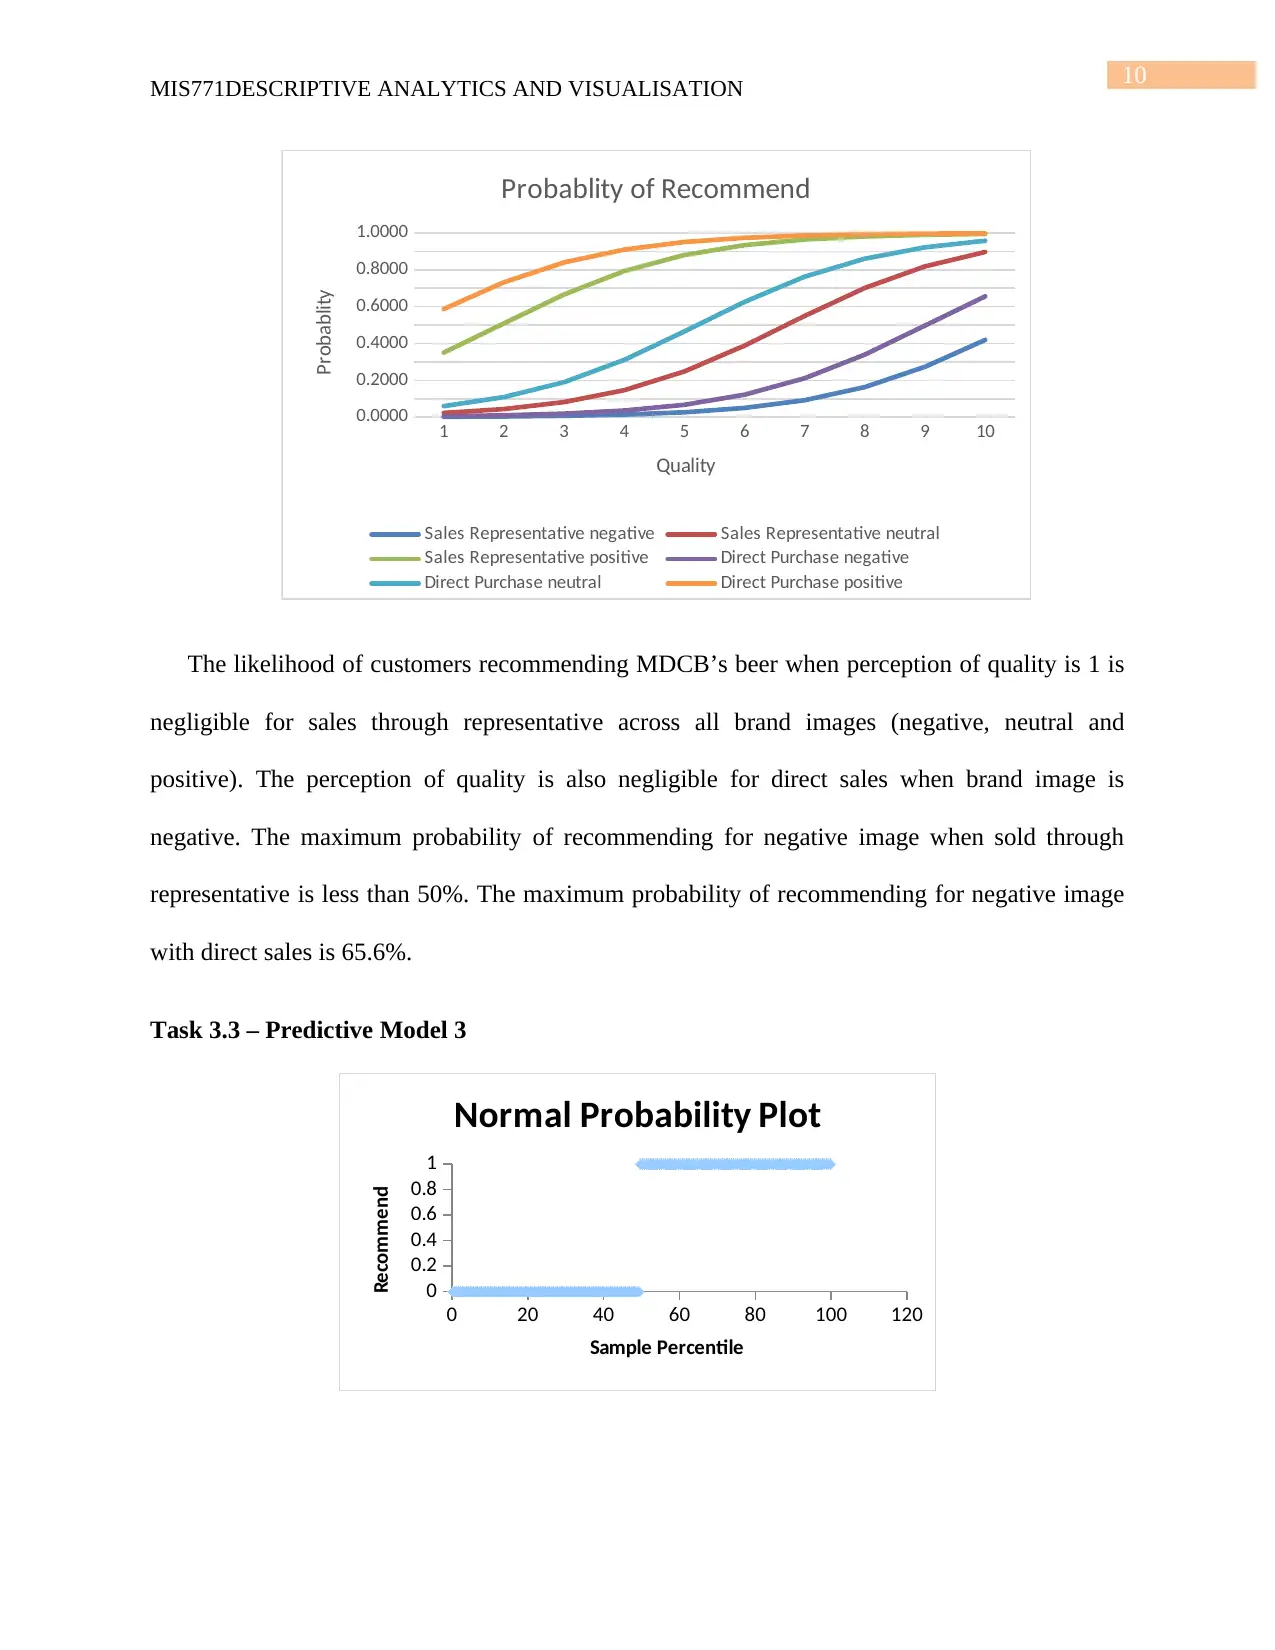
The likelihood of customers recommending MDCB’s beer when perception of quality is 1 is
negligible for sales through representative across all brand images (negative, neutral and
positive). The perception of quality is also negligible for direct sales when brand image is
negative. The maximum probability of recommending for negative image when sold through
representative is less than 50%. The maximum probability of recommending for negative image
with direct sales is 65.6%.
Task 3.3 – Predictive Model 3
0 20 40 60 80 100 120
0
0.2
0.4
0.6
0.8
1
Normal Probability Plot
Sample Percentile
Recommend
1 2 3 4 5 6 7 8 9 10
0.0000
0.2000
0.4000
0.6000
0.8000
1.0000
Probablity of Recommend
Sales Representative negative Sales Representative neutral
Sales Representative positive Direct Purchase negative
Direct Purchase neutral Direct Purchase positive
Quality
Probablity
The likelihood of customers recommending MDCB’s beer when perception of quality is 1 is
negligible for sales through representative across all brand images (negative, neutral and
positive). The perception of quality is also negligible for direct sales when brand image is
negative. The maximum probability of recommending for negative image when sold through
representative is less than 50%. The maximum probability of recommending for negative image
with direct sales is 65.6%.
Task 3.3 – Predictive Model 3
0 20 40 60 80 100 120
0
0.2
0.4
0.6
0.8
1
Normal Probability Plot
Sample Percentile
Recommend
11MIS771DESCRIPTIVE ANALYTICS AND VISUALISATION
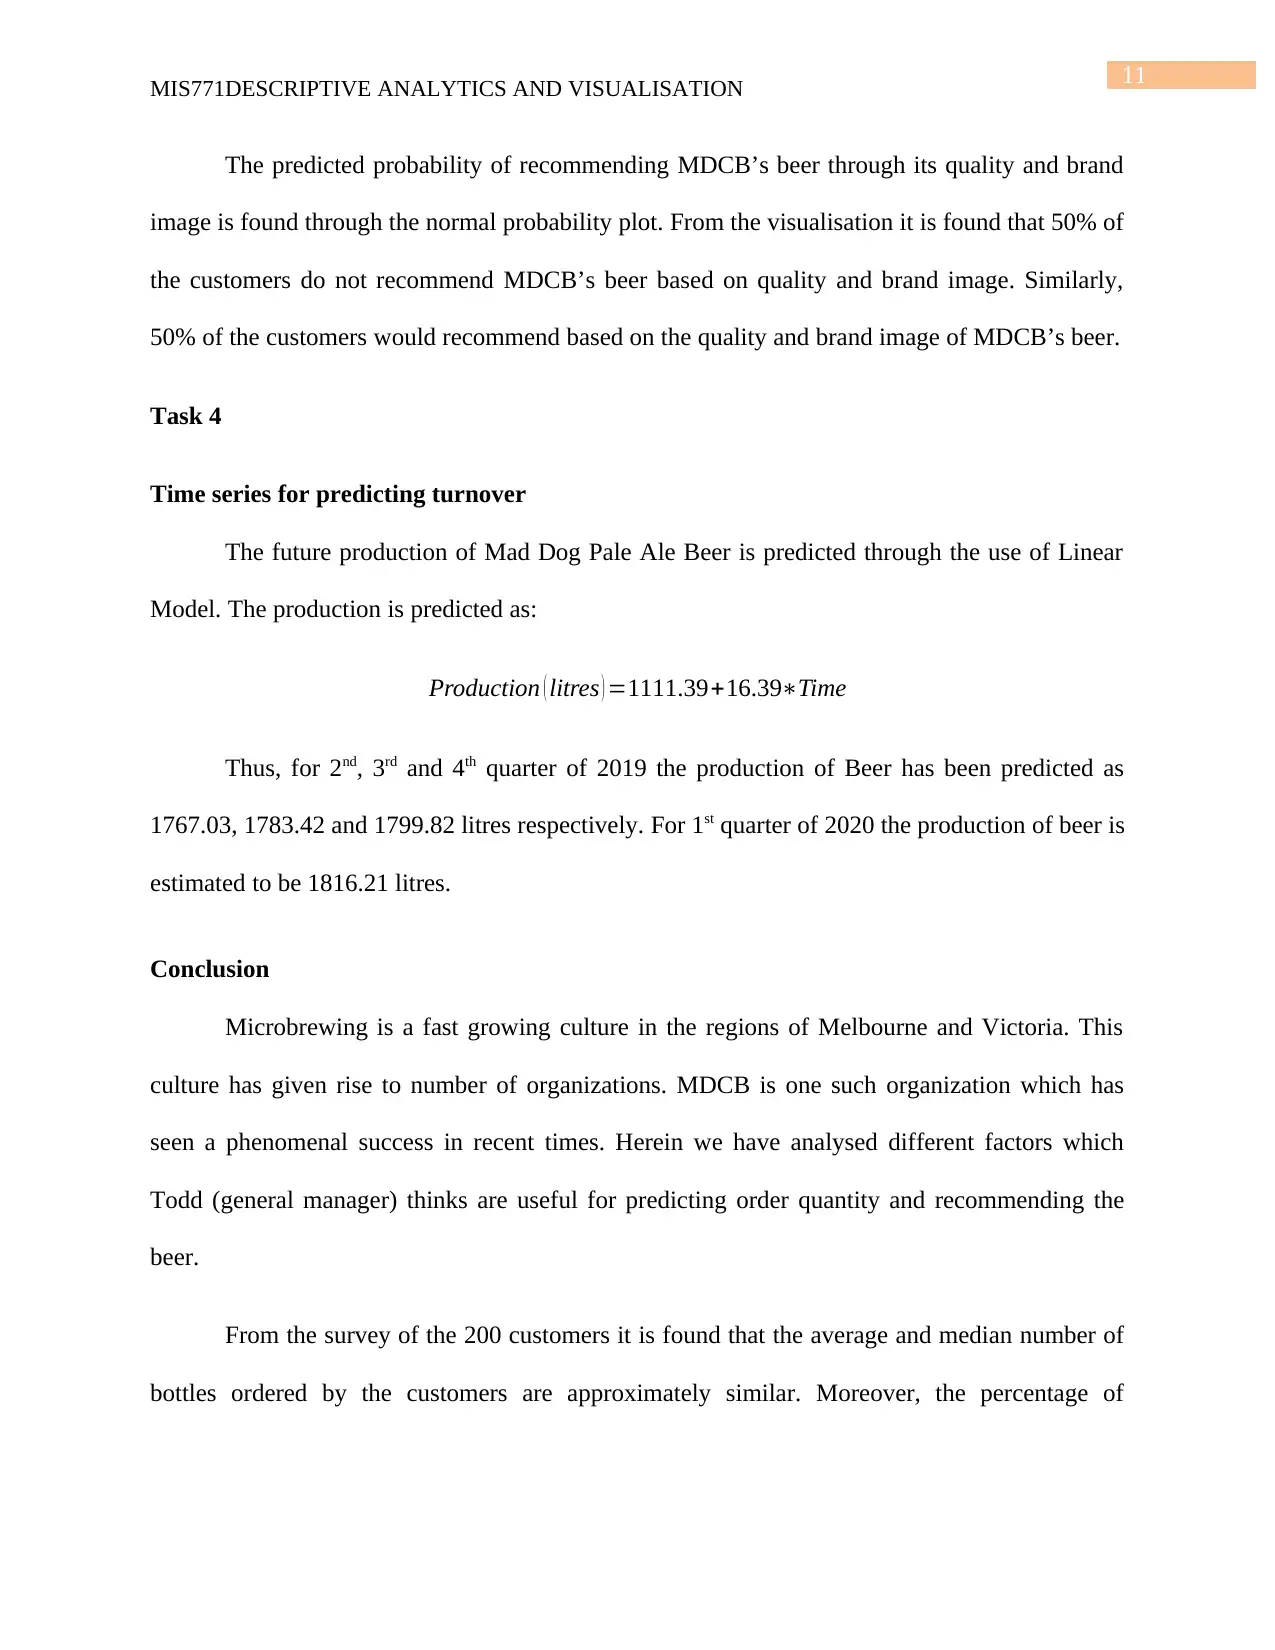
The predicted probability of recommending MDCB’s beer through its quality and brand
image is found through the normal probability plot. From the visualisation it is found that 50% of
the customers do not recommend MDCB’s beer based on quality and brand image. Similarly,
50% of the customers would recommend based on the quality and brand image of MDCB’s beer.
Task 4
Time series for predicting turnover
The future production of Mad Dog Pale Ale Beer is predicted through the use of Linear
Model. The production is predicted as:
Production ( litres ) =1111.39+16.39∗Time
Thus, for 2nd, 3rd and 4th quarter of 2019 the production of Beer has been predicted as
1767.03, 1783.42 and 1799.82 litres respectively. For 1st quarter of 2020 the production of beer is
estimated to be 1816.21 litres.
Conclusion
Microbrewing is a fast growing culture in the regions of Melbourne and Victoria. This
culture has given rise to number of organizations. MDCB is one such organization which has
seen a phenomenal success in recent times. Herein we have analysed different factors which
Todd (general manager) thinks are useful for predicting order quantity and recommending the
beer.
From the survey of the 200 customers it is found that the average and median number of
bottles ordered by the customers are approximately similar. Moreover, the percentage of
⊘ This is a preview!⊘
Do you want full access?
Subscribe today to unlock all pages.
Trusted by 1+ million students worldwide
1 out of 22
Related Documents


Your All-in-One AI-Powered Toolkit for Academic Success.
+13062052269
info@desklib.com
Available 24*7 on WhatsApp / Email
![[object Object]](/_next/static/media/star-bottom.7253800d.svg)
Unlock your academic potential
Copyright © 2020–2026 A2Z Services. All Rights Reserved. Developed and managed by ZUCOL.