Descriptive Analytics and Visualization Report for AusPaper: MIS771
VerifiedAdded on 2021/05/30
|14
|2936
|257
Report
AI Summary
This report presents a descriptive analytics and visualization analysis of AusPaper, an Australian paper manufacturing company. The study, conducted for the MIS771 course, examines customer satisfaction, potential strategic alliances, and financial forecasting. The report details data collection methods, data descriptions, and analysis of both dependent variables: customer satisfaction and interest in strategic alliances. Regression analysis is used to identify factors influencing customer satisfaction, with models developed to predict customer satisfaction based on product quality, e-commerce activities, and salesforce image. The report also explores interaction effects, considering the impact of product line and customer location. Furthermore, the report includes forecasting of quarterly turnover. The findings provide valuable insights for AusPaper to enhance customer relationships and business strategies.
Running Head: MIS771: DESCRIPTIVE ANALYTICS AND VISUALIZATION
MIS771
Descriptive Analytics and Visualization
Name of the Student
Name of the University
Author Note
MIS771
Descriptive Analytics and Visualization
Name of the Student
Name of the University
Author Note
Paraphrase This Document
Need a fresh take? Get an instant paraphrase of this document with our AI Paraphraser
1MIS771: DESCRIPTIVE ANALYTICS AND VISUALIZATION
Table of Contents
Introduction......................................................................................................................................2
Data Collection................................................................................................................................3
Data Description..............................................................................................................................3
Data Analysis...................................................................................................................................4
Analysis of the Dependent Variable............................................................................................4
Factors influencing Customer Satisfaction..................................................................................6
Relevant Variable Identification..............................................................................................6
Prediction Model.....................................................................................................................7
Interaction Effect.........................................................................................................................8
Likelihood of Building Strategic Alliance Partnership...............................................................9
Forecasting Quarterly Turnover................................................................................................11
Conclusion.....................................................................................................................................12
References......................................................................................................................................13
2MIS771: DESCRIPTIVE ANALYTICS AND VISUALIZATION
Introduction
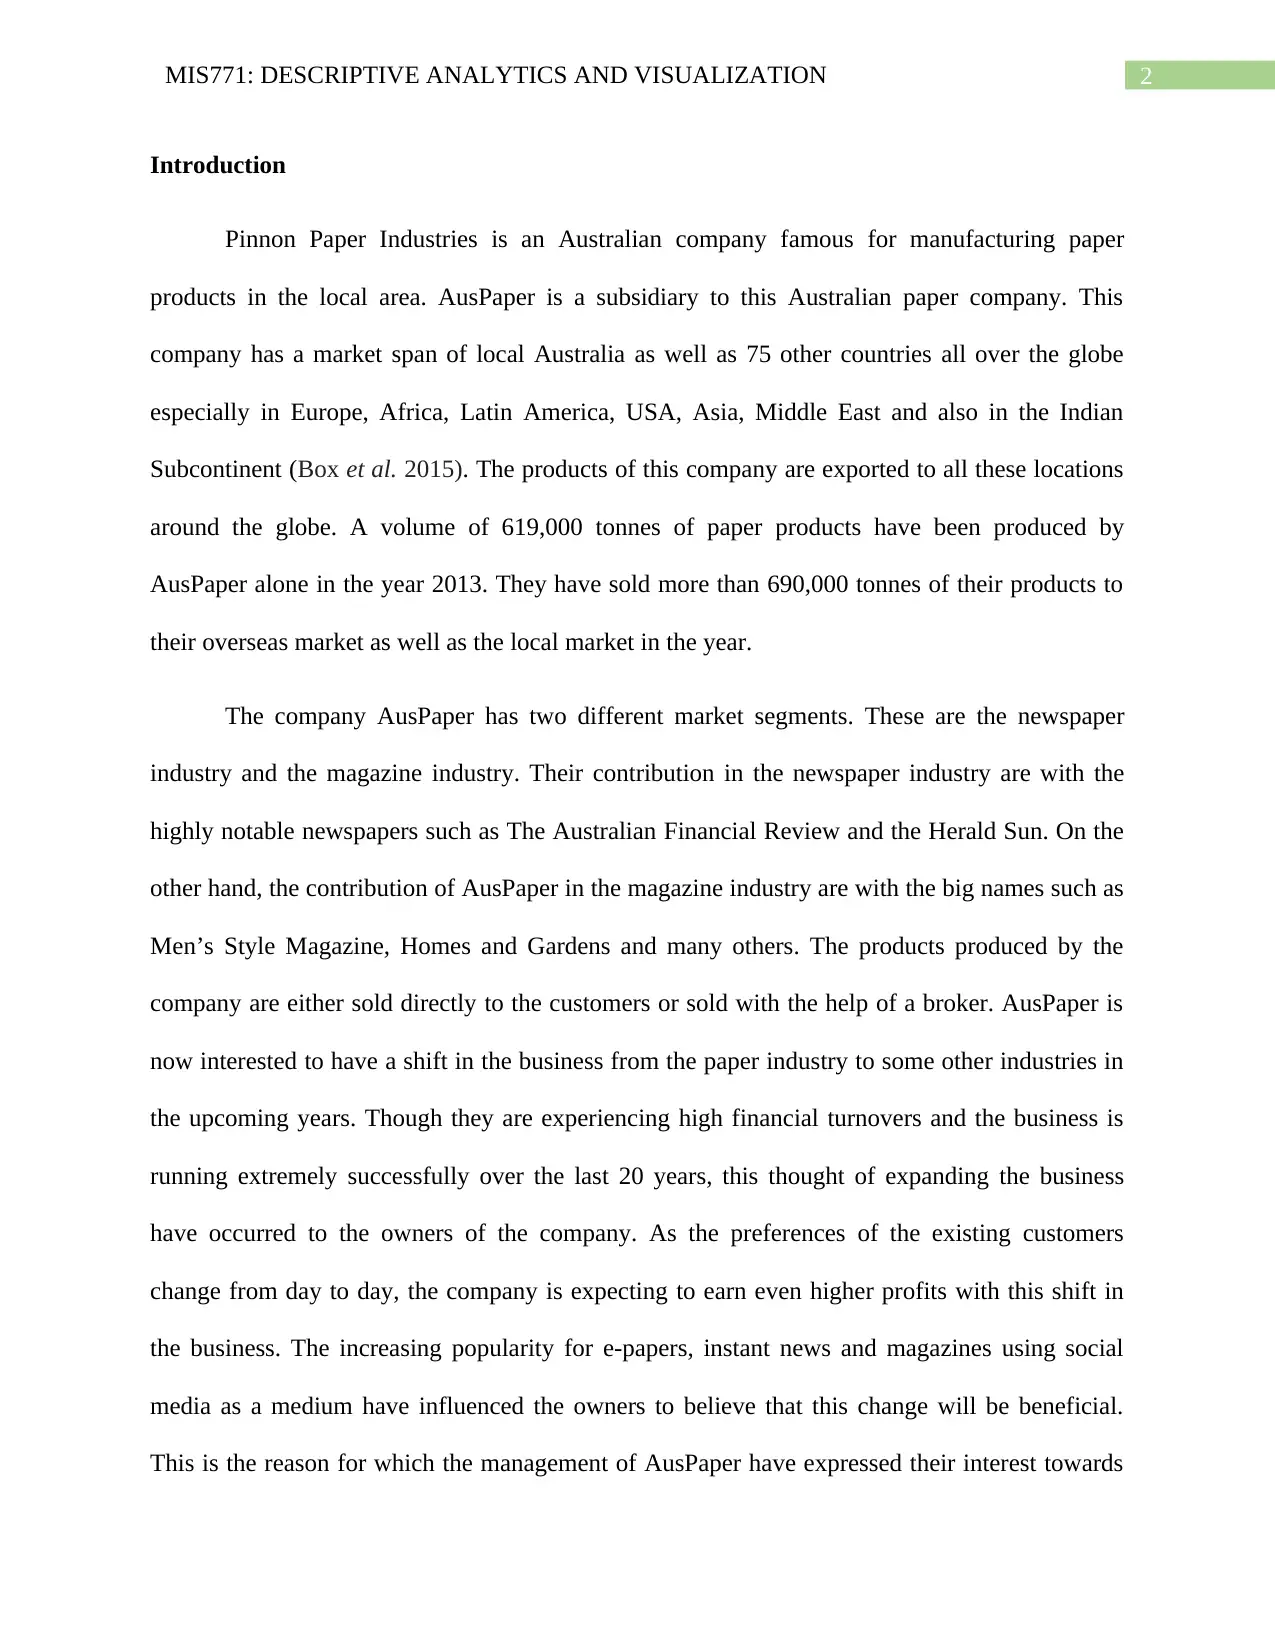
Pinnon Paper Industries is an Australian company famous for manufacturing paper
products in the local area. AusPaper is a subsidiary to this Australian paper company. This
company has a market span of local Australia as well as 75 other countries all over the globe
especially in Europe, Africa, Latin America, USA, Asia, Middle East and also in the Indian
Subcontinent (Box et al. 2015). The products of this company are exported to all these locations
around the globe. A volume of 619,000 tonnes of paper products have been produced by
AusPaper alone in the year 2013. They have sold more than 690,000 tonnes of their products to
their overseas market as well as the local market in the year.
The company AusPaper has two different market segments. These are the newspaper
industry and the magazine industry. Their contribution in the newspaper industry are with the
highly notable newspapers such as The Australian Financial Review and the Herald Sun. On the
other hand, the contribution of AusPaper in the magazine industry are with the big names such as
Men’s Style Magazine, Homes and Gardens and many others. The products produced by the
company are either sold directly to the customers or sold with the help of a broker. AusPaper is
now interested to have a shift in the business from the paper industry to some other industries in
the upcoming years. Though they are experiencing high financial turnovers and the business is
running extremely successfully over the last 20 years, this thought of expanding the business
have occurred to the owners of the company. As the preferences of the existing customers
change from day to day, the company is expecting to earn even higher profits with this shift in
the business. The increasing popularity for e-papers, instant news and magazines using social
media as a medium have influenced the owners to believe that this change will be beneficial.
This is the reason for which the management of AusPaper have expressed their interest towards
Introduction
Pinnon Paper Industries is an Australian company famous for manufacturing paper
products in the local area. AusPaper is a subsidiary to this Australian paper company. This
company has a market span of local Australia as well as 75 other countries all over the globe
especially in Europe, Africa, Latin America, USA, Asia, Middle East and also in the Indian
Subcontinent (Box et al. 2015). The products of this company are exported to all these locations
around the globe. A volume of 619,000 tonnes of paper products have been produced by
AusPaper alone in the year 2013. They have sold more than 690,000 tonnes of their products to
their overseas market as well as the local market in the year.
The company AusPaper has two different market segments. These are the newspaper
industry and the magazine industry. Their contribution in the newspaper industry are with the
highly notable newspapers such as The Australian Financial Review and the Herald Sun. On the
other hand, the contribution of AusPaper in the magazine industry are with the big names such as
Men’s Style Magazine, Homes and Gardens and many others. The products produced by the
company are either sold directly to the customers or sold with the help of a broker. AusPaper is
now interested to have a shift in the business from the paper industry to some other industries in
the upcoming years. Though they are experiencing high financial turnovers and the business is
running extremely successfully over the last 20 years, this thought of expanding the business
have occurred to the owners of the company. As the preferences of the existing customers
change from day to day, the company is expecting to earn even higher profits with this shift in
the business. The increasing popularity for e-papers, instant news and magazines using social
media as a medium have influenced the owners to believe that this change will be beneficial.
This is the reason for which the management of AusPaper have expressed their interest towards
⊘ This is a preview!⊘
Do you want full access?
Subscribe today to unlock all pages.
Trusted by 1+ million students worldwide
3MIS771: DESCRIPTIVE ANALYTICS AND VISUALIZATION
building a strong customer base and strategic alliances with the existing clients of the magazine
as well as the newspaper industry. Additionally, they are also interested to develop a model so
that they can forecast the financial turnovers in the future quarters of the current financial year.
A survey has been conducted and the responses of the clients to the survey have been
analyzed empirically so that the nature of the customers of AusPaper can be understood. Further,
the perception of the customers towards the company and its products and also the likelihood
with the help of which a long term strategic alliance can be developed with the company have
been discussed in the following sections along with the findings of the analysis.
Data Collection
In order to meet the requirements asked by AusPaper, a market research company named
ANALYTICS7 have been hired. The analytics company have contacted with the existing clients
of AusPaper and have asked them to fill up an online survey form. There was information about
the key analyzing factors that will be necessary for the objectives of the analysis. Further,
historical data on the annual sales turnover in four quarters have also been collected from the
data warehouse of AusPaper in order to forecast the future sales.
Data Description
Data have been collected from 200 customers on 18 variables or factors. This data is
collected directly from the potential customers for the purpose of the research and thus this data
is known as primary data. There are data on two different aspects in the primary dataset. The first
aspect contained the perceptions of the clients on the performance of AusPaper. The performance
of the company was rated on 13 different aspects by the clients. The performance was scaled on
a ordinal scale of 0 – 10, with 0 representing “Poor Performance” and 10 indicating “Excellent
Paraphrase This Document
Need a fresh take? Get an instant paraphrase of this document with our AI Paraphraser
4MIS771: DESCRIPTIVE ANALYTICS AND VISUALIZATION
Performance”. The second aspect of the data was the outcomes of the purchase and the
relationship with the business. For example, satisfaction of the customers with the products of
AusPaper and whether the responding firm of the client is interested in forming a strategic
alliance with the company. This variable has responses with a binary scale of “Yes” or “No”.
The other aspect involved the market size claimed by the client, the length of time the client has
purchase relationship with the company and the sales turnover of the company recorded
quarterly over the years and obtained from the data warehouse of AusPaper.
Data Analysis
Analysis of the Dependent Variable
There are two dependent variables that has been considered in this study. These are
customer satisfaction, which has been scored on an ordinal scale of 1 – 10 and the interest of the
client whether to form a strategic alliance with AusPaper or not, which is binary variable
recording two responses “Yes” and “No”.
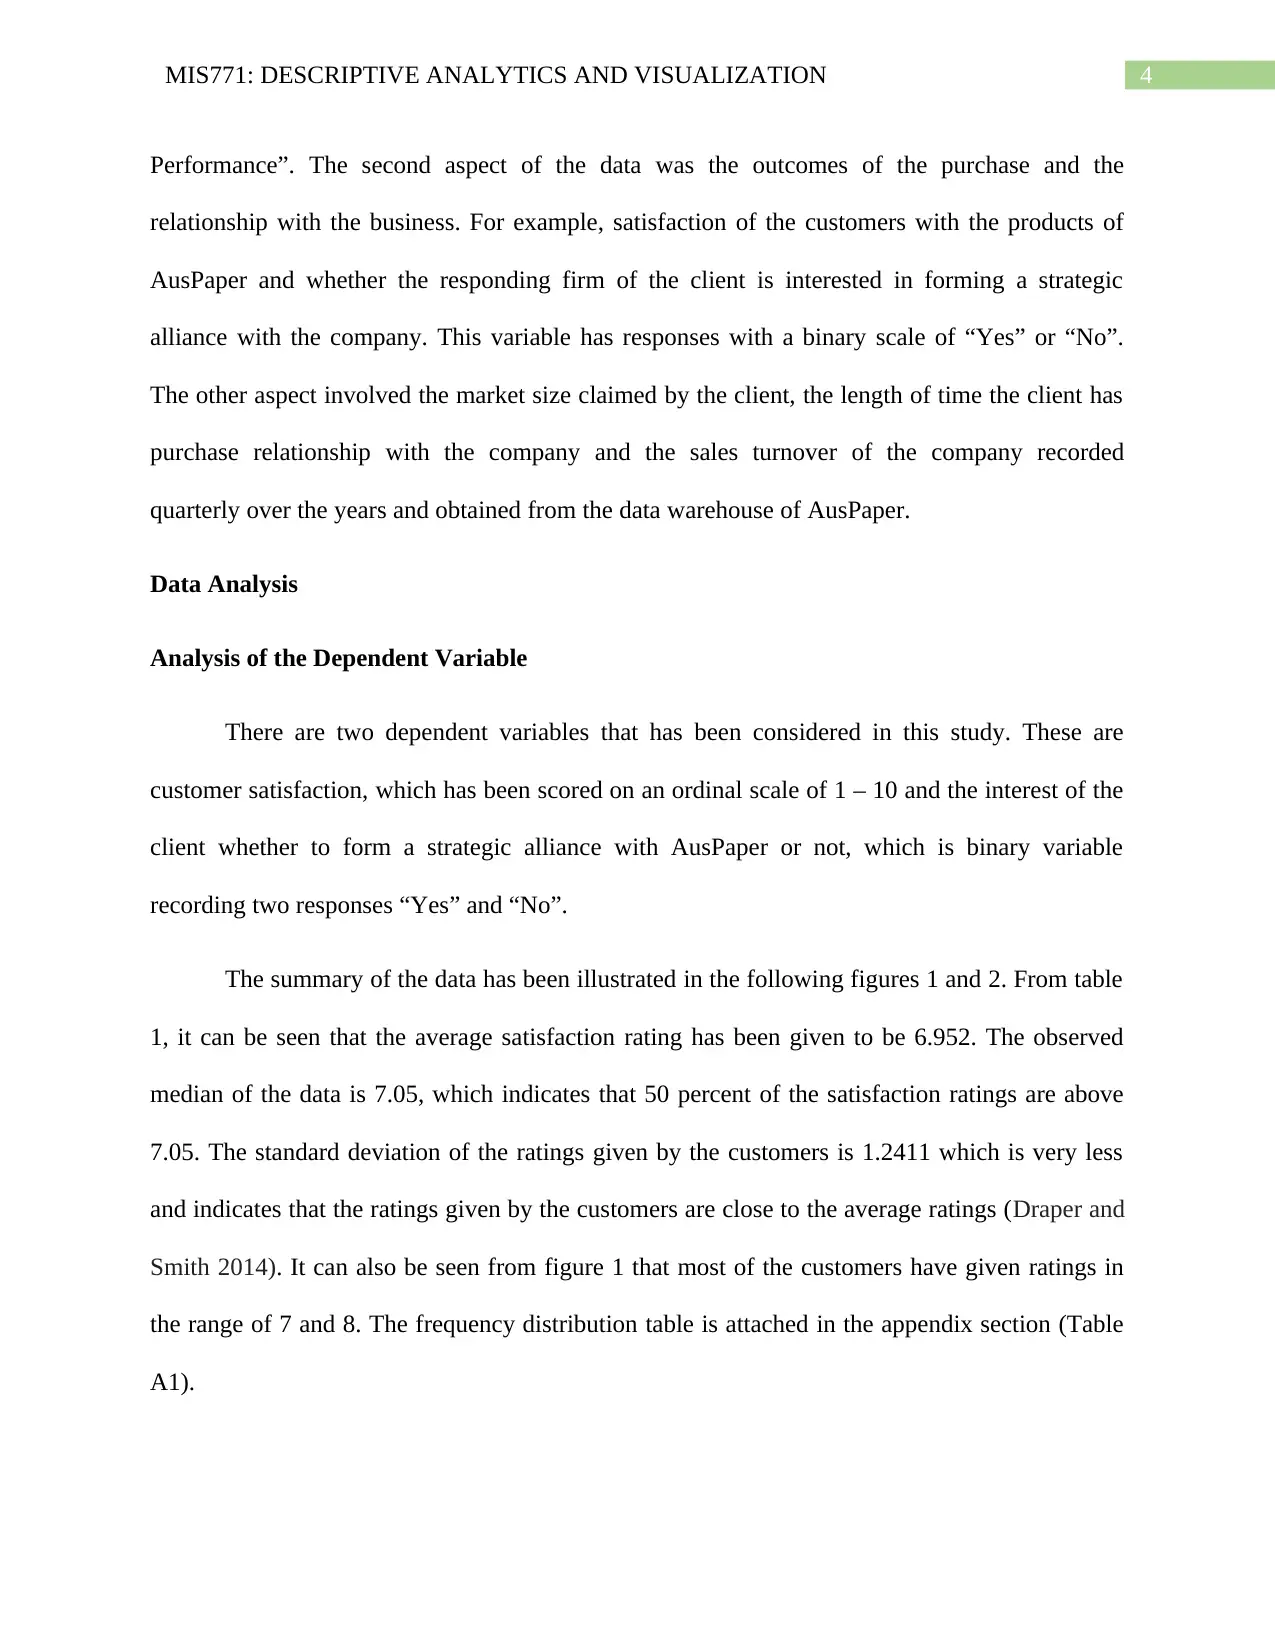
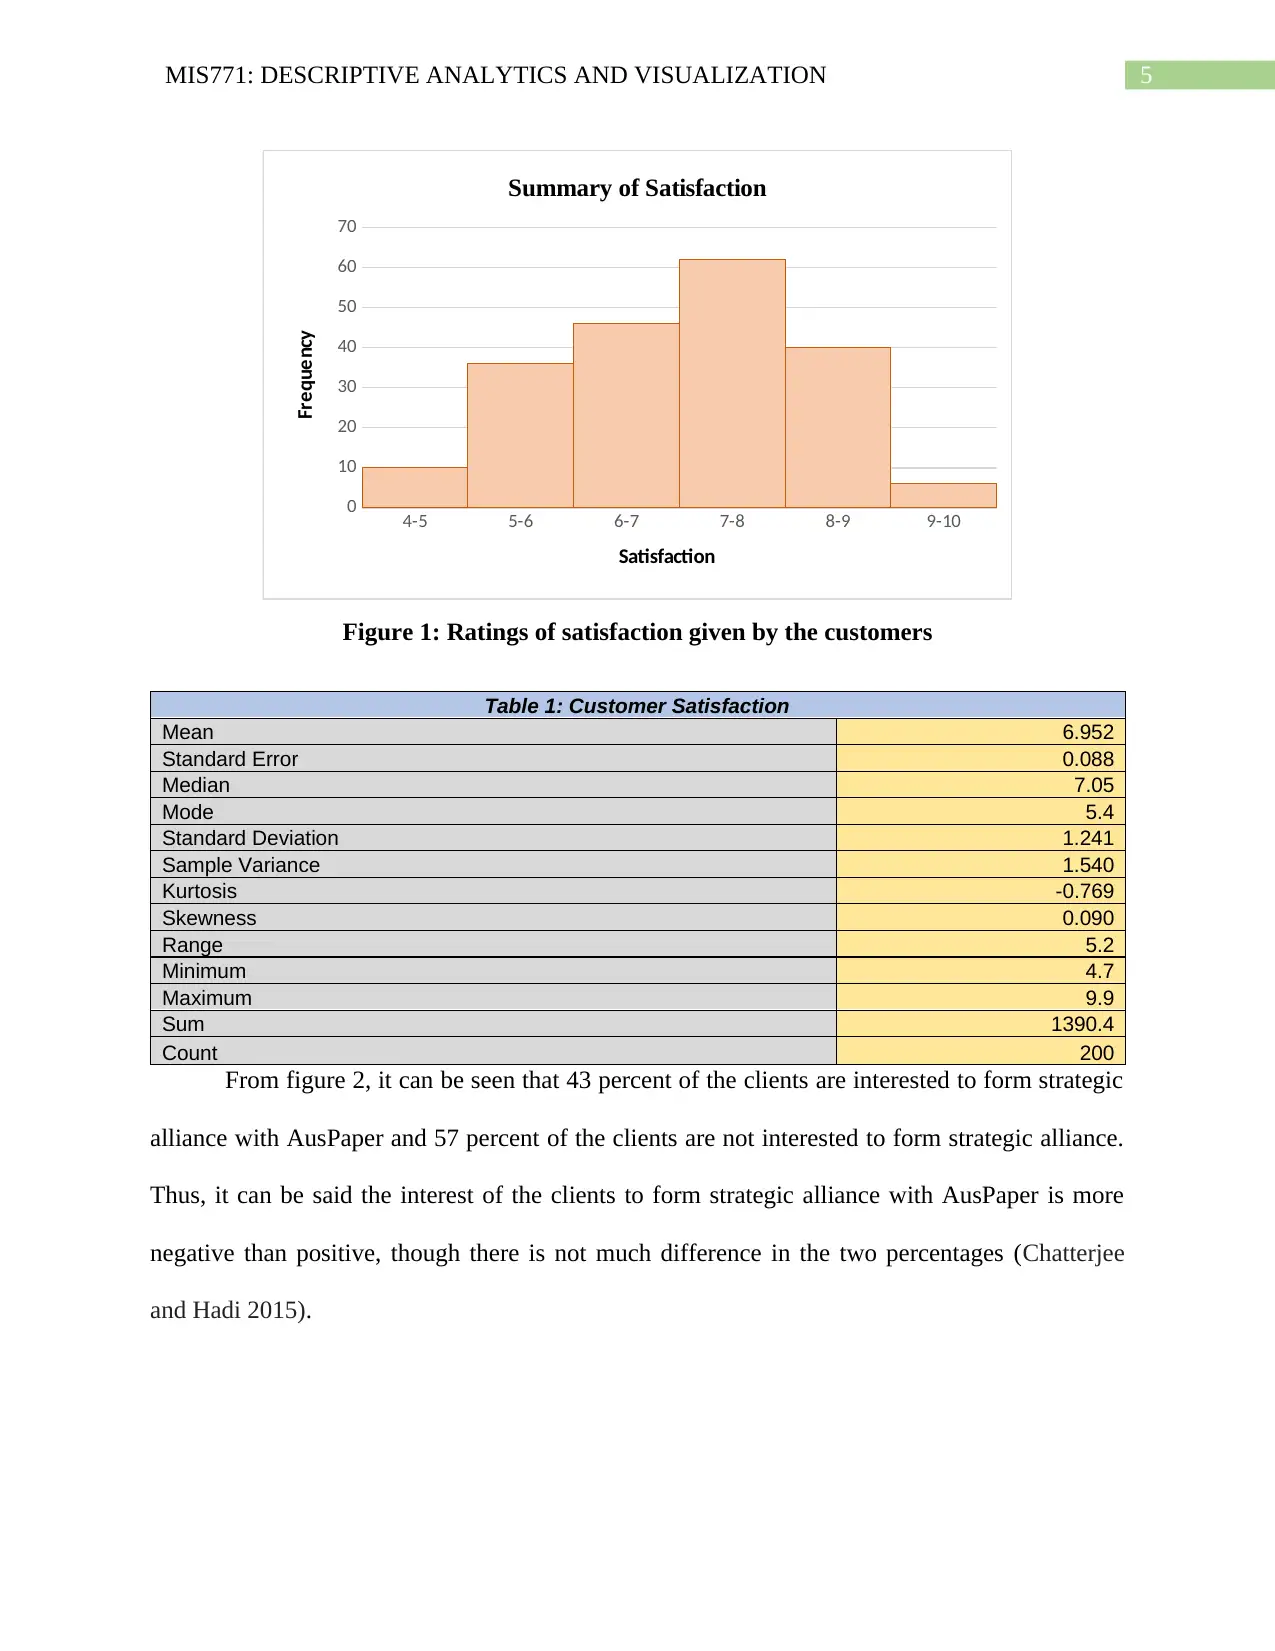
The summary of the data has been illustrated in the following figures 1 and 2. From table
1, it can be seen that the average satisfaction rating has been given to be 6.952. The observed
median of the data is 7.05, which indicates that 50 percent of the satisfaction ratings are above
7.05. The standard deviation of the ratings given by the customers is 1.2411 which is very less
and indicates that the ratings given by the customers are close to the average ratings (Draper and
Smith 2014). It can also be seen from figure 1 that most of the customers have given ratings in
the range of 7 and 8. The frequency distribution table is attached in the appendix section (Table
A1).
Performance”. The second aspect of the data was the outcomes of the purchase and the
relationship with the business. For example, satisfaction of the customers with the products of
AusPaper and whether the responding firm of the client is interested in forming a strategic
alliance with the company. This variable has responses with a binary scale of “Yes” or “No”.
The other aspect involved the market size claimed by the client, the length of time the client has
purchase relationship with the company and the sales turnover of the company recorded
quarterly over the years and obtained from the data warehouse of AusPaper.
Data Analysis
Analysis of the Dependent Variable
There are two dependent variables that has been considered in this study. These are
customer satisfaction, which has been scored on an ordinal scale of 1 – 10 and the interest of the
client whether to form a strategic alliance with AusPaper or not, which is binary variable
recording two responses “Yes” and “No”.
The summary of the data has been illustrated in the following figures 1 and 2. From table
1, it can be seen that the average satisfaction rating has been given to be 6.952. The observed
median of the data is 7.05, which indicates that 50 percent of the satisfaction ratings are above
7.05. The standard deviation of the ratings given by the customers is 1.2411 which is very less
and indicates that the ratings given by the customers are close to the average ratings (Draper and
Smith 2014). It can also be seen from figure 1 that most of the customers have given ratings in
the range of 7 and 8. The frequency distribution table is attached in the appendix section (Table
A1).
5MIS771: DESCRIPTIVE ANALYTICS AND VISUALIZATION
4-5 5-6 6-7 7-8 8-9 9-10
0
10
20
30
40
50
60
70
Summary of Satisfaction
Satisfaction
Frequency
Figure 1: Ratings of satisfaction given by the customers
Table 1: Customer Satisfaction
Mean 6.952
Standard Error 0.088
Median 7.05
Mode 5.4
Standard Deviation 1.241
Sample Variance 1.540
Kurtosis -0.769
Skewness 0.090
Range 5.2
Minimum 4.7
Maximum 9.9
Sum 1390.4
Count 200
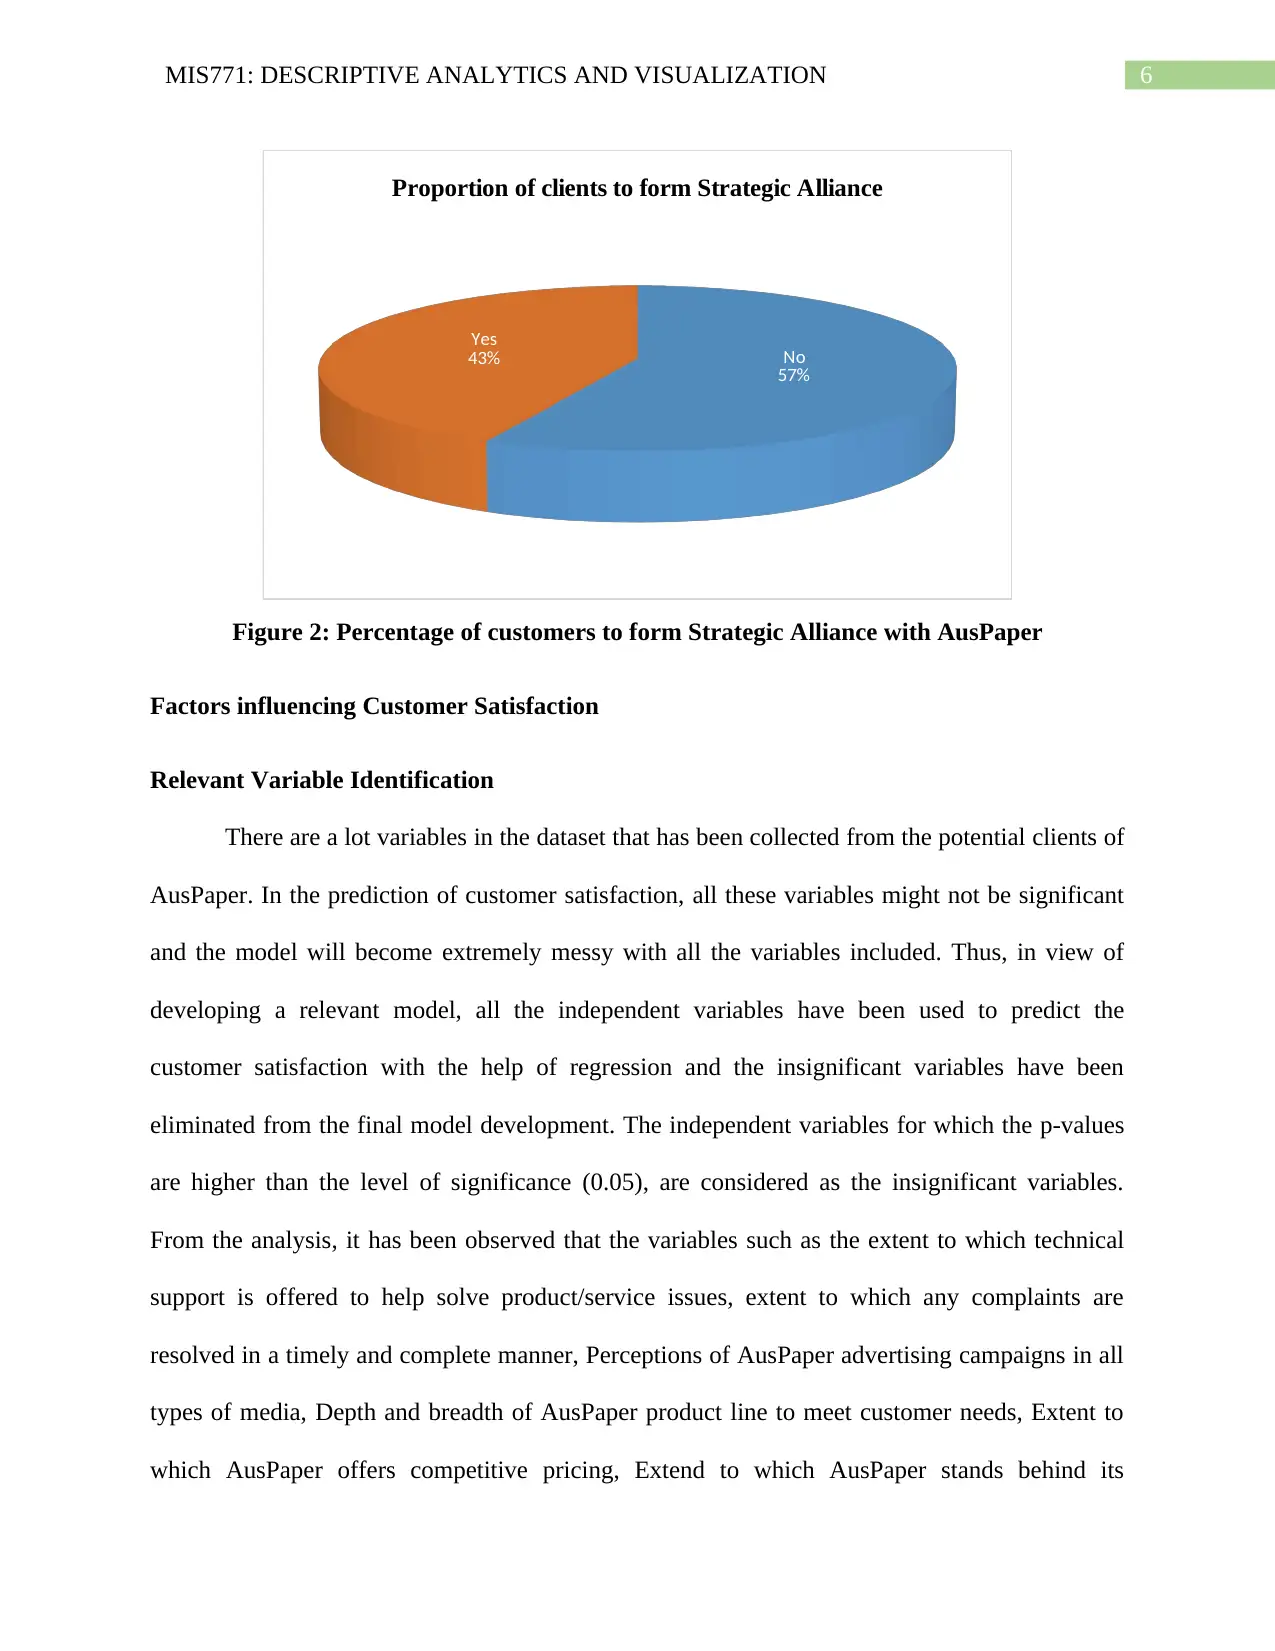
From figure 2, it can be seen that 43 percent of the clients are interested to form strategic
alliance with AusPaper and 57 percent of the clients are not interested to form strategic alliance.
Thus, it can be said the interest of the clients to form strategic alliance with AusPaper is more
negative than positive, though there is not much difference in the two percentages (Chatterjee
and Hadi 2015).
4-5 5-6 6-7 7-8 8-9 9-10
0
10
20
30
40
50
60
70
Summary of Satisfaction
Satisfaction
Frequency
Figure 1: Ratings of satisfaction given by the customers
Table 1: Customer Satisfaction
Mean 6.952
Standard Error 0.088
Median 7.05
Mode 5.4
Standard Deviation 1.241
Sample Variance 1.540
Kurtosis -0.769
Skewness 0.090
Range 5.2
Minimum 4.7
Maximum 9.9
Sum 1390.4
Count 200
From figure 2, it can be seen that 43 percent of the clients are interested to form strategic
alliance with AusPaper and 57 percent of the clients are not interested to form strategic alliance.
Thus, it can be said the interest of the clients to form strategic alliance with AusPaper is more
negative than positive, though there is not much difference in the two percentages (Chatterjee
and Hadi 2015).
⊘ This is a preview!⊘
Do you want full access?
Subscribe today to unlock all pages.
Trusted by 1+ million students worldwide
6MIS771: DESCRIPTIVE ANALYTICS AND VISUALIZATION
No
57%
Yes
43%
Proportion of clients to form Strategic Alliance
Figure 2: Percentage of customers to form Strategic Alliance with AusPaper
Factors influencing Customer Satisfaction
Relevant Variable Identification
There are a lot variables in the dataset that has been collected from the potential clients of
AusPaper. In the prediction of customer satisfaction, all these variables might not be significant
and the model will become extremely messy with all the variables included. Thus, in view of
developing a relevant model, all the independent variables have been used to predict the
customer satisfaction with the help of regression and the insignificant variables have been
eliminated from the final model development. The independent variables for which the p-values
are higher than the level of significance (0.05), are considered as the insignificant variables.
From the analysis, it has been observed that the variables such as the extent to which technical
support is offered to help solve product/service issues, extent to which any complaints are
resolved in a timely and complete manner, Perceptions of AusPaper advertising campaigns in all
types of media, Depth and breadth of AusPaper product line to meet customer needs, Extent to
which AusPaper offers competitive pricing, Extend to which AusPaper stands behind its
Paraphrase This Document
Need a fresh take? Get an instant paraphrase of this document with our AI Paraphraser
7MIS771: DESCRIPTIVE ANALYTICS AND VISUALIZATION
product/service warranties and claims, Extent to which AusPaper develops and sells new
products, Perception that ordering and billing is handled efficiently and correctly, Perceived
willingness of AusPaper sales reps to negotiate price on purchases of paper products and Amount
of time it takes to deliver the paper products once an order has been confirmed are considered
insignificant as the p-values are higher than 0.05 (Kleinbaum et al. 2013) . The remaining
variables such as the product quality, Overall image of AusPaper's website, especially user-
friendliness and Overall image of AusPaper's salesforce have been considered significant for the
model.
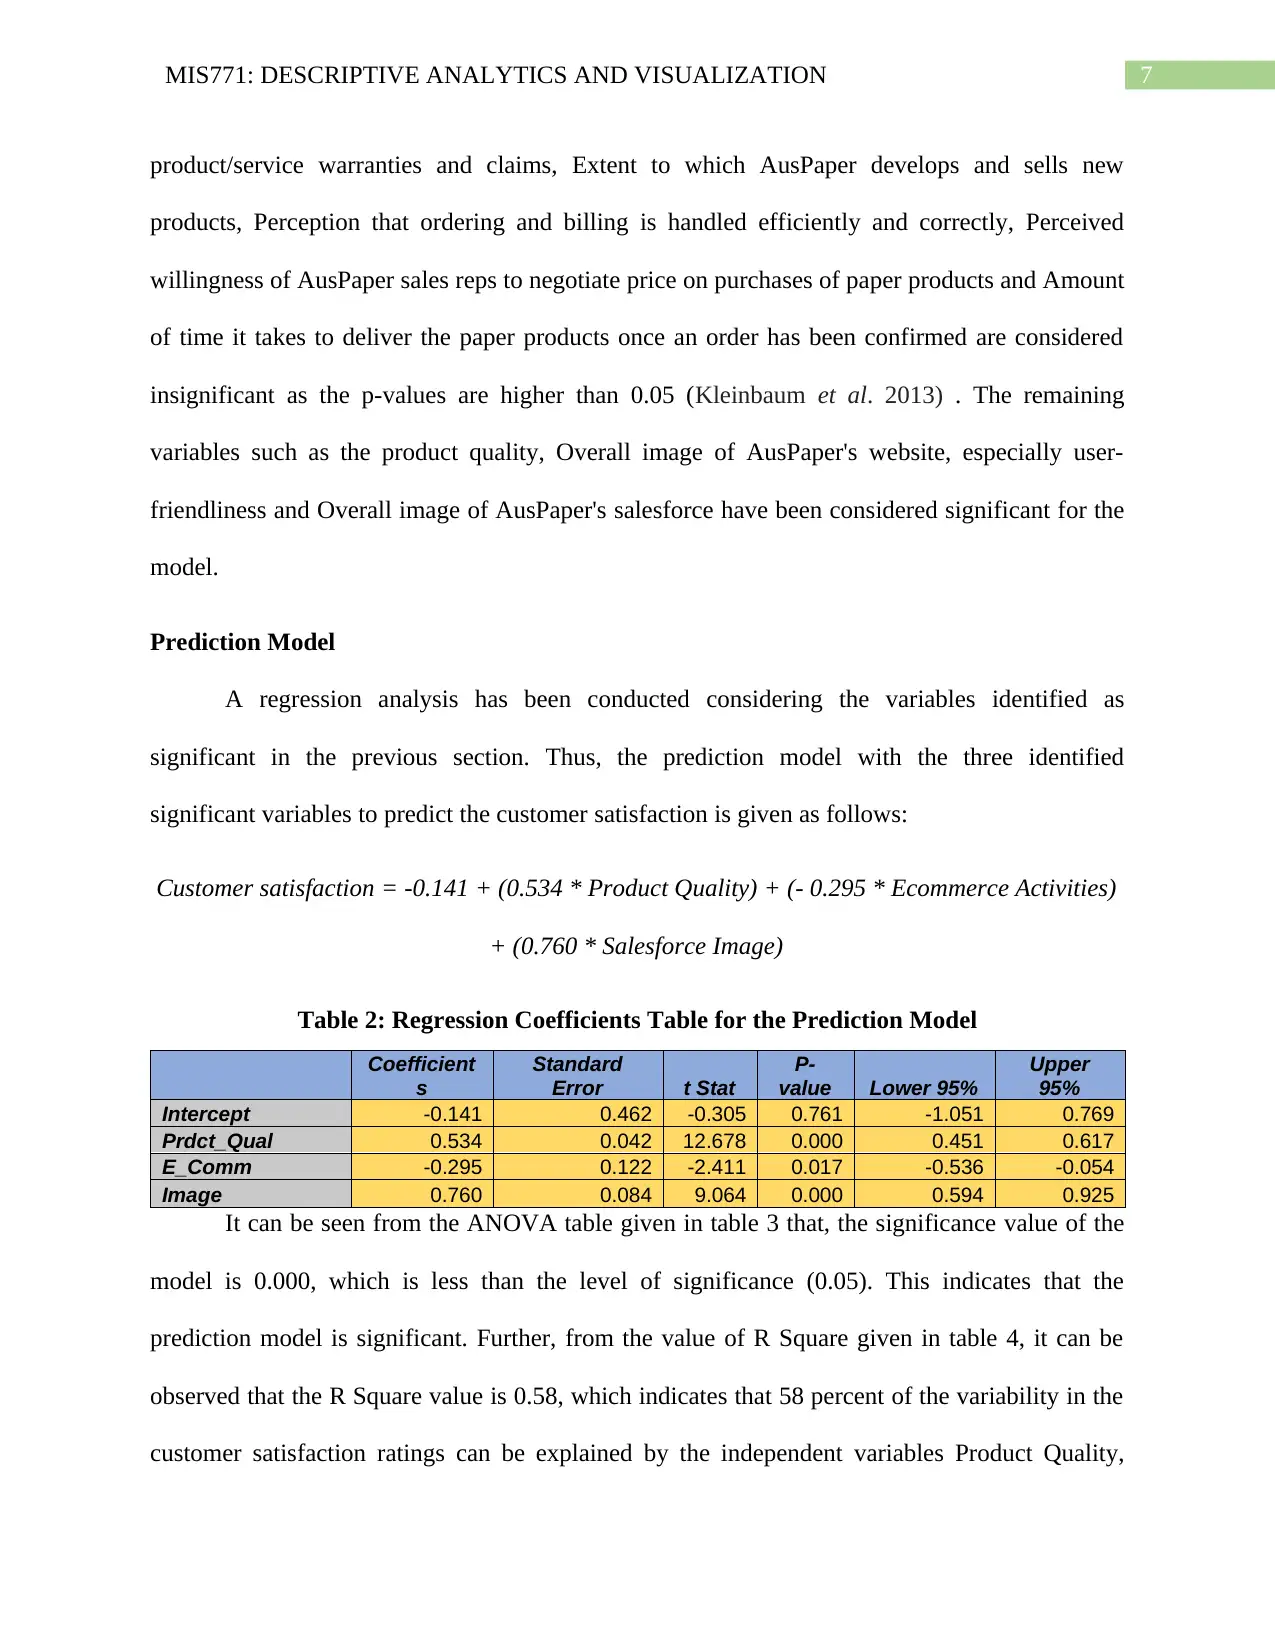
Prediction Model
A regression analysis has been conducted considering the variables identified as
significant in the previous section. Thus, the prediction model with the three identified
significant variables to predict the customer satisfaction is given as follows:
Customer satisfaction = -0.141 + (0.534 * Product Quality) + (- 0.295 * Ecommerce Activities)
+ (0.760 * Salesforce Image)
Table 2: Regression Coefficients Table for the Prediction Model
Coefficient
s
Standard
Error t Stat
P-
value Lower 95%
Upper
95%
Intercept -0.141 0.462 -0.305 0.761 -1.051 0.769
Prdct_Qual 0.534 0.042 12.678 0.000 0.451 0.617
E_Comm -0.295 0.122 -2.411 0.017 -0.536 -0.054
Image 0.760 0.084 9.064 0.000 0.594 0.925
It can be seen from the ANOVA table given in table 3 that, the significance value of the
model is 0.000, which is less than the level of significance (0.05). This indicates that the
prediction model is significant. Further, from the value of R Square given in table 4, it can be
observed that the R Square value is 0.58, which indicates that 58 percent of the variability in the
customer satisfaction ratings can be explained by the independent variables Product Quality,
product/service warranties and claims, Extent to which AusPaper develops and sells new
products, Perception that ordering and billing is handled efficiently and correctly, Perceived
willingness of AusPaper sales reps to negotiate price on purchases of paper products and Amount
of time it takes to deliver the paper products once an order has been confirmed are considered
insignificant as the p-values are higher than 0.05 (Kleinbaum et al. 2013) . The remaining
variables such as the product quality, Overall image of AusPaper's website, especially user-
friendliness and Overall image of AusPaper's salesforce have been considered significant for the
model.
Prediction Model
A regression analysis has been conducted considering the variables identified as
significant in the previous section. Thus, the prediction model with the three identified
significant variables to predict the customer satisfaction is given as follows:
Customer satisfaction = -0.141 + (0.534 * Product Quality) + (- 0.295 * Ecommerce Activities)
+ (0.760 * Salesforce Image)
Table 2: Regression Coefficients Table for the Prediction Model
Coefficient
s
Standard
Error t Stat
P-
value Lower 95%
Upper
95%
Intercept -0.141 0.462 -0.305 0.761 -1.051 0.769
Prdct_Qual 0.534 0.042 12.678 0.000 0.451 0.617
E_Comm -0.295 0.122 -2.411 0.017 -0.536 -0.054
Image 0.760 0.084 9.064 0.000 0.594 0.925
It can be seen from the ANOVA table given in table 3 that, the significance value of the
model is 0.000, which is less than the level of significance (0.05). This indicates that the
prediction model is significant. Further, from the value of R Square given in table 4, it can be
observed that the R Square value is 0.58, which indicates that 58 percent of the variability in the
customer satisfaction ratings can be explained by the independent variables Product Quality,
8MIS771: DESCRIPTIVE ANALYTICS AND VISUALIZATION
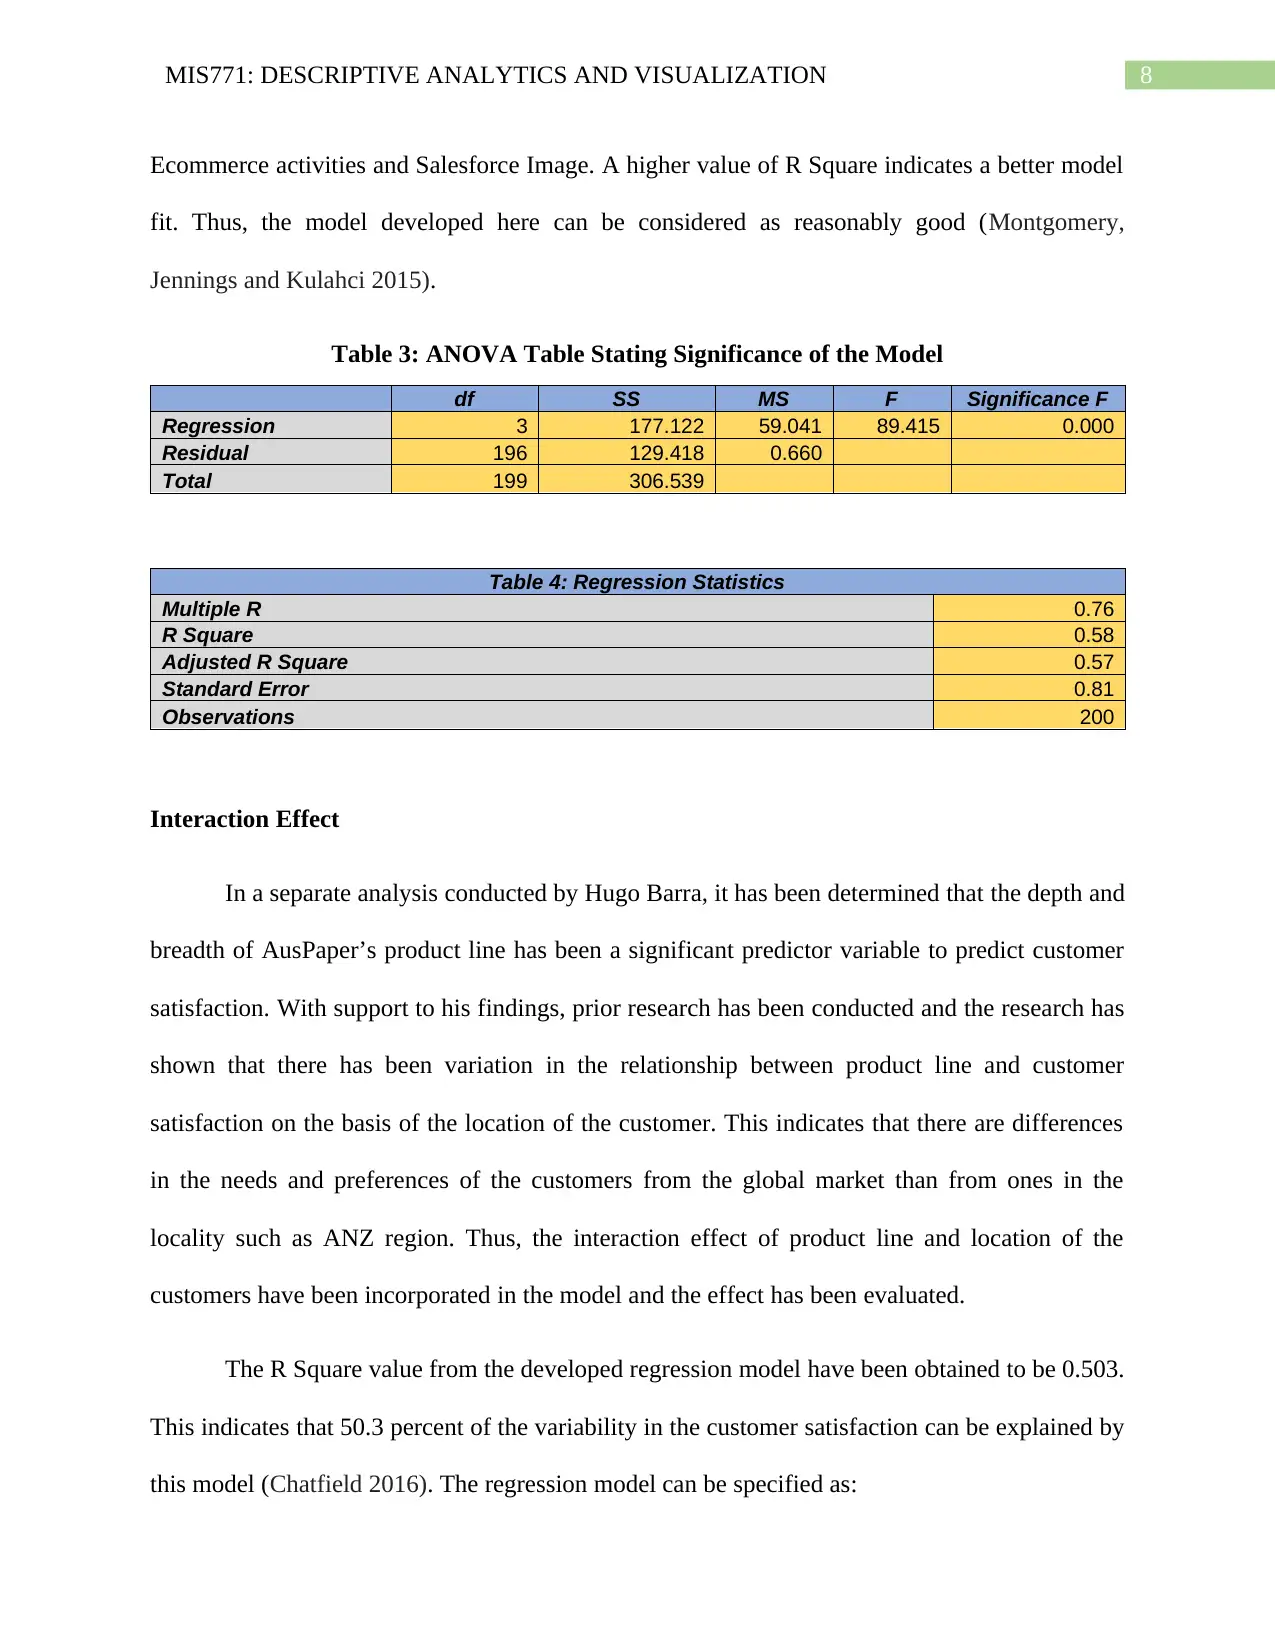
Ecommerce activities and Salesforce Image. A higher value of R Square indicates a better model
fit. Thus, the model developed here can be considered as reasonably good (Montgomery,
Jennings and Kulahci 2015).
Table 3: ANOVA Table Stating Significance of the Model
df SS MS F Significance F
Regression 3 177.122 59.041 89.415 0.000
Residual 196 129.418 0.660
Total 199 306.539
Table 4: Regression Statistics
Multiple R 0.76
R Square 0.58
Adjusted R Square 0.57
Standard Error 0.81
Observations 200
Interaction Effect
In a separate analysis conducted by Hugo Barra, it has been determined that the depth and
breadth of AusPaper’s product line has been a significant predictor variable to predict customer
satisfaction. With support to his findings, prior research has been conducted and the research has
shown that there has been variation in the relationship between product line and customer
satisfaction on the basis of the location of the customer. This indicates that there are differences
in the needs and preferences of the customers from the global market than from ones in the
locality such as ANZ region. Thus, the interaction effect of product line and location of the
customers have been incorporated in the model and the effect has been evaluated.
The R Square value from the developed regression model have been obtained to be 0.503.
This indicates that 50.3 percent of the variability in the customer satisfaction can be explained by
this model (Chatfield 2016). The regression model can be specified as:
⊘ This is a preview!⊘
Do you want full access?
Subscribe today to unlock all pages.
Trusted by 1+ million students worldwide
9MIS771: DESCRIPTIVE ANALYTICS AND VISUALIZATION
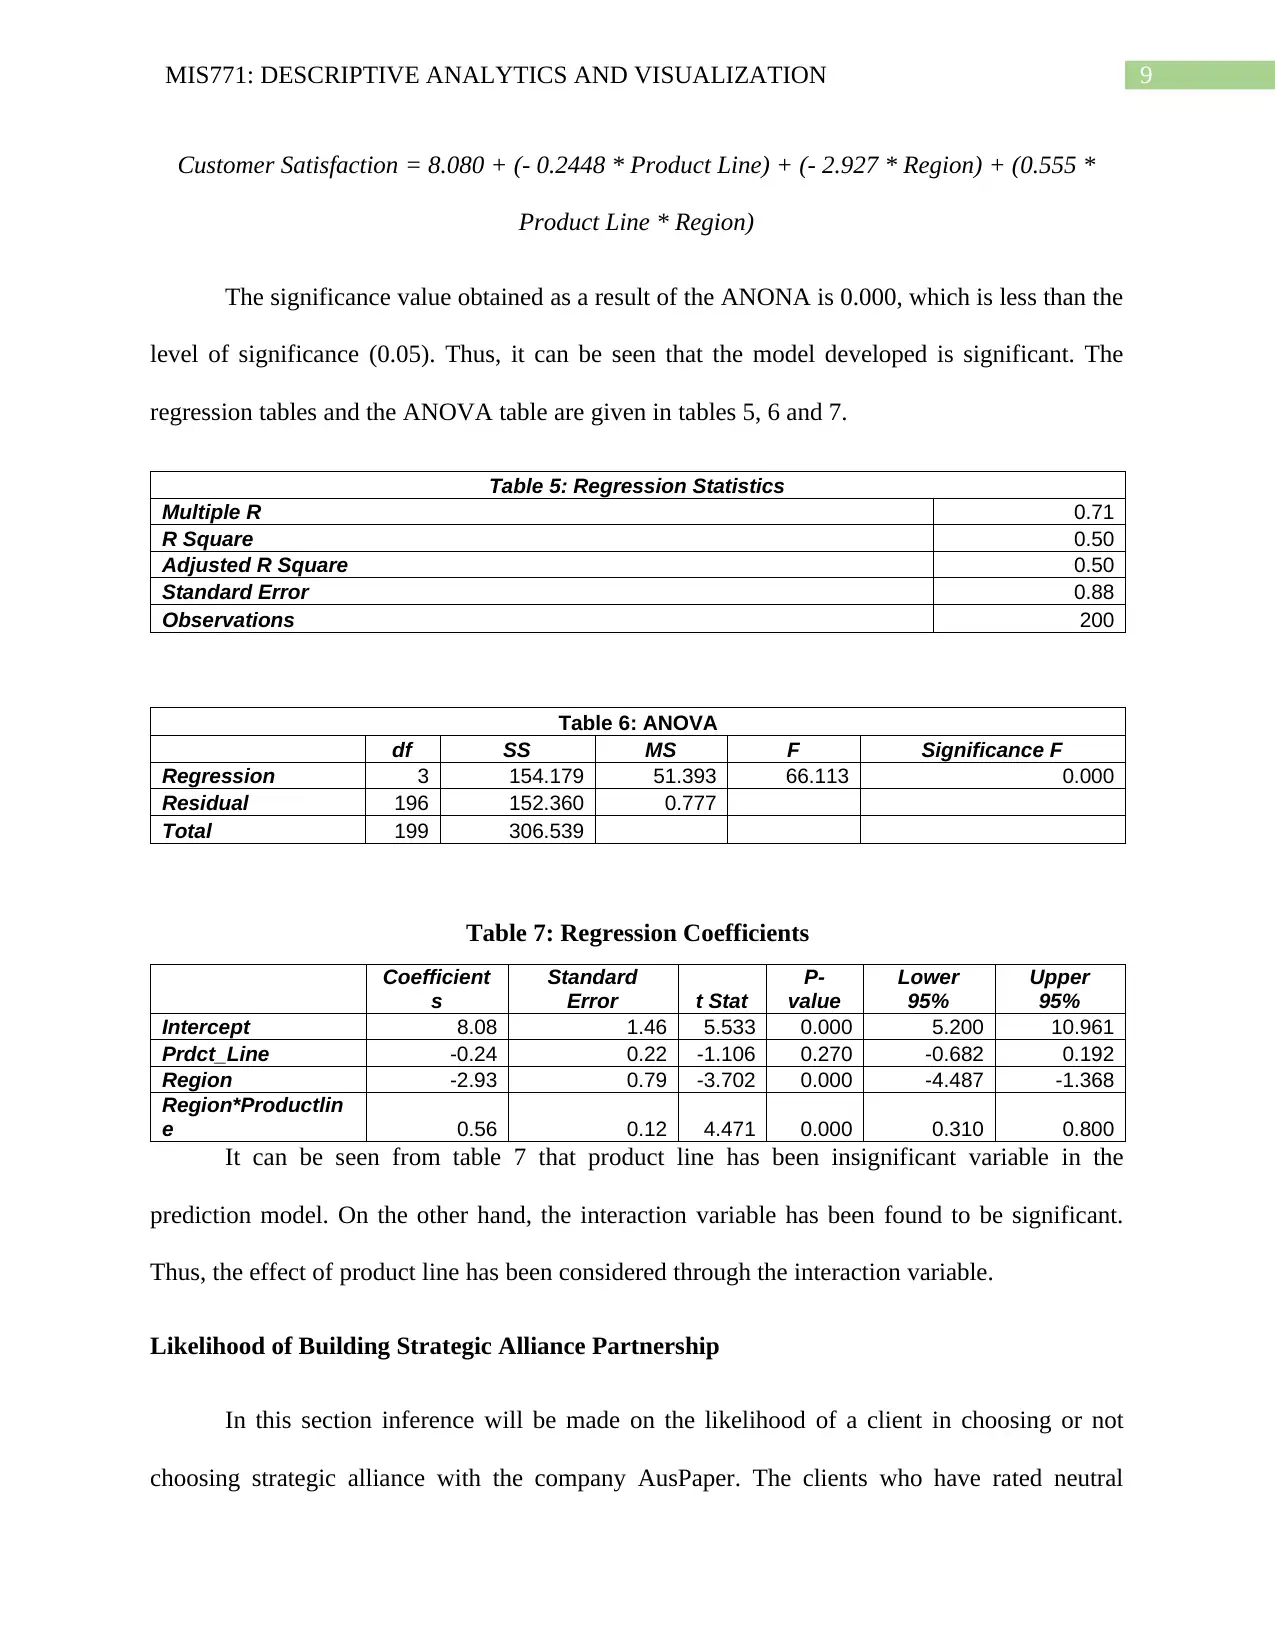
Customer Satisfaction = 8.080 + (- 0.2448 * Product Line) + (- 2.927 * Region) + (0.555 *
Product Line * Region)
The significance value obtained as a result of the ANONA is 0.000, which is less than the
level of significance (0.05). Thus, it can be seen that the model developed is significant. The
regression tables and the ANOVA table are given in tables 5, 6 and 7.
Table 5: Regression Statistics
Multiple R 0.71
R Square 0.50
Adjusted R Square 0.50
Standard Error 0.88
Observations 200
Table 6: ANOVA
df SS MS F Significance F
Regression 3 154.179 51.393 66.113 0.000
Residual 196 152.360 0.777
Total 199 306.539
Table 7: Regression Coefficients
Coefficient
s
Standard
Error t Stat
P-
value
Lower
95%
Upper
95%
Intercept 8.08 1.46 5.533 0.000 5.200 10.961
Prdct_Line -0.24 0.22 -1.106 0.270 -0.682 0.192
Region -2.93 0.79 -3.702 0.000 -4.487 -1.368
Region*Productlin
e 0.56 0.12 4.471 0.000 0.310 0.800
It can be seen from table 7 that product line has been insignificant variable in the
prediction model. On the other hand, the interaction variable has been found to be significant.
Thus, the effect of product line has been considered through the interaction variable.
Likelihood of Building Strategic Alliance Partnership
In this section inference will be made on the likelihood of a client in choosing or not
choosing strategic alliance with the company AusPaper. The clients who have rated neutral
Paraphrase This Document
Need a fresh take? Get an instant paraphrase of this document with our AI Paraphraser
10MIS771: DESCRIPTIVE ANALYTICS AND VISUALIZATION
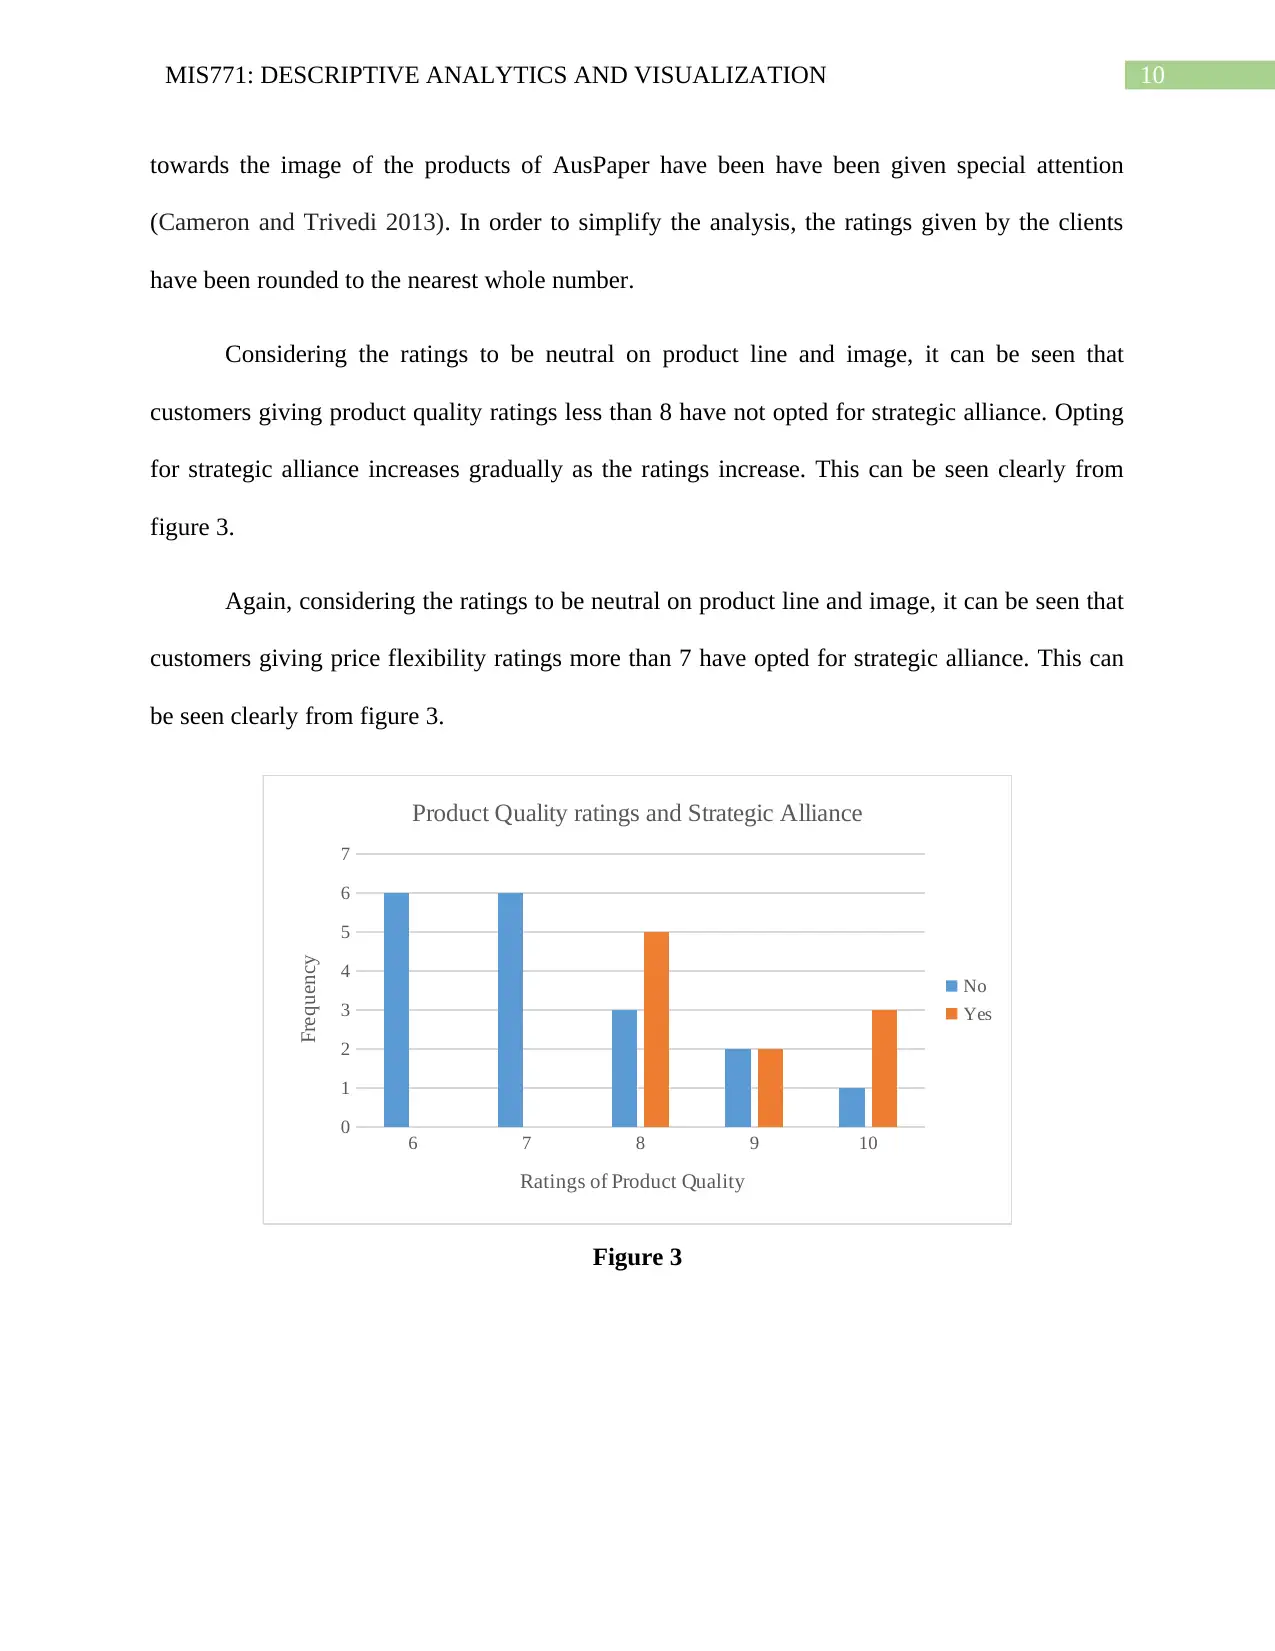
towards the image of the products of AusPaper have been have been given special attention
(Cameron and Trivedi 2013). In order to simplify the analysis, the ratings given by the clients
have been rounded to the nearest whole number.
Considering the ratings to be neutral on product line and image, it can be seen that
customers giving product quality ratings less than 8 have not opted for strategic alliance. Opting
for strategic alliance increases gradually as the ratings increase. This can be seen clearly from
figure 3.
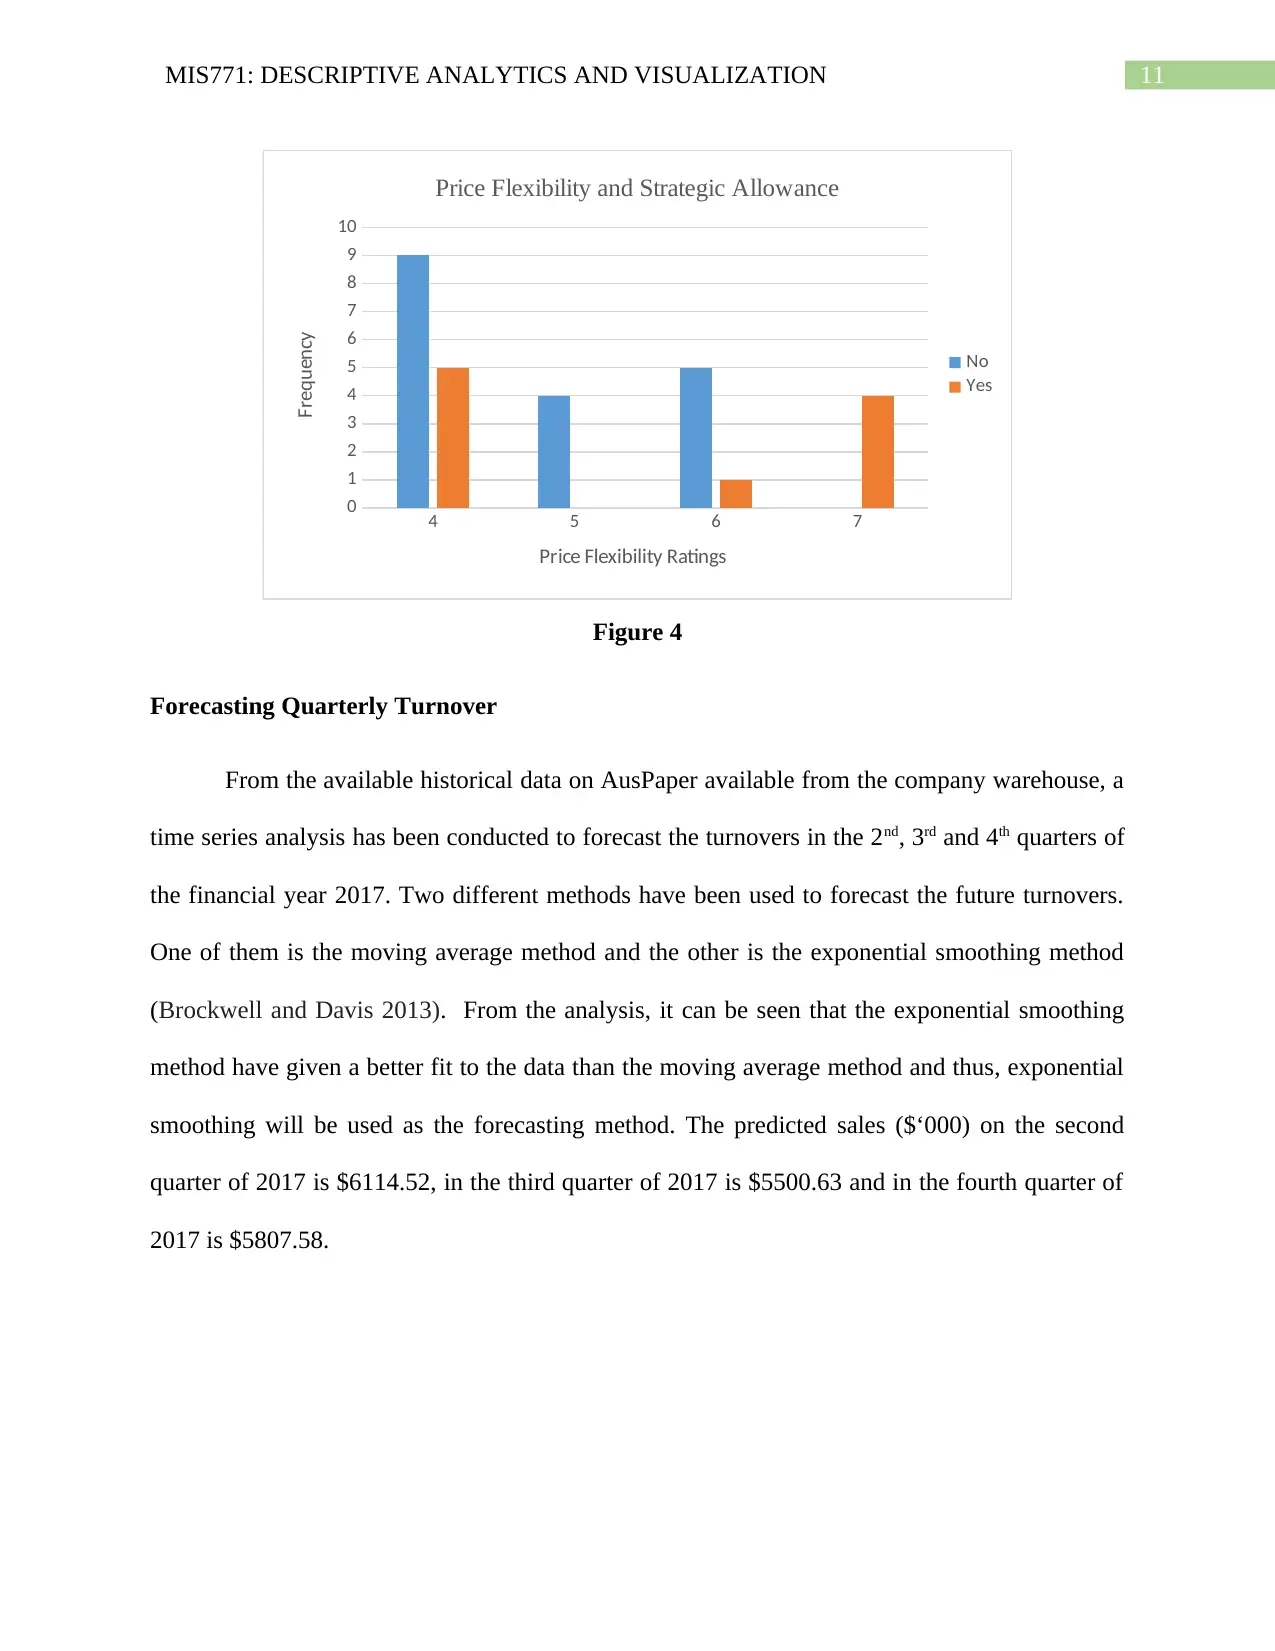
Again, considering the ratings to be neutral on product line and image, it can be seen that
customers giving price flexibility ratings more than 7 have opted for strategic alliance. This can
be seen clearly from figure 3.
6 7 8 9 10
0
1
2
3
4
5
6
7
Product Quality ratings and Strategic Alliance
No
Yes
Ratings of Product Quality
Frequency
Figure 3
towards the image of the products of AusPaper have been have been given special attention
(Cameron and Trivedi 2013). In order to simplify the analysis, the ratings given by the clients
have been rounded to the nearest whole number.
Considering the ratings to be neutral on product line and image, it can be seen that
customers giving product quality ratings less than 8 have not opted for strategic alliance. Opting
for strategic alliance increases gradually as the ratings increase. This can be seen clearly from
figure 3.
Again, considering the ratings to be neutral on product line and image, it can be seen that
customers giving price flexibility ratings more than 7 have opted for strategic alliance. This can
be seen clearly from figure 3.
6 7 8 9 10
0
1
2
3
4
5
6
7
Product Quality ratings and Strategic Alliance
No
Yes
Ratings of Product Quality
Frequency
Figure 3
11MIS771: DESCRIPTIVE ANALYTICS AND VISUALIZATION
4 5 6 7
0
1
2
3
4
5
6
7
8
9
10
Price Flexibility and Strategic Allowance
No
Yes
Price Flexibility Ratings
Frequency
Figure 4
Forecasting Quarterly Turnover
From the available historical data on AusPaper available from the company warehouse, a
time series analysis has been conducted to forecast the turnovers in the 2nd, 3rd and 4th quarters of
the financial year 2017. Two different methods have been used to forecast the future turnovers.
One of them is the moving average method and the other is the exponential smoothing method
(Brockwell and Davis 2013). From the analysis, it can be seen that the exponential smoothing
method have given a better fit to the data than the moving average method and thus, exponential
smoothing will be used as the forecasting method. The predicted sales ($‘000) on the second
quarter of 2017 is $6114.52, in the third quarter of 2017 is $5500.63 and in the fourth quarter of
2017 is $5807.58.
⊘ This is a preview!⊘
Do you want full access?
Subscribe today to unlock all pages.
Trusted by 1+ million students worldwide
1 out of 14
Related Documents


Your All-in-One AI-Powered Toolkit for Academic Success.
+13062052269
info@desklib.com
Available 24*7 on WhatsApp / Email
![[object Object]](/_next/static/media/star-bottom.7253800d.svg)
Unlock your academic potential
Copyright © 2020–2026 A2Z Services. All Rights Reserved. Developed and managed by ZUCOL.