Data Analysis Report: Descriptive Analytics and Visualization Insights
VerifiedAdded on  2023/02/03
|8
|987
|57
Report
AI Summary
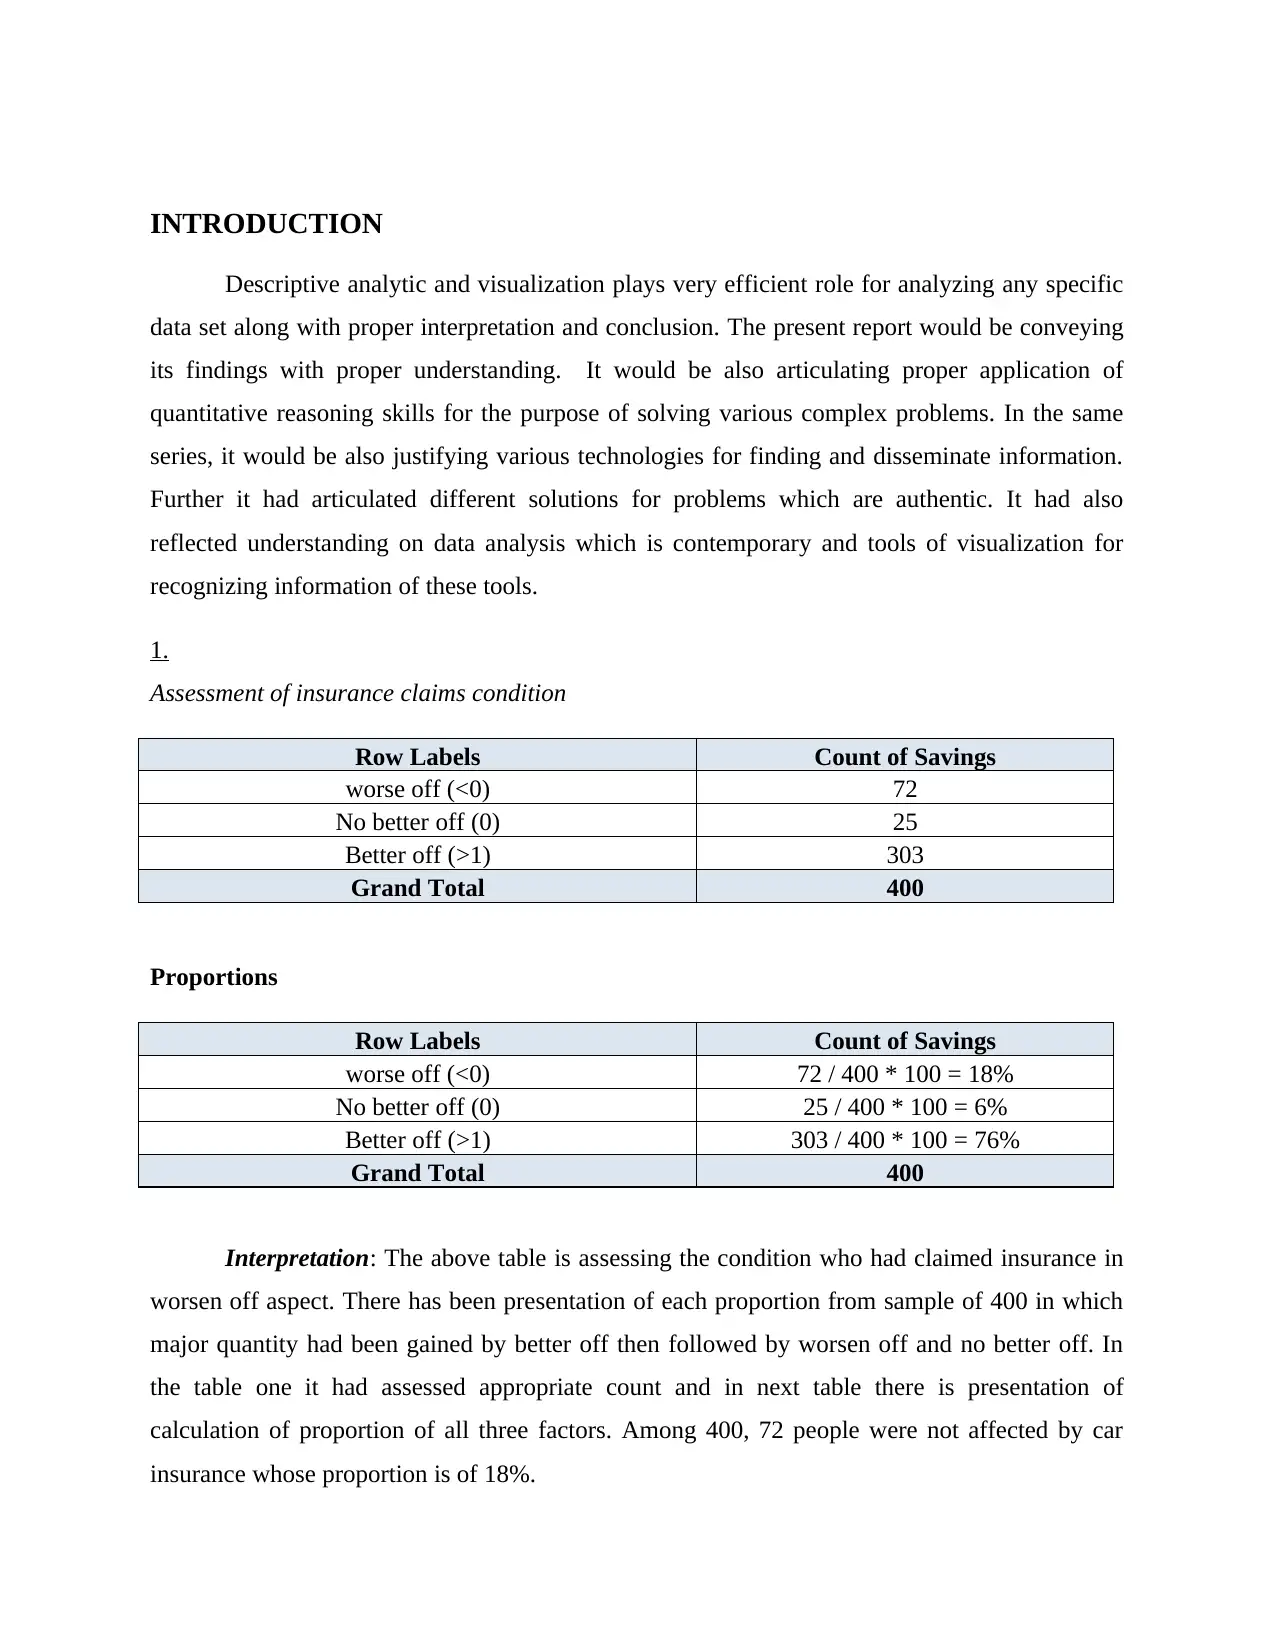
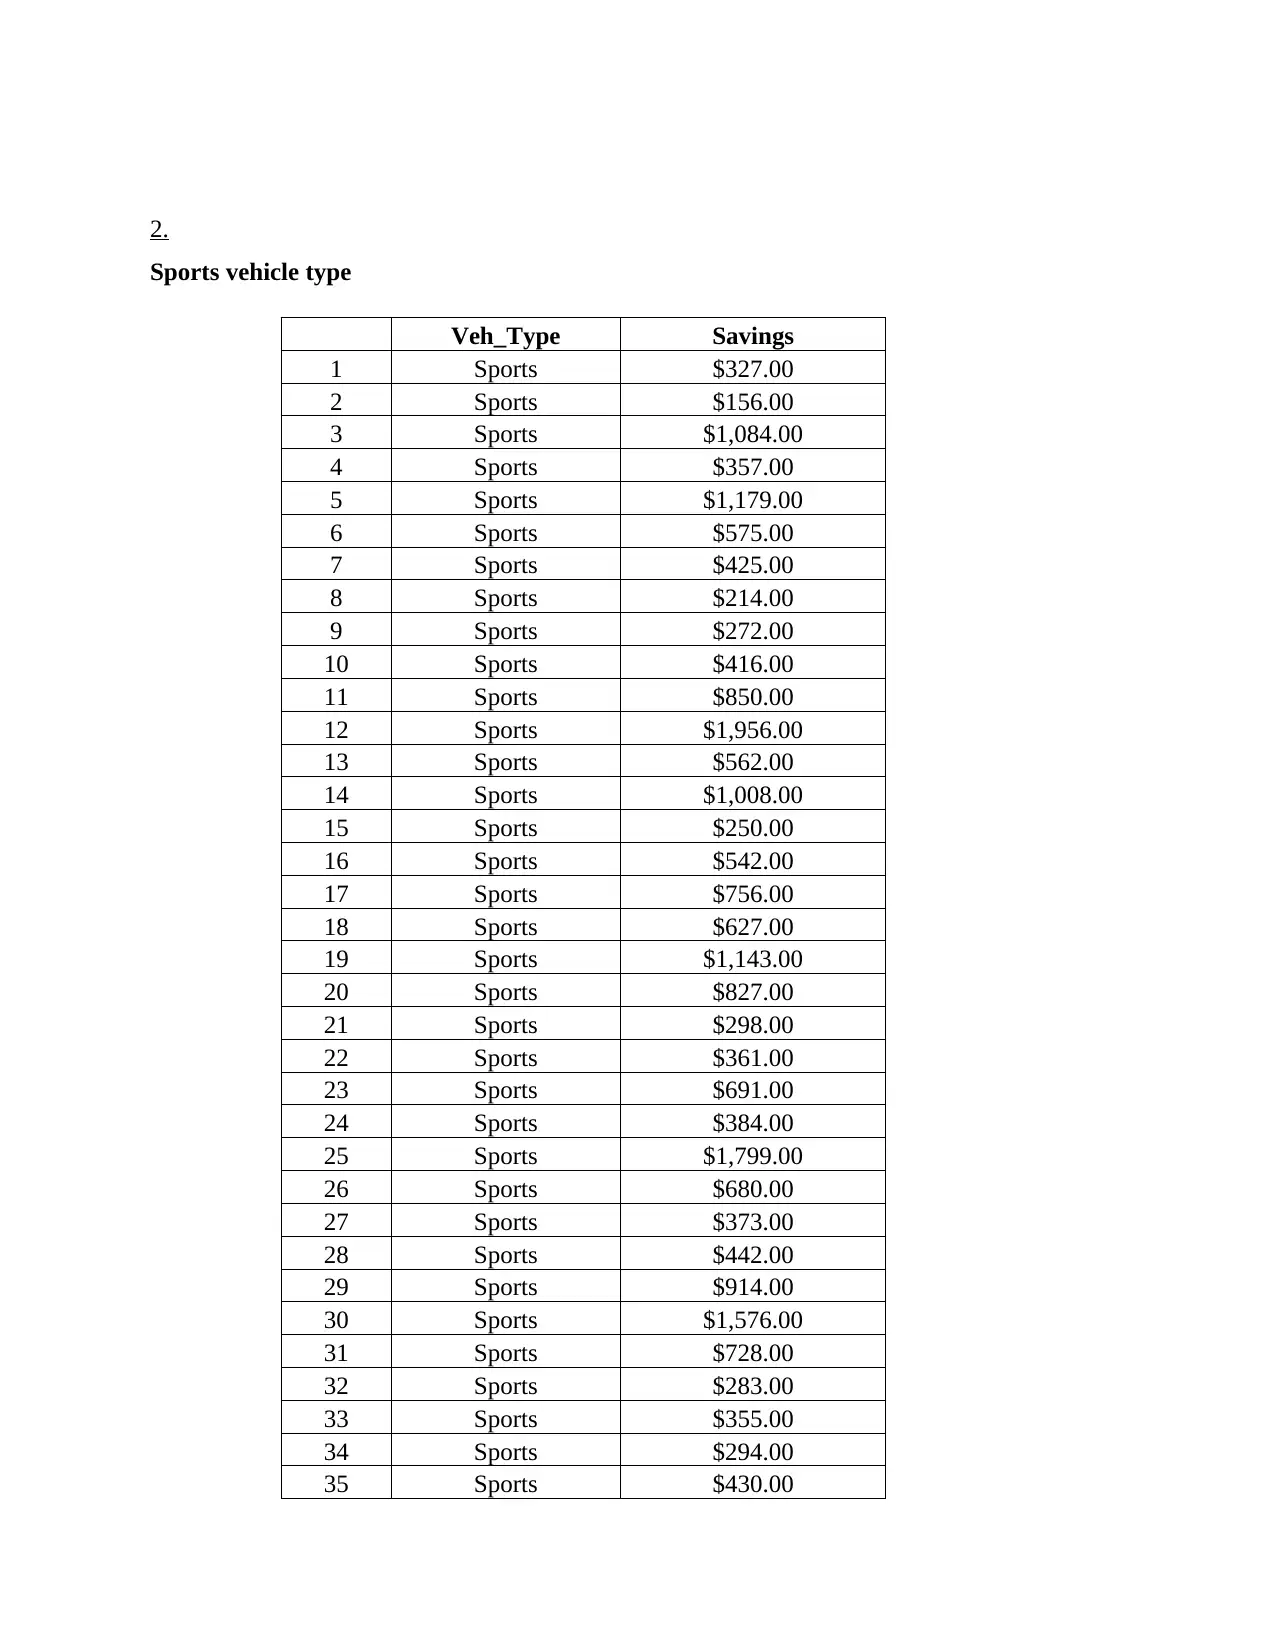
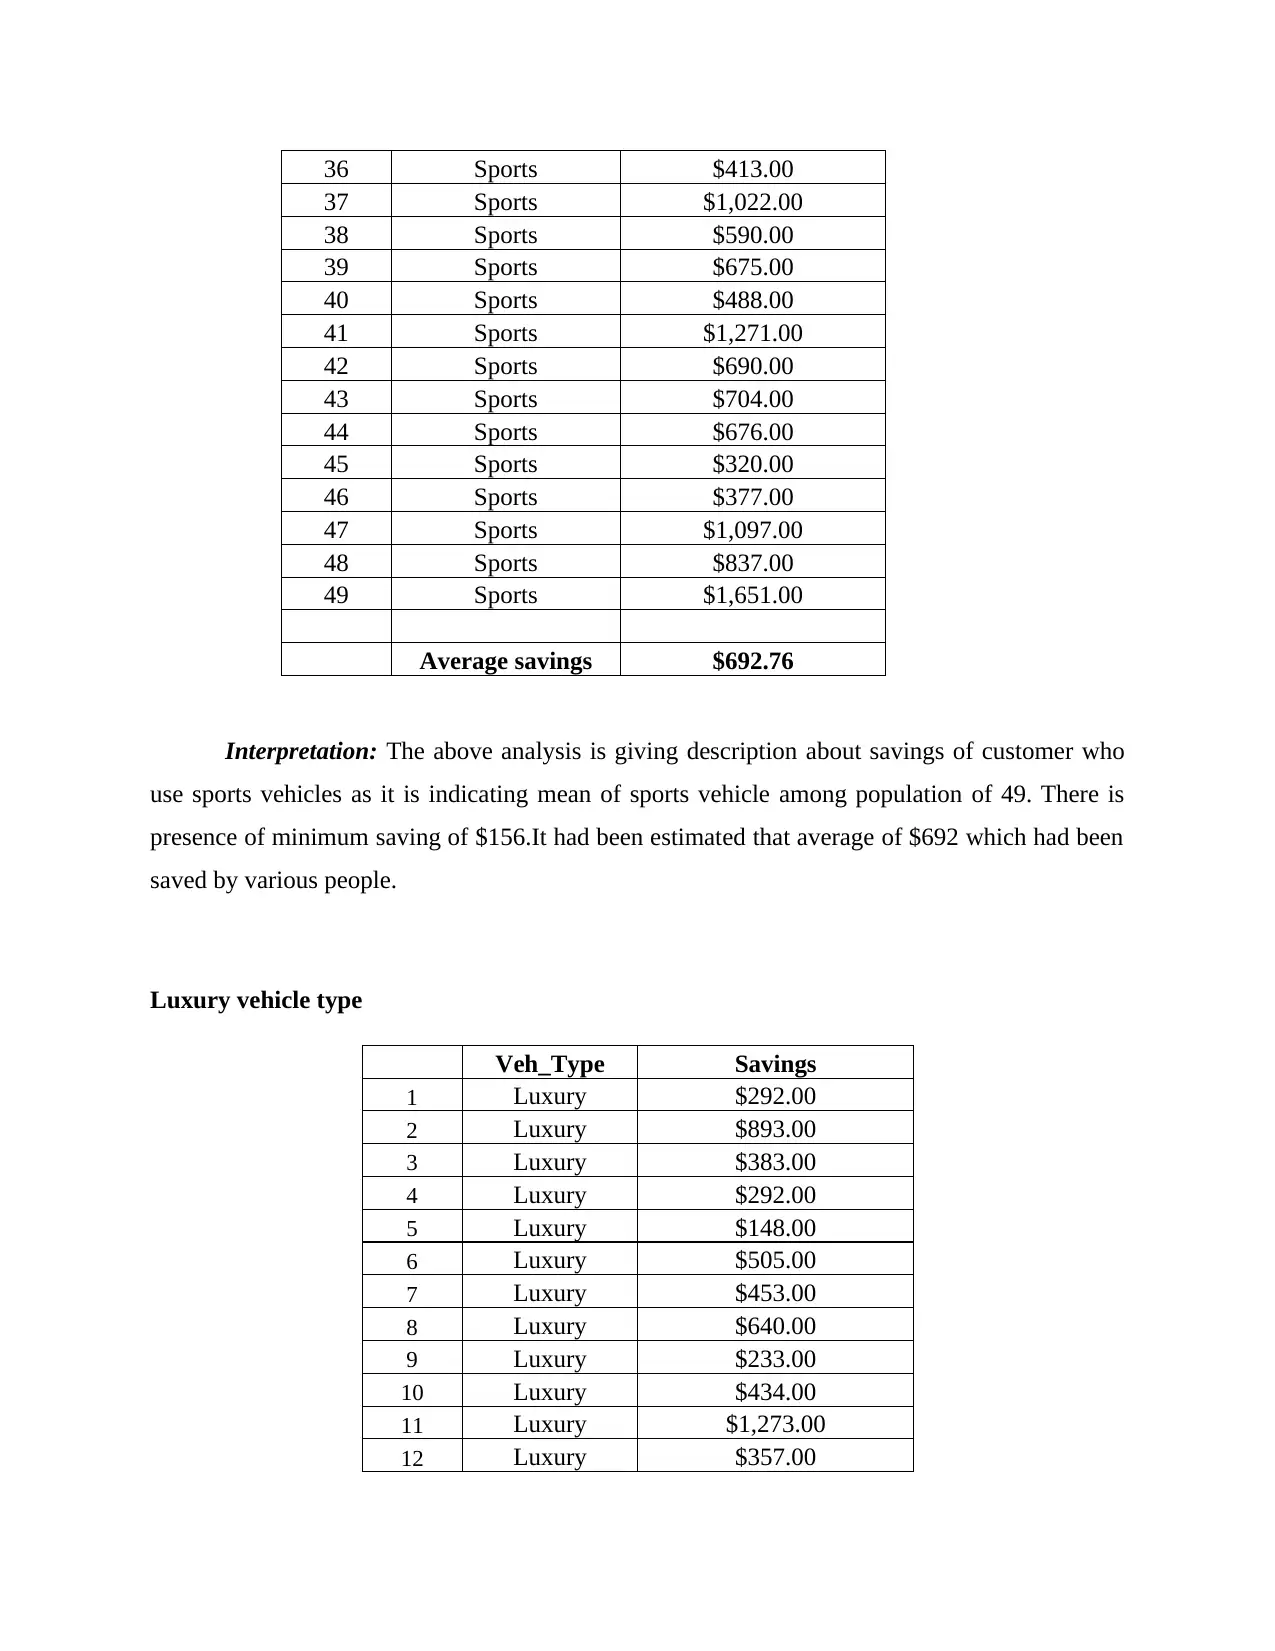
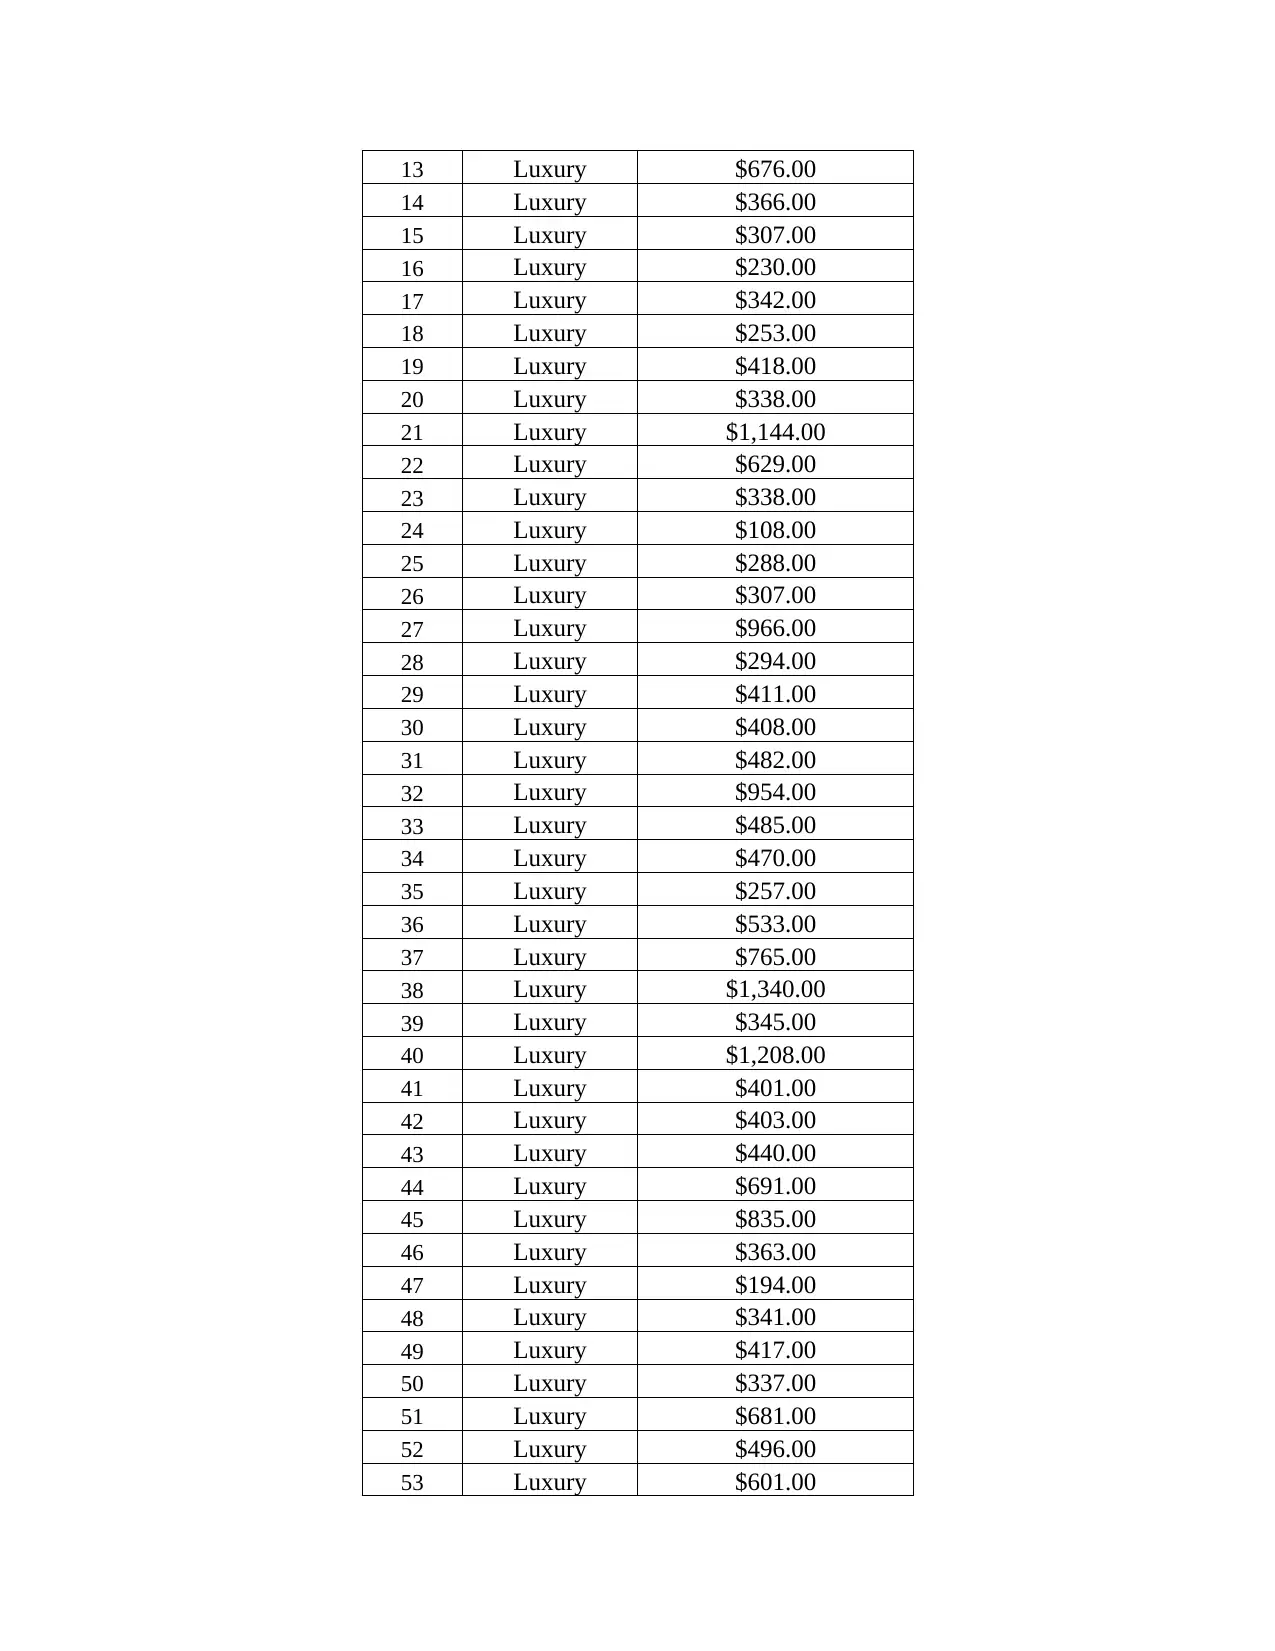
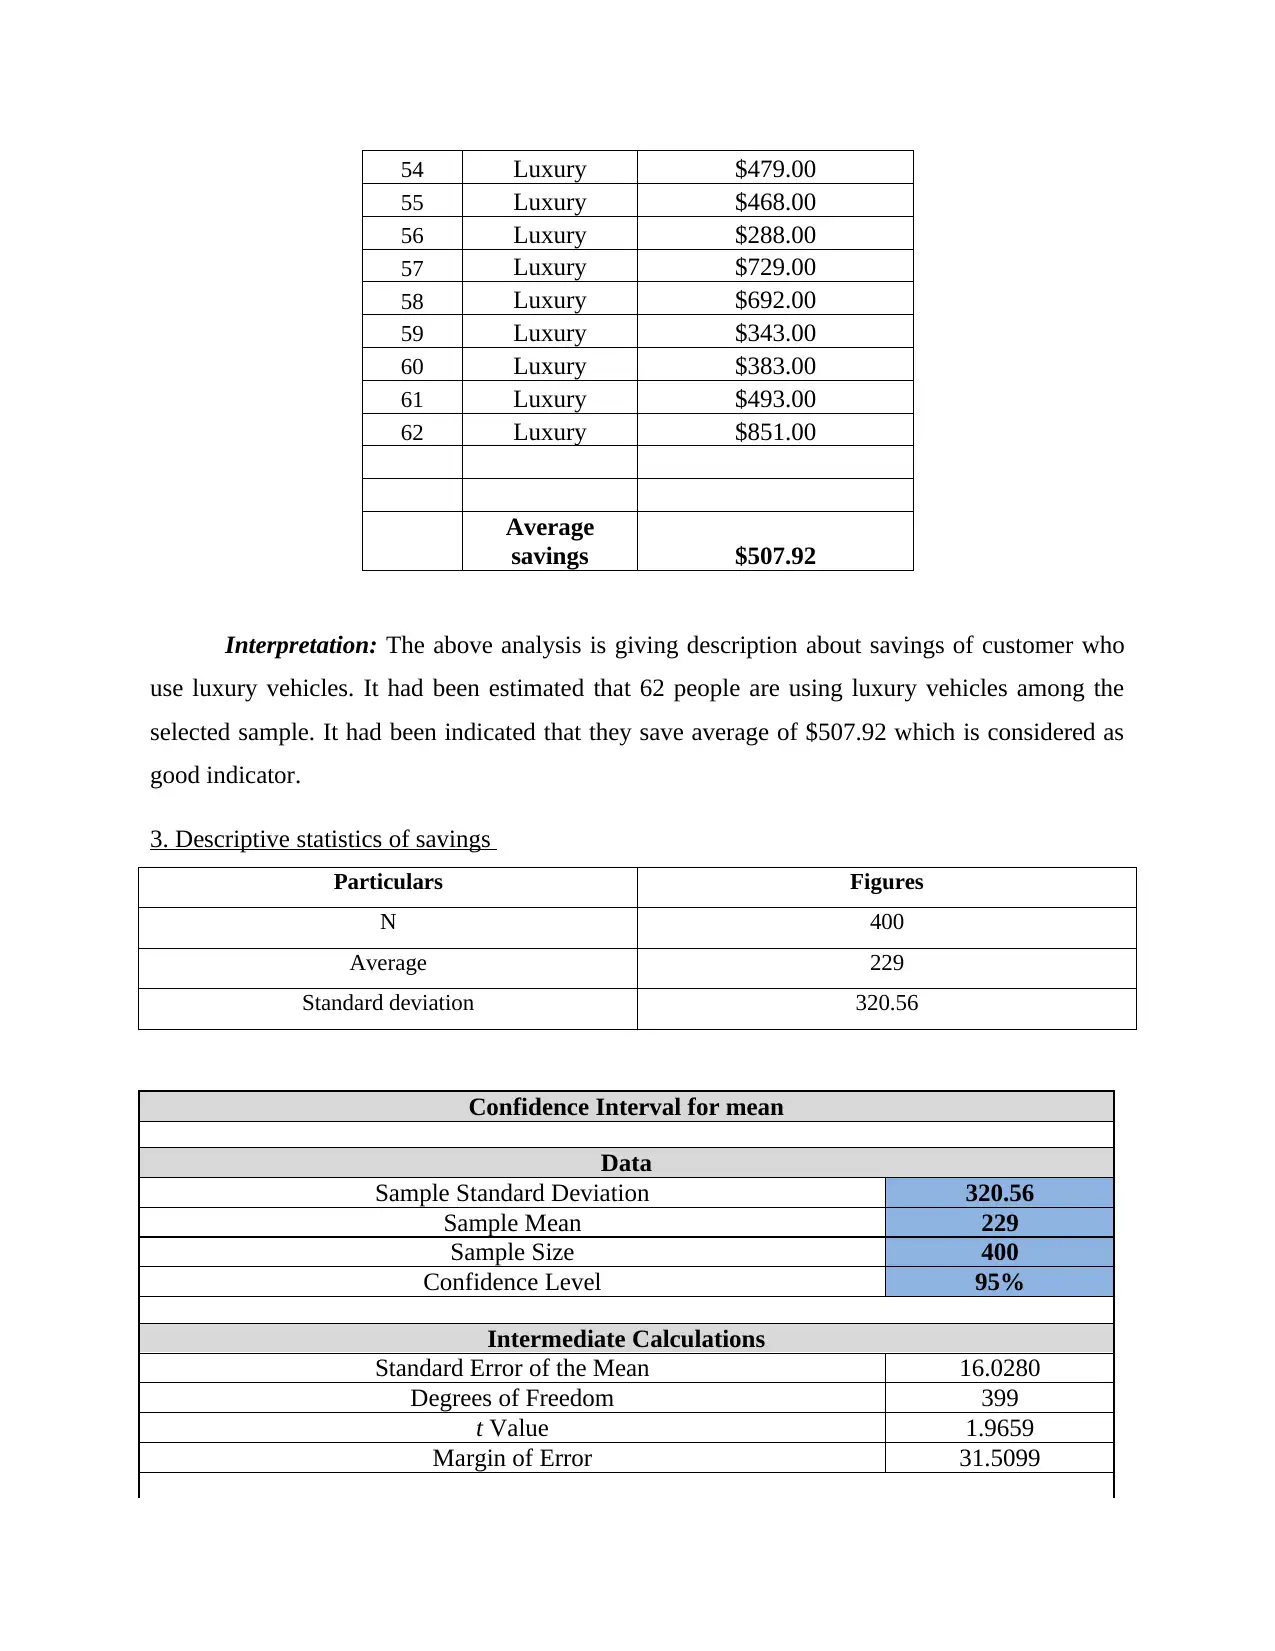
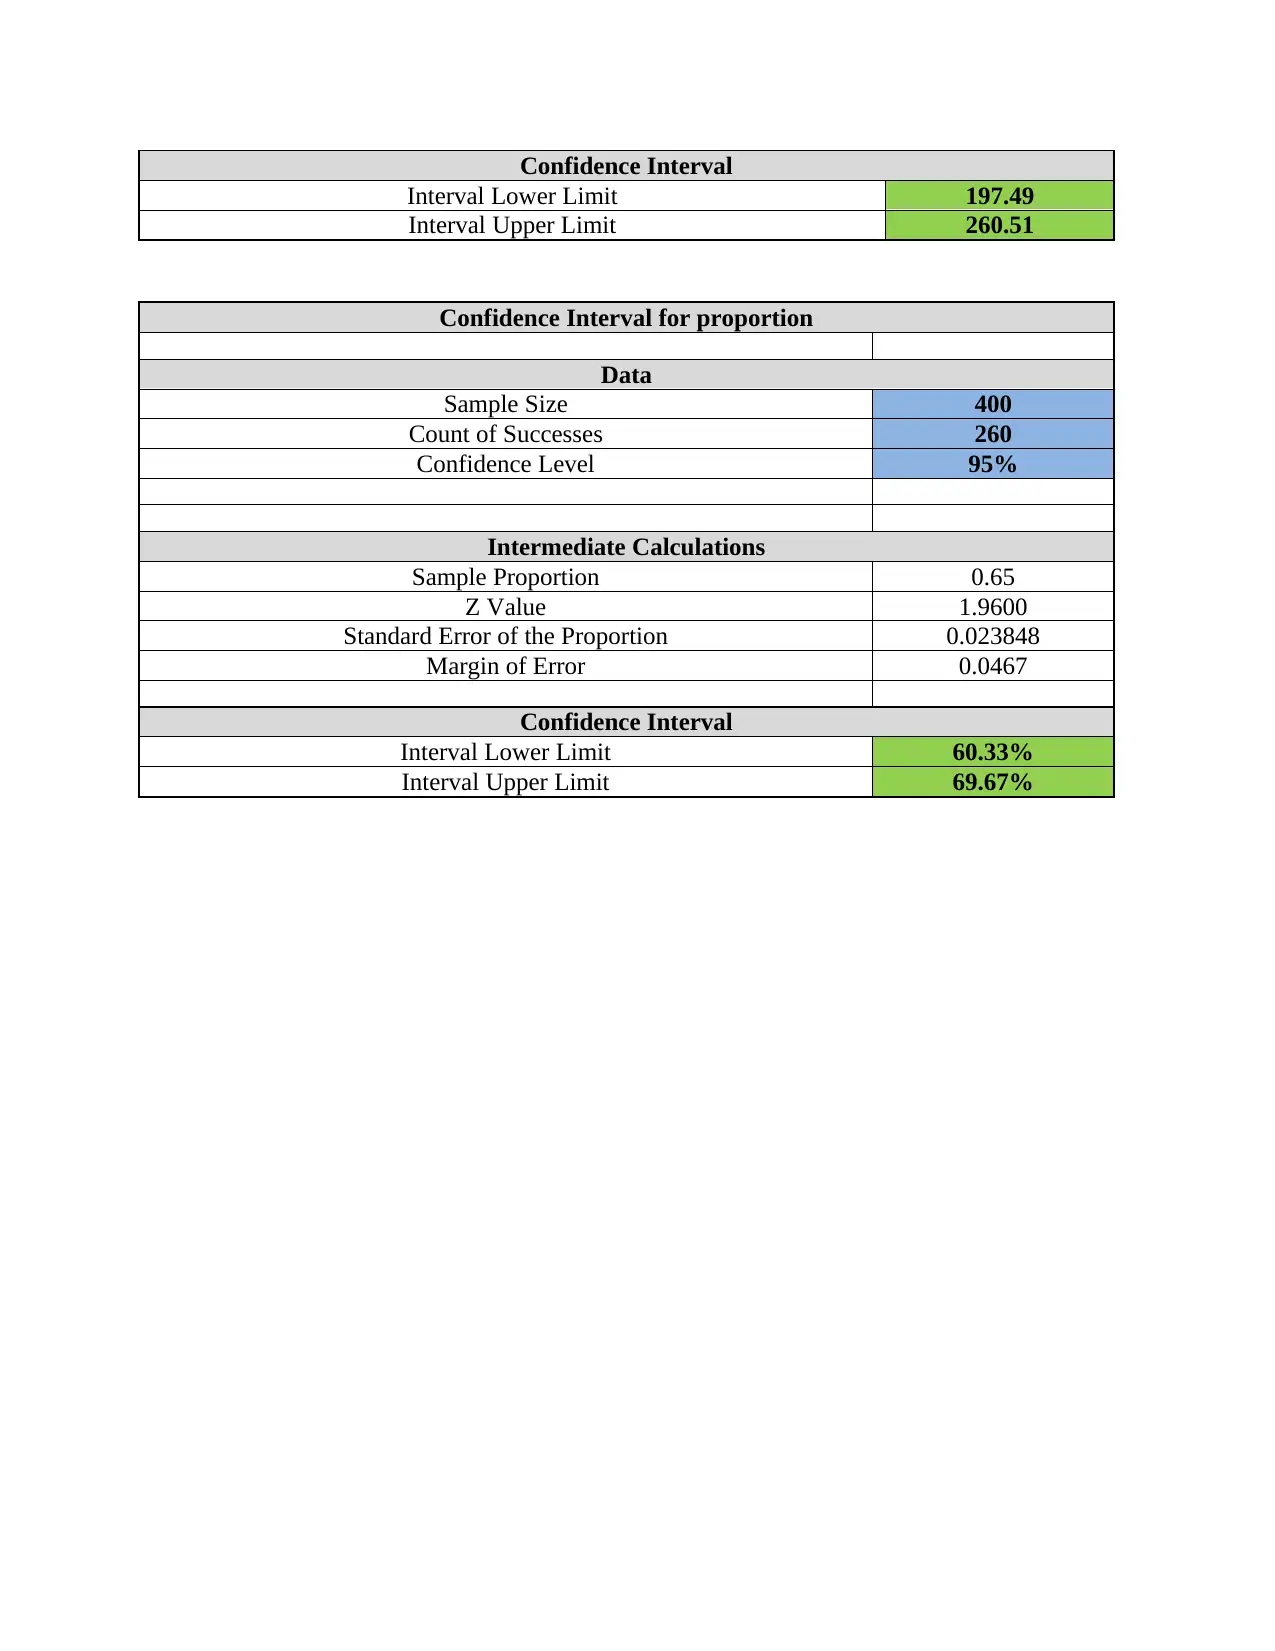
This report presents an analysis of data using descriptive analytics and visualization techniques. The report begins with an introduction to the topic, followed by an assessment of insurance claims, categorizing individuals as 'worse off,' 'no better off,' or 'better off' based on their insurance claims. The analysis calculates proportions to understand the distribution across these categories. The report then examines savings data related to sports and luxury vehicles. It provides descriptive statistics, including average savings, for both vehicle types. The analysis includes detailed data tables and interpretations of the findings, offering insights into customer behavior and financial outcomes. Finally, it presents descriptive statistics of savings, including the average, standard deviation, and confidence intervals for the mean and proportion, providing a comprehensive overview of the data.

Descriptive Analytics and Visualization
Paraphrase This Document
Need a fresh take? Get an instant paraphrase of this document with our AI Paraphraser

TABLE OF CONTENTS
INTRODUCTION...........................................................................................................................3
1...................................................................................................................................................3
2...................................................................................................................................................4
3. Descriptive statistics of savings...............................................................................................7

INTRODUCTION
Descriptive analytic and visualization plays very efficient role for analyzing any specific
data set along with proper interpretation and conclusion. The present report would be conveying
its findings with proper understanding. It would be also articulating proper application of
quantitative reasoning skills for the purpose of solving various complex problems. In the same
series, it would be also justifying various technologies for finding and disseminate information.
Further it had articulated different solutions for problems which are authentic. It had also
reflected understanding on data analysis which is contemporary and tools of visualization for
recognizing information of these tools.
1.
Assessment of insurance claims condition
Row Labels Count of Savings
worse off (<0) 72
No better off (0) 25
Better off (>1) 303
Grand Total 400
Proportions
Row Labels Count of Savings
worse off (<0) 72 / 400 * 100 = 18%
No better off (0) 25 / 400 * 100 = 6%
Better off (>1) 303 / 400 * 100 = 76%
Grand Total 400
Interpretation: The above table is assessing the condition who had claimed insurance in
worsen off aspect. There has been presentation of each proportion from sample of 400 in which
major quantity had been gained by better off then followed by worsen off and no better off. In
the table one it had assessed appropriate count and in next table there is presentation of
calculation of proportion of all three factors. Among 400, 72 people were not affected by car
insurance whose proportion is of 18%.
⊘ This is a preview!⊘
Do you want full access?
Subscribe today to unlock all pages.

Trusted by 1+ million students worldwide

2.
Sports vehicle type
Veh_Type Savings
1 Sports $327.00
2 Sports $156.00
3 Sports $1,084.00
4 Sports $357.00
5 Sports $1,179.00
6 Sports $575.00
7 Sports $425.00
8 Sports $214.00
9 Sports $272.00
10 Sports $416.00
11 Sports $850.00
12 Sports $1,956.00
13 Sports $562.00
14 Sports $1,008.00
15 Sports $250.00
16 Sports $542.00
17 Sports $756.00
18 Sports $627.00
19 Sports $1,143.00
20 Sports $827.00
21 Sports $298.00
22 Sports $361.00
23 Sports $691.00
24 Sports $384.00
25 Sports $1,799.00
26 Sports $680.00
27 Sports $373.00
28 Sports $442.00
29 Sports $914.00
30 Sports $1,576.00
31 Sports $728.00
32 Sports $283.00
33 Sports $355.00
34 Sports $294.00
35 Sports $430.00
Paraphrase This Document
Need a fresh take? Get an instant paraphrase of this document with our AI Paraphraser

36 Sports $413.00
37 Sports $1,022.00
38 Sports $590.00
39 Sports $675.00
40 Sports $488.00
41 Sports $1,271.00
42 Sports $690.00
43 Sports $704.00
44 Sports $676.00
45 Sports $320.00
46 Sports $377.00
47 Sports $1,097.00
48 Sports $837.00
49 Sports $1,651.00
Average savings $692.76
Interpretation: The above analysis is giving description about savings of customer who
use sports vehicles as it is indicating mean of sports vehicle among population of 49. There is
presence of minimum saving of $156.It had been estimated that average of $692 which had been
saved by various people.
Luxury vehicle type
Veh_Type Savings
1 Luxury $292.00
2 Luxury $893.00
3 Luxury $383.00
4 Luxury $292.00
5 Luxury $148.00
6 Luxury $505.00
7 Luxury $453.00
8 Luxury $640.00
9 Luxury $233.00
10 Luxury $434.00
11 Luxury $1,273.00
12 Luxury $357.00

13 Luxury $676.00
14 Luxury $366.00
15 Luxury $307.00
16 Luxury $230.00
17 Luxury $342.00
18 Luxury $253.00
19 Luxury $418.00
20 Luxury $338.00
21 Luxury $1,144.00
22 Luxury $629.00
23 Luxury $338.00
24 Luxury $108.00
25 Luxury $288.00
26 Luxury $307.00
27 Luxury $966.00
28 Luxury $294.00
29 Luxury $411.00
30 Luxury $408.00
31 Luxury $482.00
32 Luxury $954.00
33 Luxury $485.00
34 Luxury $470.00
35 Luxury $257.00
36 Luxury $533.00
37 Luxury $765.00
38 Luxury $1,340.00
39 Luxury $345.00
40 Luxury $1,208.00
41 Luxury $401.00
42 Luxury $403.00
43 Luxury $440.00
44 Luxury $691.00
45 Luxury $835.00
46 Luxury $363.00
47 Luxury $194.00
48 Luxury $341.00
49 Luxury $417.00
50 Luxury $337.00
51 Luxury $681.00
52 Luxury $496.00
53 Luxury $601.00
⊘ This is a preview!⊘
Do you want full access?
Subscribe today to unlock all pages.

Trusted by 1+ million students worldwide

54 Luxury $479.00
55 Luxury $468.00
56 Luxury $288.00
57 Luxury $729.00
58 Luxury $692.00
59 Luxury $343.00
60 Luxury $383.00
61 Luxury $493.00
62 Luxury $851.00
Average
savings $507.92
Interpretation: The above analysis is giving description about savings of customer who
use luxury vehicles. It had been estimated that 62 people are using luxury vehicles among the
selected sample. It had been indicated that they save average of $507.92 which is considered as
good indicator.
3. Descriptive statistics of savings
Particulars Figures
N 400
Average 229
Standard deviation 320.56
Confidence Interval for mean
Data
Sample Standard Deviation 320.56
Sample Mean 229
Sample Size 400
Confidence Level 95%
Intermediate Calculations
Standard Error of the Mean 16.0280
Degrees of Freedom 399
t Value 1.9659
Margin of Error 31.5099
Paraphrase This Document
Need a fresh take? Get an instant paraphrase of this document with our AI Paraphraser

Confidence Interval
Interval Lower Limit 197.49
Interval Upper Limit 260.51
Confidence Interval for proportion
Data
Sample Size 400
Count of Successes 260
Confidence Level 95%
Intermediate Calculations
Sample Proportion 0.65
Z Value 1.9600
Standard Error of the Proportion 0.023848
Margin of Error 0.0467
Confidence Interval
Interval Lower Limit 60.33%
Interval Upper Limit 69.67%
1 out of 8

Your All-in-One AI-Powered Toolkit for Academic Success.
 +13062052269
info@desklib.com
Available 24*7 on WhatsApp / Email
Unlock your academic potential
Copyright © 2020–2025 A2Z Services. All Rights Reserved. Developed and managed by ZUCOL.