MIS771 Descriptive Analytics & Visualization Report - Data Analysis
VerifiedAdded on 2023/06/14
|14
|2565
|348
Report
AI Summary
This report presents a descriptive analysis of healthcare claims data, examining claim payment amounts, claimant profiles, and comparisons against industry standards. Key findings include the average claim amount being below $77,500, a test of the proportion of mild or medium severity conditions, and an examination of the difference in these proportions based on gender. The report further investigates claims involving private versus non-private attorneys, the relationship between physician specialty, claim severity, and average claim amounts. The analysis reveals that the percentage of severe claims involving orthopedic surgeons is lower than that of other specialists, and the average claim amount for severe claims is also less for orthopedic surgeons. Several assertions made by the chief data scientist were not supported by the data. The report concludes by noting limitations due to the sample size and suggesting further research with a larger dataset.
Running Head: DESCRIPTIVE ANALYTICS AND VISUALIZATION
MIS771
Descriptive Analytics and Visualization
Name of the Student
Name of the University
Author Note
MIS771
Descriptive Analytics and Visualization
Name of the Student
Name of the University
Author Note
Paraphrase This Document
Need a fresh take? Get an instant paraphrase of this document with our AI Paraphraser
1DESCRIPTIVE ANALYTICS AND VISUALIZATION
Table of Contents
Introduction......................................................................................................................................2
Summary of Claim Payment Amount..............................................................................................2
Claimant Profile...............................................................................................................................2
Comparison of claims against Industry Standards...........................................................................3
Average Claim.............................................................................................................................3
Proportion of claims with Mild or Medium Severity..................................................................3
Difference in Proportion of claims with Mild or Medium Severity based on Gender................3
Claims by private and non-private attorney.................................................................................4
Private Attorney Representation in Severe and Medium Severity..............................................4
Relationship between specialty of the physician involved, the severity of the claim, and average
claim amounts..................................................................................................................................5
Percentage of Severe Claims for Orthopedic Surgeon and other Specialists..............................5
Difference in average claim amount for Orthopedic Surgeon and other Specialists...................5
Conclusion.......................................................................................................................................5
Appendices......................................................................................................................................7
2DESCRIPTIVE ANALYTICS AND VISUALIZATION
Introduction
UN News and World Report has published a study which states that there have been
extensive medical malpractices in the United States, the cost of which is almost 2.4 percent of
the annual spending on health care. According to another study that has been published in the
New England Journal of Medicine in 2011, it has been observed that 7.4 percent of the US
licensed physicians has the problem of malpractice between 1991 and 2005. These malpractices
have increased the cost of health care and has also resulted in the increase in the premiums for
the insurance of medical malpractice.
Thus, United health group have collected some data on the health insurance and is
interested in having a better understanding of the claims that are paid for the lawsuits of medical
malpractice. The dataset contains information about the claim amounts and also about the type of
physician the claimants are visiting, the type of problems they are facing. Thus, for the interest of
the company, analysis have been conducted on the dataset provided and the following
information have been obtained as a result of the analysis.
Summary of Claim Payment Amount
200 claims have been selected randomly for the purpose of the analysis. It has been seen
from the analysis of 200 claims that the average claim amount is $73457.49. The claim amounts
are extremely scattered. Fifty percent of the claim amounts are less than $72571.38. There are
more claim amounts that are less than the average amount.
Claimant Profile
From the data, it has been observed that the average age of the claimants are 44.49 years
and the proportion of claimants who do not have any insurance is 0.09. There are more female
⊘ This is a preview!⊘
Do you want full access?
Subscribe today to unlock all pages.
Trusted by 1+ million students worldwide
3DESCRIPTIVE ANALYTICS AND VISUALIZATION
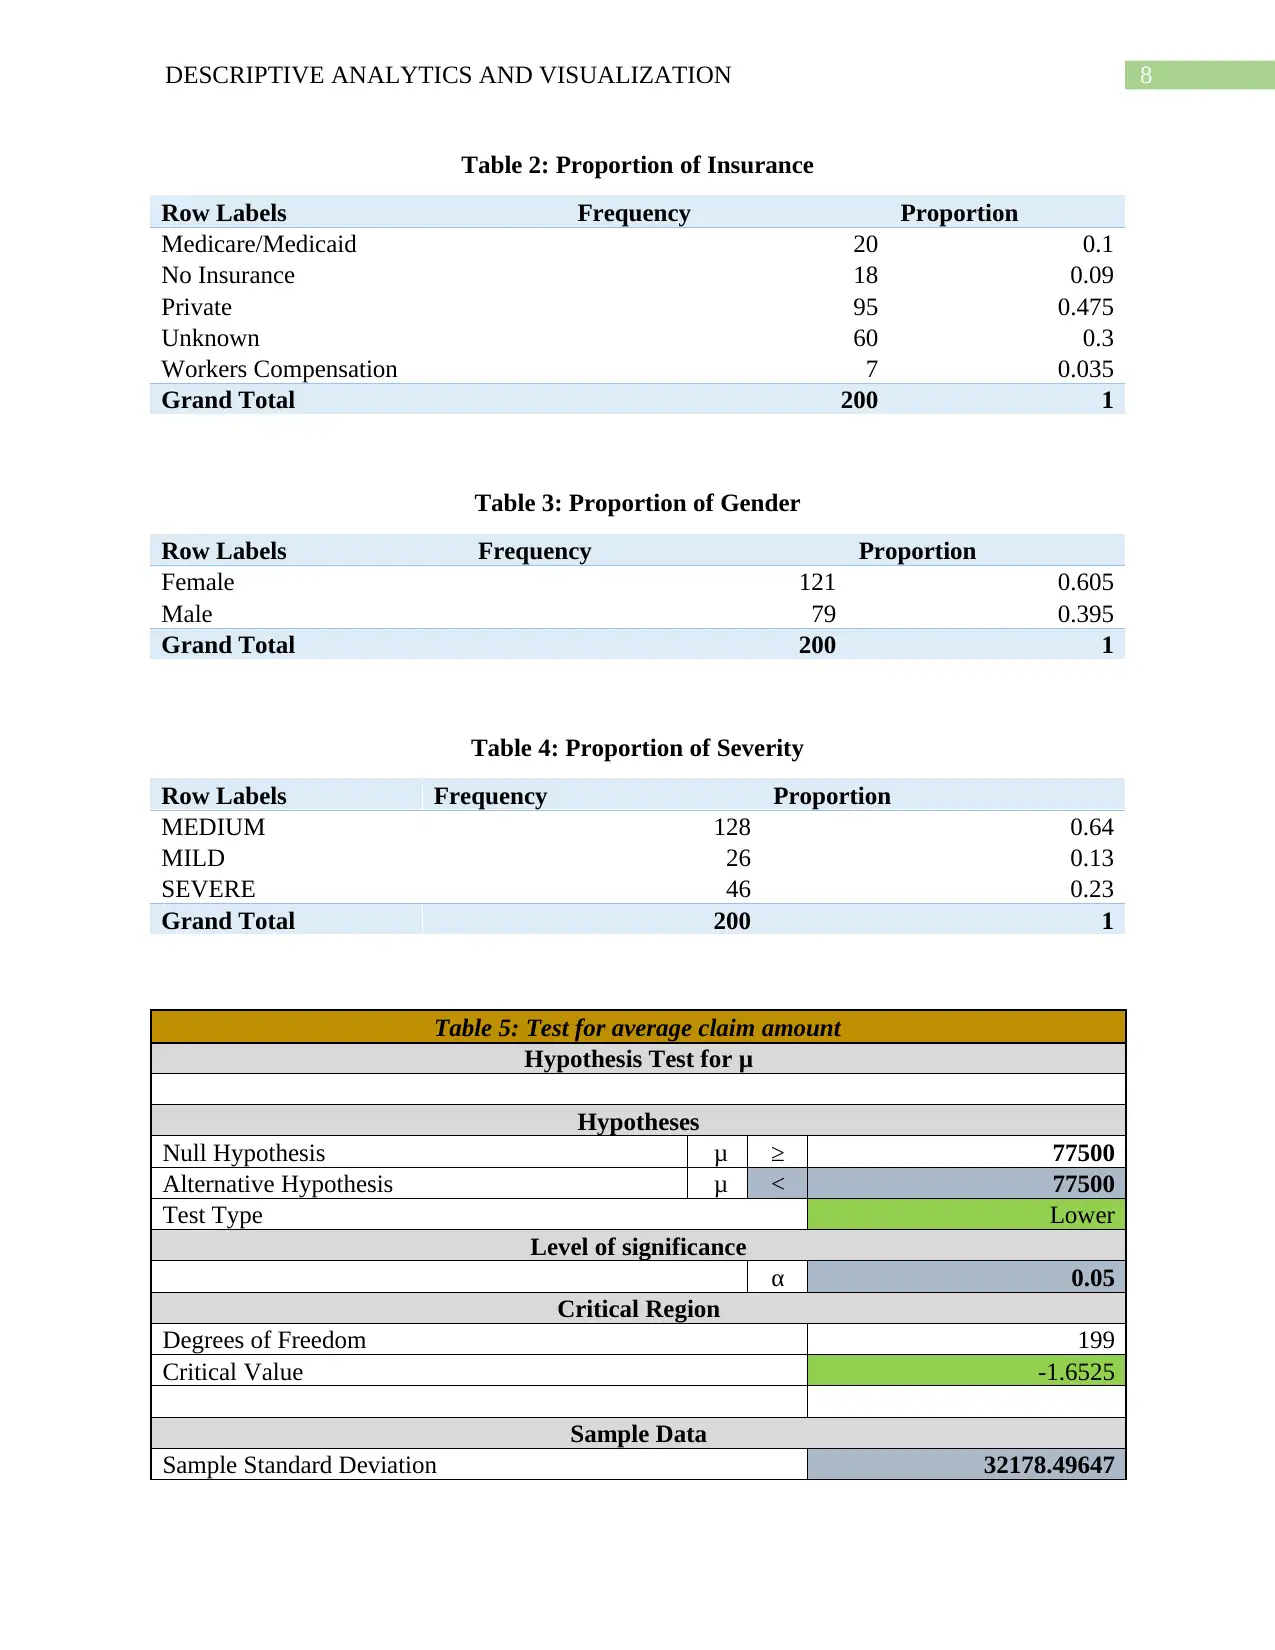
claimants that the male claimants. The proportion of female claimants are 0.605. Also, it has
been seen that people with medium severity of health conditions mostly claim for the health care
amount. The proportion of claimants with medium severity of health conditions is 0.64.
Comparison of claims against Industry Standards
Average Claim
The company United Health Group is interested in comparing the claims made this year
with the industry standards. According to the reports of an industry, the average claim amount
that has been paid has dropped below $77,500. Analysis have been conducted to test whether this
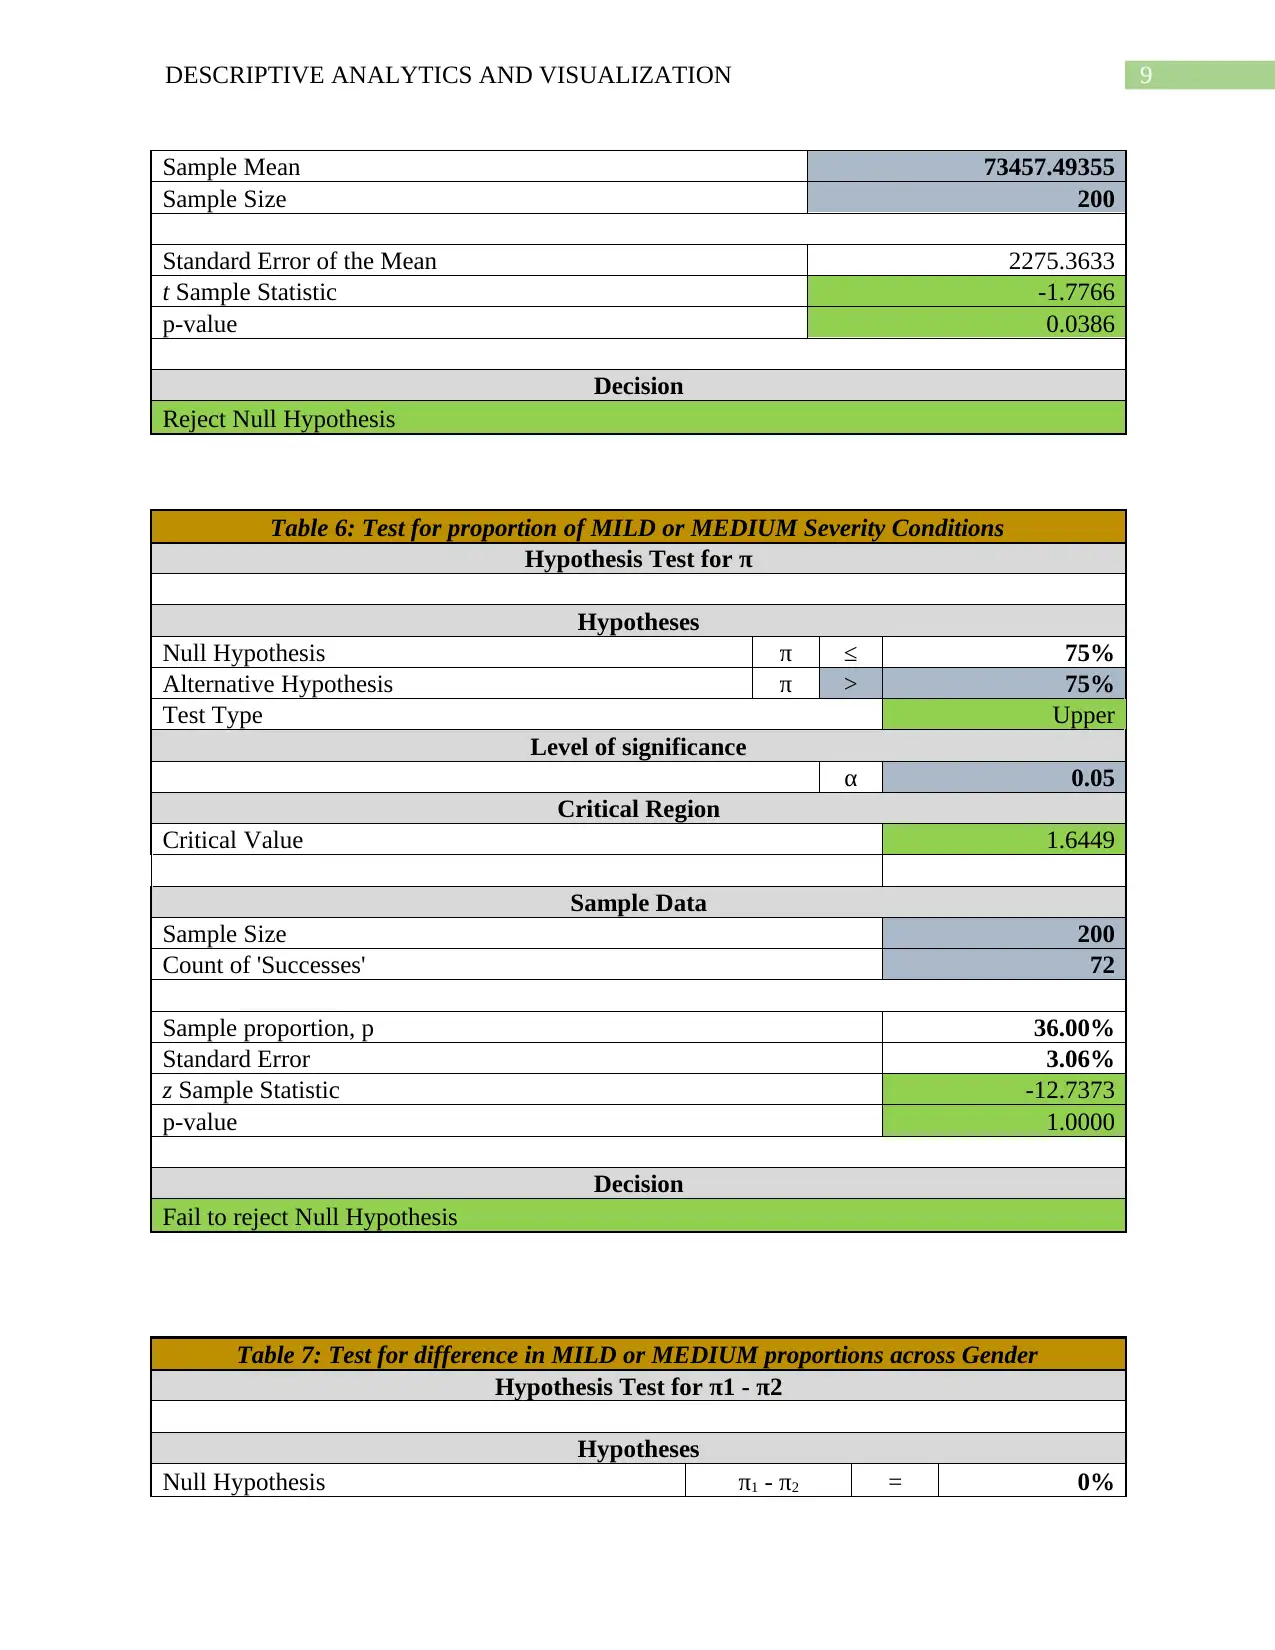
claim can be supported or not. From the results of the analysis, it has been observed that the
claim amount has reduced and have dropped below $77,500. This claim can be supported with
95 percent confidence. Enough evidence has been obtained to support this claim.
Proportion of claims with Mild or Medium Severity
According to another similar study, there has been a report that 3 out of four claims made
by the claimants are of “MILD” or “MEDIUM” severity conditions. Thus, it is claimed that 75
percent of the claims are made by the claimants of MILD or MEDIUM severity conditions. The
truthfulness of this statement also has to be tested. From the results of this test, it has been
observed that less than 75 percent of the claims made by the claimants are of “MILD” or
“MEDIUM” severity conditions. Thus, there is not enough evidence to support the result of the
report that has been provided by the study. Hence, it can be said that this statement is still not
valid for all patients.
Difference in Proportion of claims with Mild or Medium Severity based on Gender
claimants that the male claimants. The proportion of female claimants are 0.605. Also, it has
been seen that people with medium severity of health conditions mostly claim for the health care
amount. The proportion of claimants with medium severity of health conditions is 0.64.
Comparison of claims against Industry Standards
Average Claim
The company United Health Group is interested in comparing the claims made this year
with the industry standards. According to the reports of an industry, the average claim amount
that has been paid has dropped below $77,500. Analysis have been conducted to test whether this
claim can be supported or not. From the results of the analysis, it has been observed that the
claim amount has reduced and have dropped below $77,500. This claim can be supported with
95 percent confidence. Enough evidence has been obtained to support this claim.
Proportion of claims with Mild or Medium Severity
According to another similar study, there has been a report that 3 out of four claims made
by the claimants are of “MILD” or “MEDIUM” severity conditions. Thus, it is claimed that 75
percent of the claims are made by the claimants of MILD or MEDIUM severity conditions. The
truthfulness of this statement also has to be tested. From the results of this test, it has been
observed that less than 75 percent of the claims made by the claimants are of “MILD” or
“MEDIUM” severity conditions. Thus, there is not enough evidence to support the result of the
report that has been provided by the study. Hence, it can be said that this statement is still not
valid for all patients.
Difference in Proportion of claims with Mild or Medium Severity based on Gender
Paraphrase This Document
Need a fresh take? Get an instant paraphrase of this document with our AI Paraphraser
4DESCRIPTIVE ANALYTICS AND VISUALIZATION
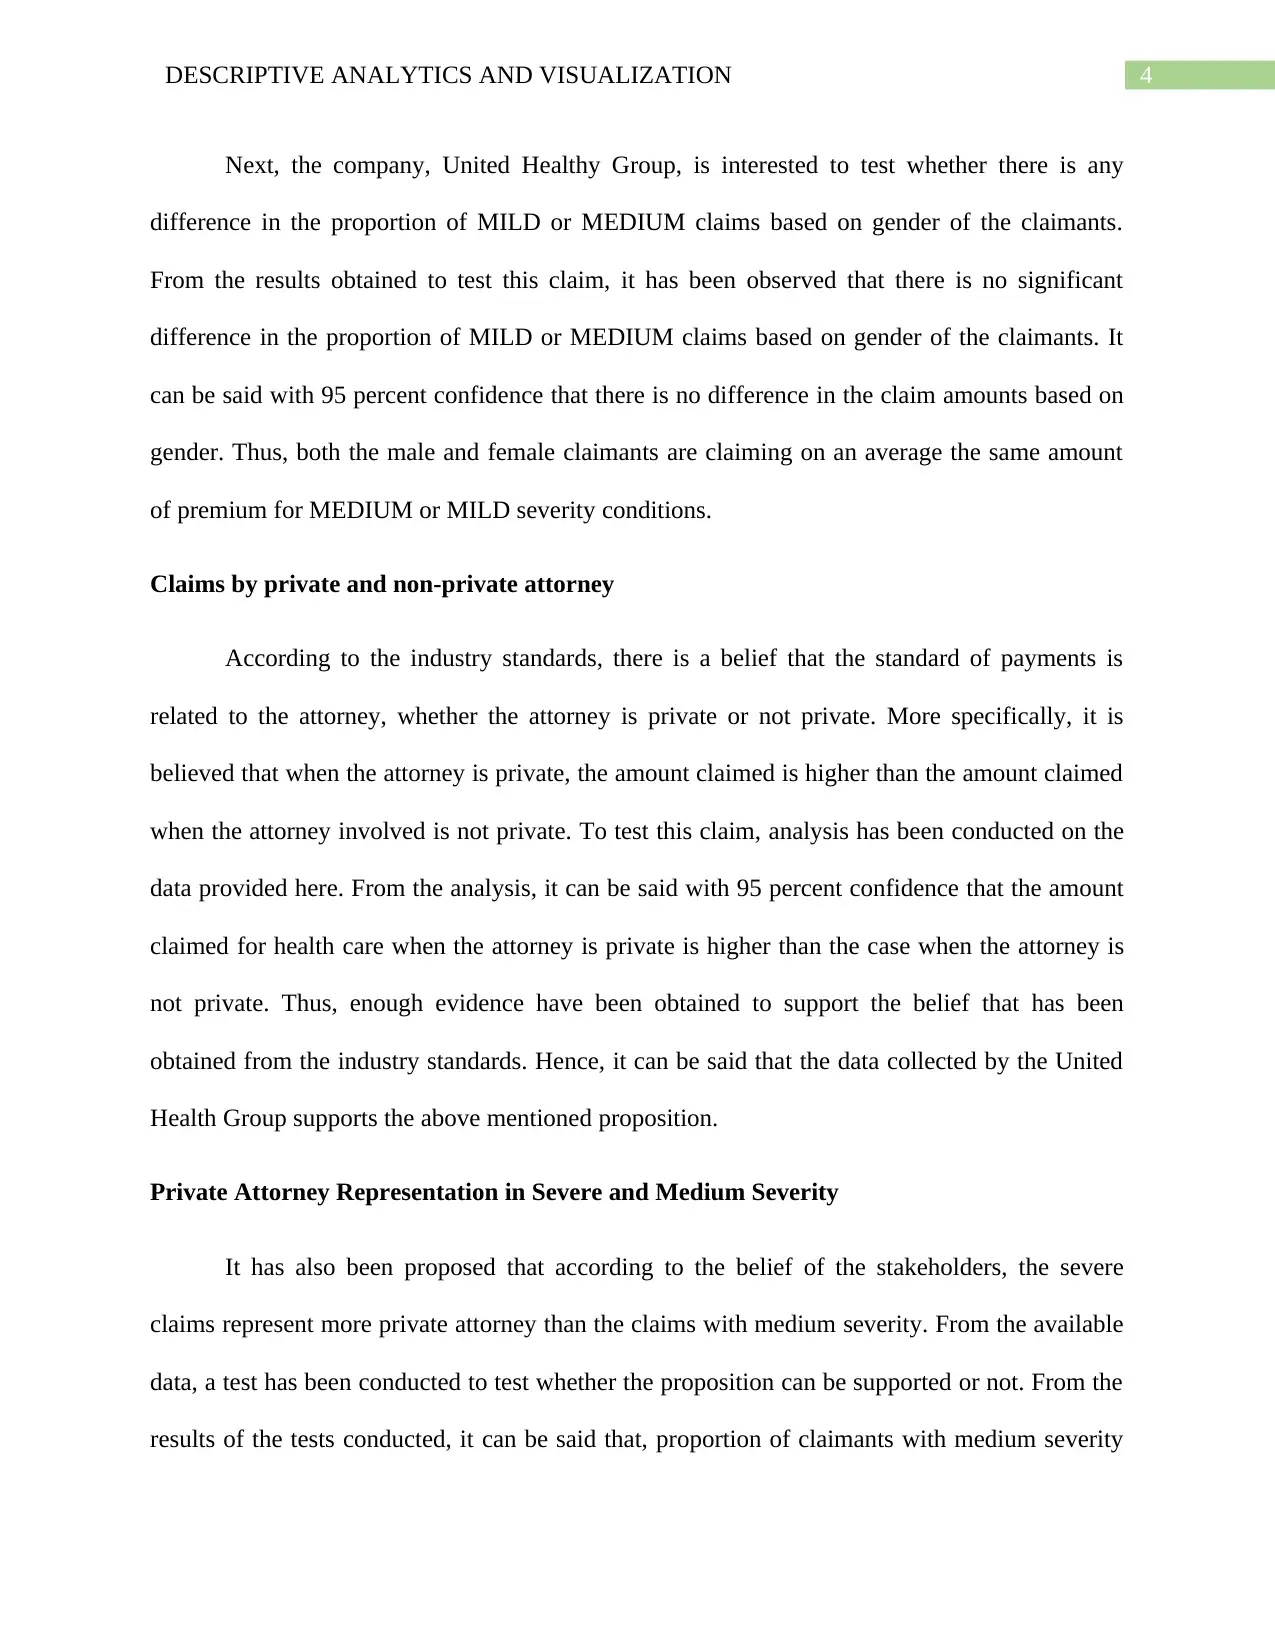
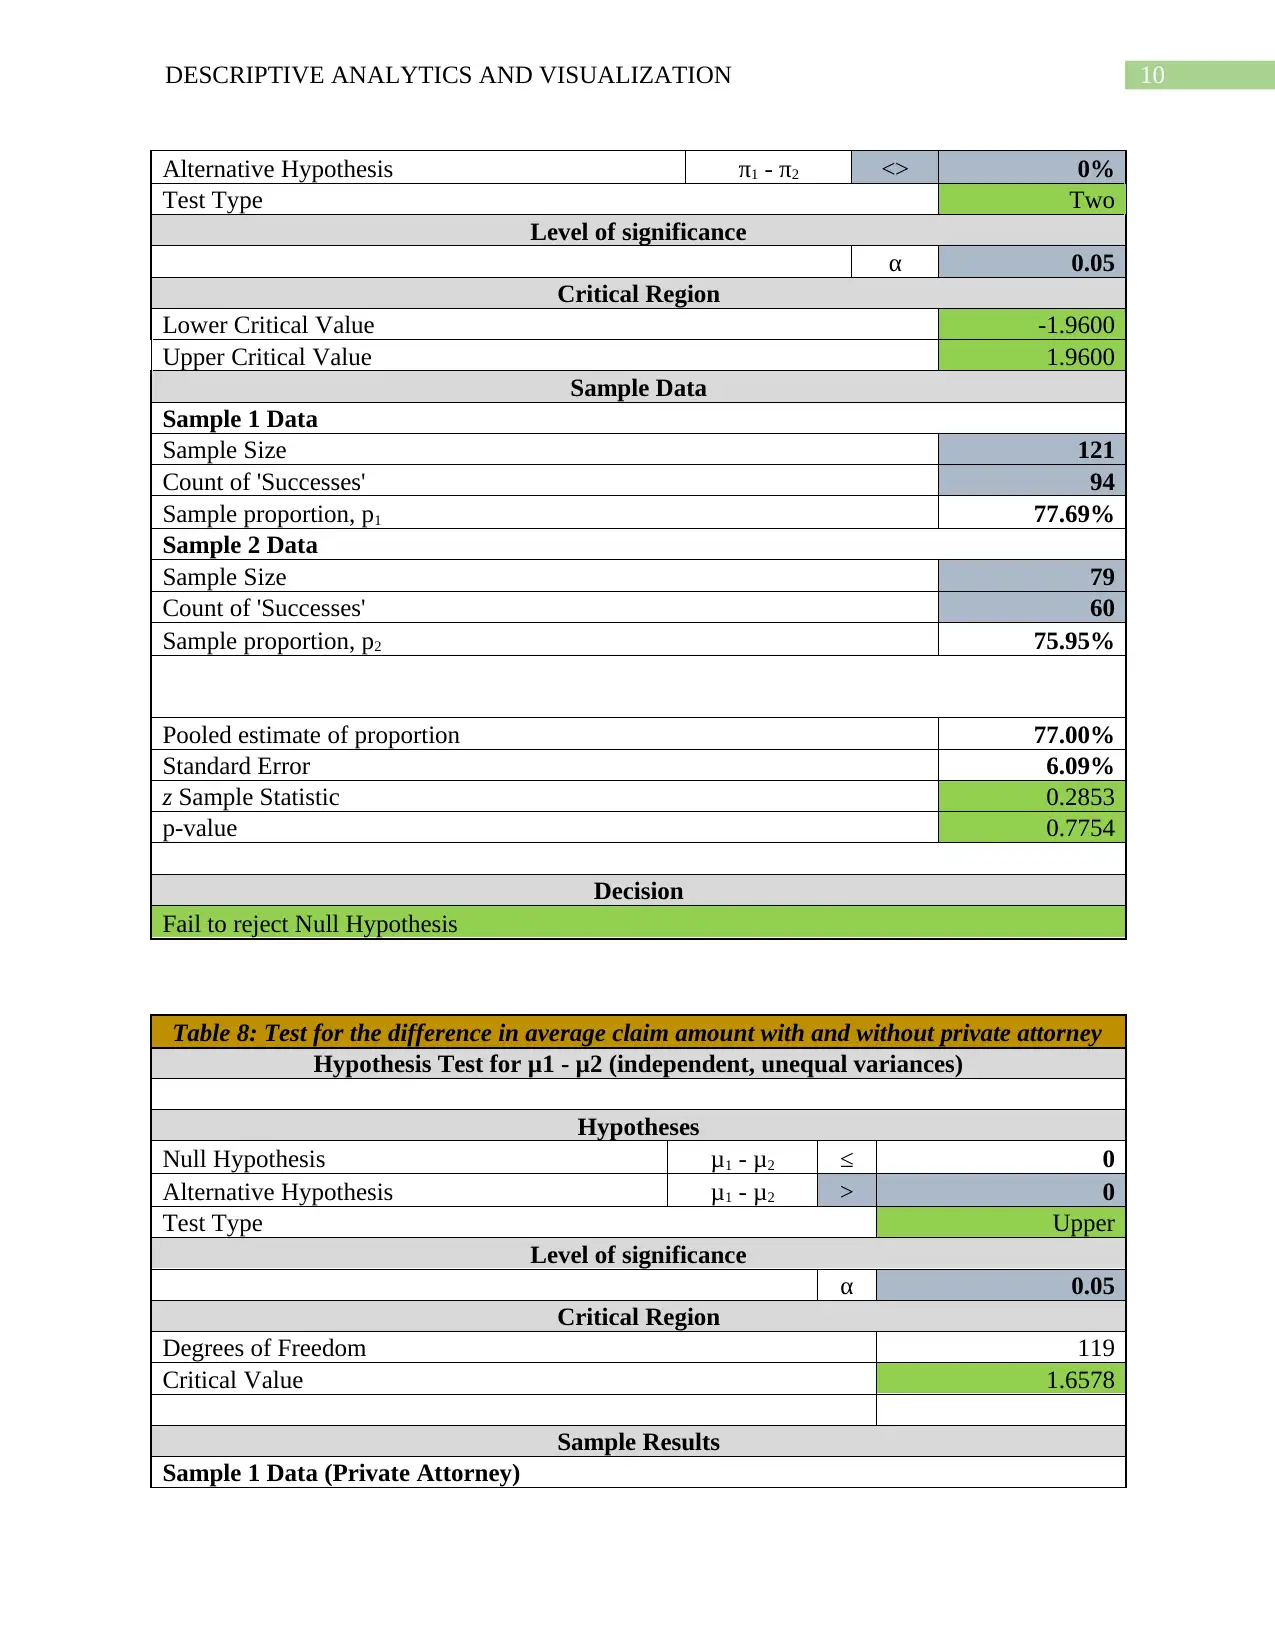
Next, the company, United Healthy Group, is interested to test whether there is any
difference in the proportion of MILD or MEDIUM claims based on gender of the claimants.
From the results obtained to test this claim, it has been observed that there is no significant
difference in the proportion of MILD or MEDIUM claims based on gender of the claimants. It
can be said with 95 percent confidence that there is no difference in the claim amounts based on
gender. Thus, both the male and female claimants are claiming on an average the same amount
of premium for MEDIUM or MILD severity conditions.
Claims by private and non-private attorney
According to the industry standards, there is a belief that the standard of payments is
related to the attorney, whether the attorney is private or not private. More specifically, it is
believed that when the attorney is private, the amount claimed is higher than the amount claimed
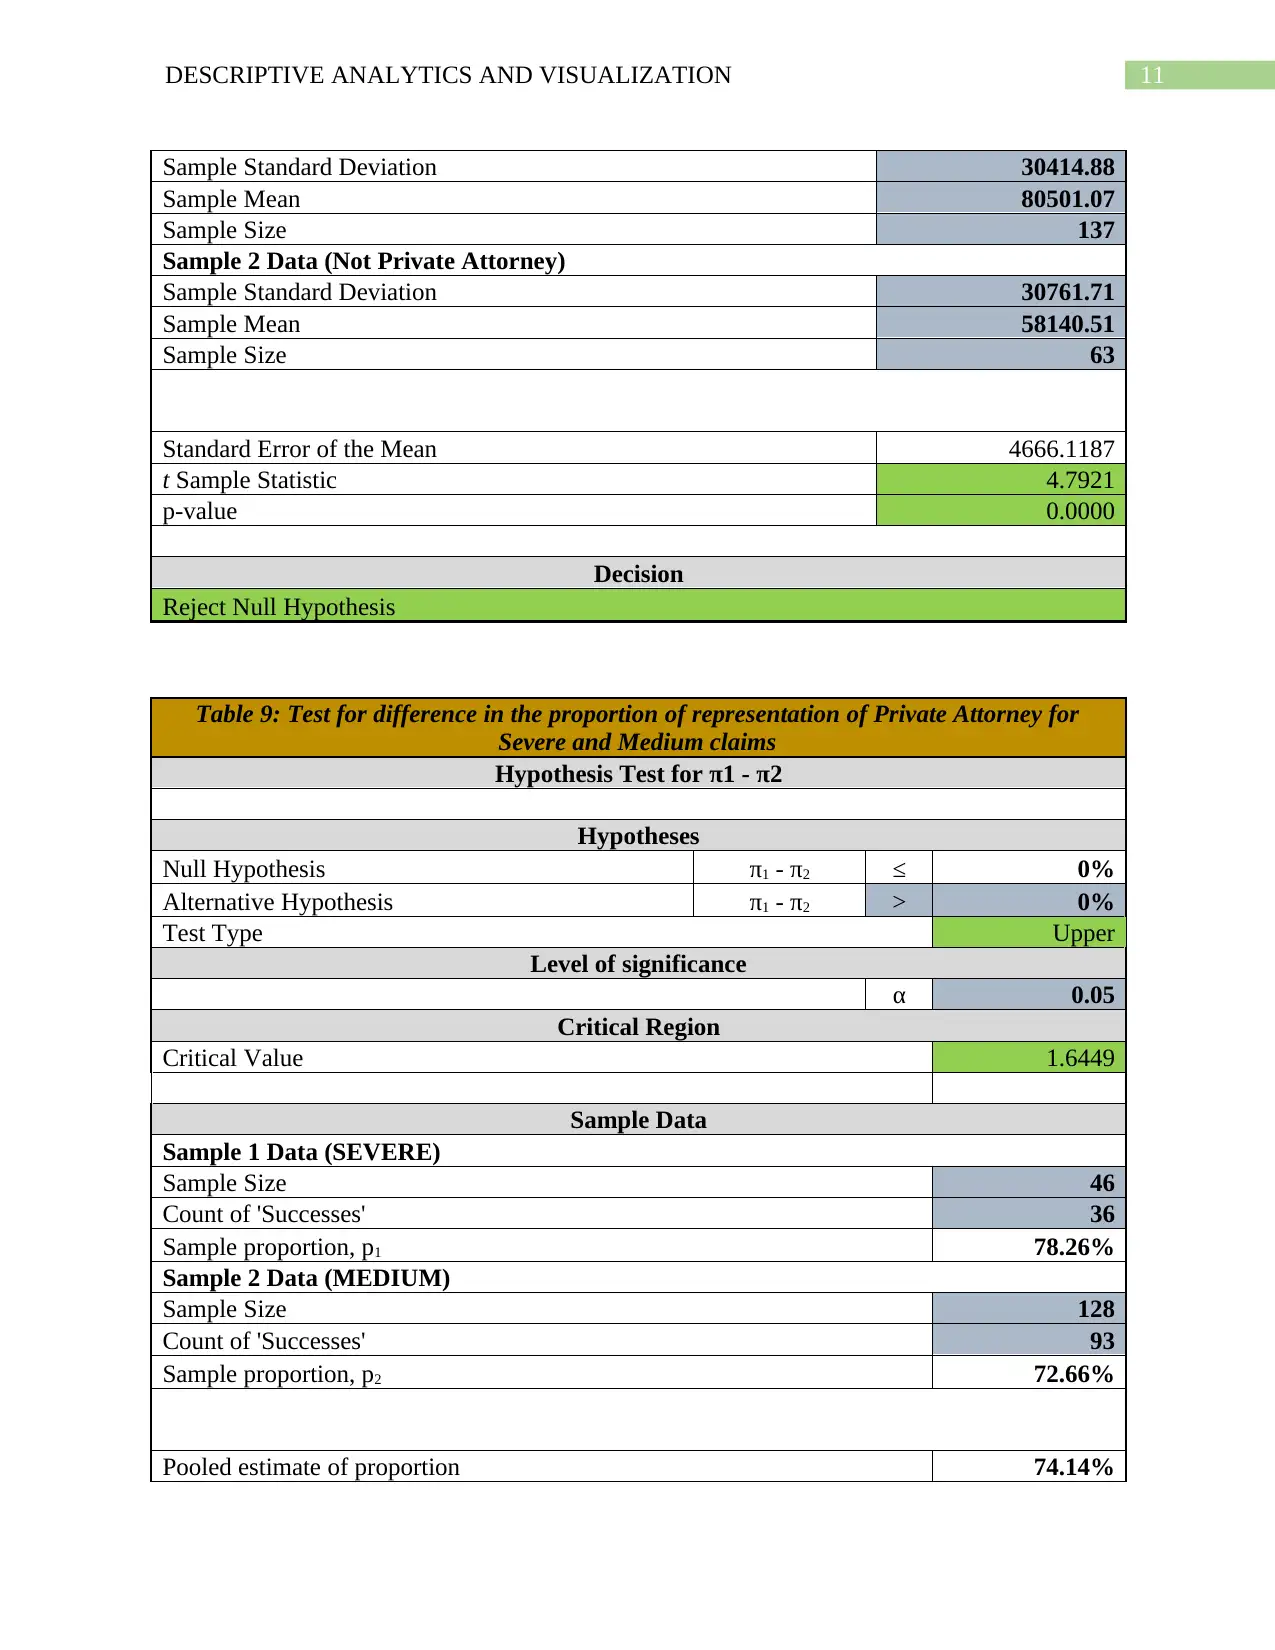
when the attorney involved is not private. To test this claim, analysis has been conducted on the
data provided here. From the analysis, it can be said with 95 percent confidence that the amount
claimed for health care when the attorney is private is higher than the case when the attorney is
not private. Thus, enough evidence have been obtained to support the belief that has been
obtained from the industry standards. Hence, it can be said that the data collected by the United
Health Group supports the above mentioned proposition.
Private Attorney Representation in Severe and Medium Severity
It has also been proposed that according to the belief of the stakeholders, the severe
claims represent more private attorney than the claims with medium severity. From the available
data, a test has been conducted to test whether the proposition can be supported or not. From the
results of the tests conducted, it can be said that, proportion of claimants with medium severity
Next, the company, United Healthy Group, is interested to test whether there is any
difference in the proportion of MILD or MEDIUM claims based on gender of the claimants.
From the results obtained to test this claim, it has been observed that there is no significant
difference in the proportion of MILD or MEDIUM claims based on gender of the claimants. It
can be said with 95 percent confidence that there is no difference in the claim amounts based on
gender. Thus, both the male and female claimants are claiming on an average the same amount
of premium for MEDIUM or MILD severity conditions.
Claims by private and non-private attorney
According to the industry standards, there is a belief that the standard of payments is
related to the attorney, whether the attorney is private or not private. More specifically, it is
believed that when the attorney is private, the amount claimed is higher than the amount claimed
when the attorney involved is not private. To test this claim, analysis has been conducted on the
data provided here. From the analysis, it can be said with 95 percent confidence that the amount
claimed for health care when the attorney is private is higher than the case when the attorney is
not private. Thus, enough evidence have been obtained to support the belief that has been
obtained from the industry standards. Hence, it can be said that the data collected by the United
Health Group supports the above mentioned proposition.
Private Attorney Representation in Severe and Medium Severity
It has also been proposed that according to the belief of the stakeholders, the severe
claims represent more private attorney than the claims with medium severity. From the available
data, a test has been conducted to test whether the proposition can be supported or not. From the
results of the tests conducted, it can be said that, proportion of claimants with medium severity
5DESCRIPTIVE ANALYTICS AND VISUALIZATION
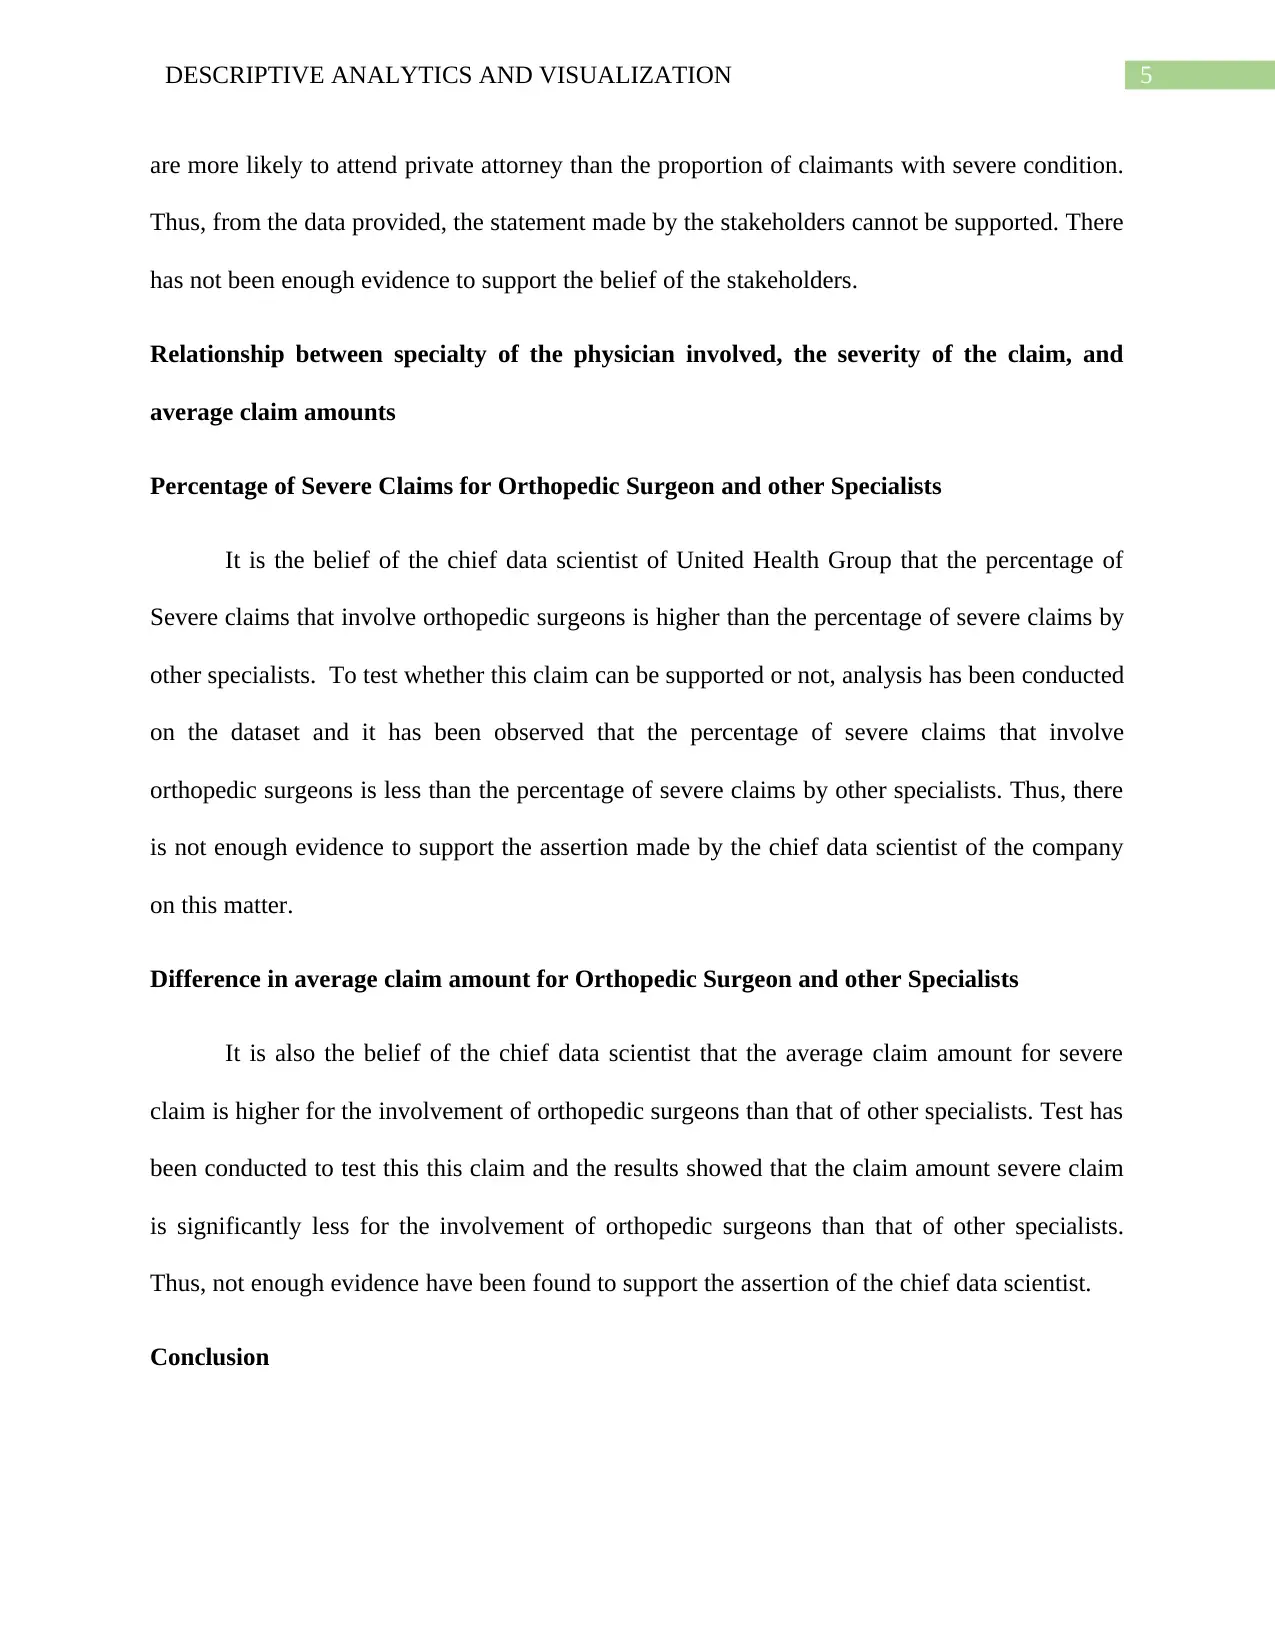
are more likely to attend private attorney than the proportion of claimants with severe condition.
Thus, from the data provided, the statement made by the stakeholders cannot be supported. There
has not been enough evidence to support the belief of the stakeholders.
Relationship between specialty of the physician involved, the severity of the claim, and
average claim amounts
Percentage of Severe Claims for Orthopedic Surgeon and other Specialists
It is the belief of the chief data scientist of United Health Group that the percentage of
Severe claims that involve orthopedic surgeons is higher than the percentage of severe claims by
other specialists. To test whether this claim can be supported or not, analysis has been conducted
on the dataset and it has been observed that the percentage of severe claims that involve
orthopedic surgeons is less than the percentage of severe claims by other specialists. Thus, there
is not enough evidence to support the assertion made by the chief data scientist of the company
on this matter.
Difference in average claim amount for Orthopedic Surgeon and other Specialists
It is also the belief of the chief data scientist that the average claim amount for severe
claim is higher for the involvement of orthopedic surgeons than that of other specialists. Test has
been conducted to test this this claim and the results showed that the claim amount severe claim
is significantly less for the involvement of orthopedic surgeons than that of other specialists.
Thus, not enough evidence have been found to support the assertion of the chief data scientist.
Conclusion
⊘ This is a preview!⊘
Do you want full access?
Subscribe today to unlock all pages.
Trusted by 1+ million students worldwide
6DESCRIPTIVE ANALYTICS AND VISUALIZATION
From all the discussions conducted above, it can be concluded that the average amount
paid for the claims has dropped below $77,000. 3 out of 4 cases are not of mild or medium
severity conditions. Rather less than 3 claims out of 4 claims are of mild or medium severity
conditions. No significant difference in the proportion of mild or medium claims have been
observed by the patient’s gender. Further, it has been observed that the average claim amount is
less when a private attorney is present rather than when a private attorney is not present. It has
also been observed that representation of private attorney is higher for claims with medium
severity than for severe claims. Moreover, percentage of severe claims with the involvement of
orthopedic surgeons is less than the percentage of severe claims with the involvement of other
specialists. Also, the average claim amount is less for severe claims with the involvement of
orthopedic surgeons rather than the other specializations.
Some results have been obtained which does not support the previous studies or beliefs of
the data scientist of United Health Group. One of the major reasons behind these results is the
number of samples. 200 samples are very less to represent the whole US population. Thus, if the
sample size is increased, the results obtained might be different from what has been obtained
from this analysis.
Paraphrase This Document
Need a fresh take? Get an instant paraphrase of this document with our AI Paraphraser
7DESCRIPTIVE ANALYTICS AND VISUALIZATION
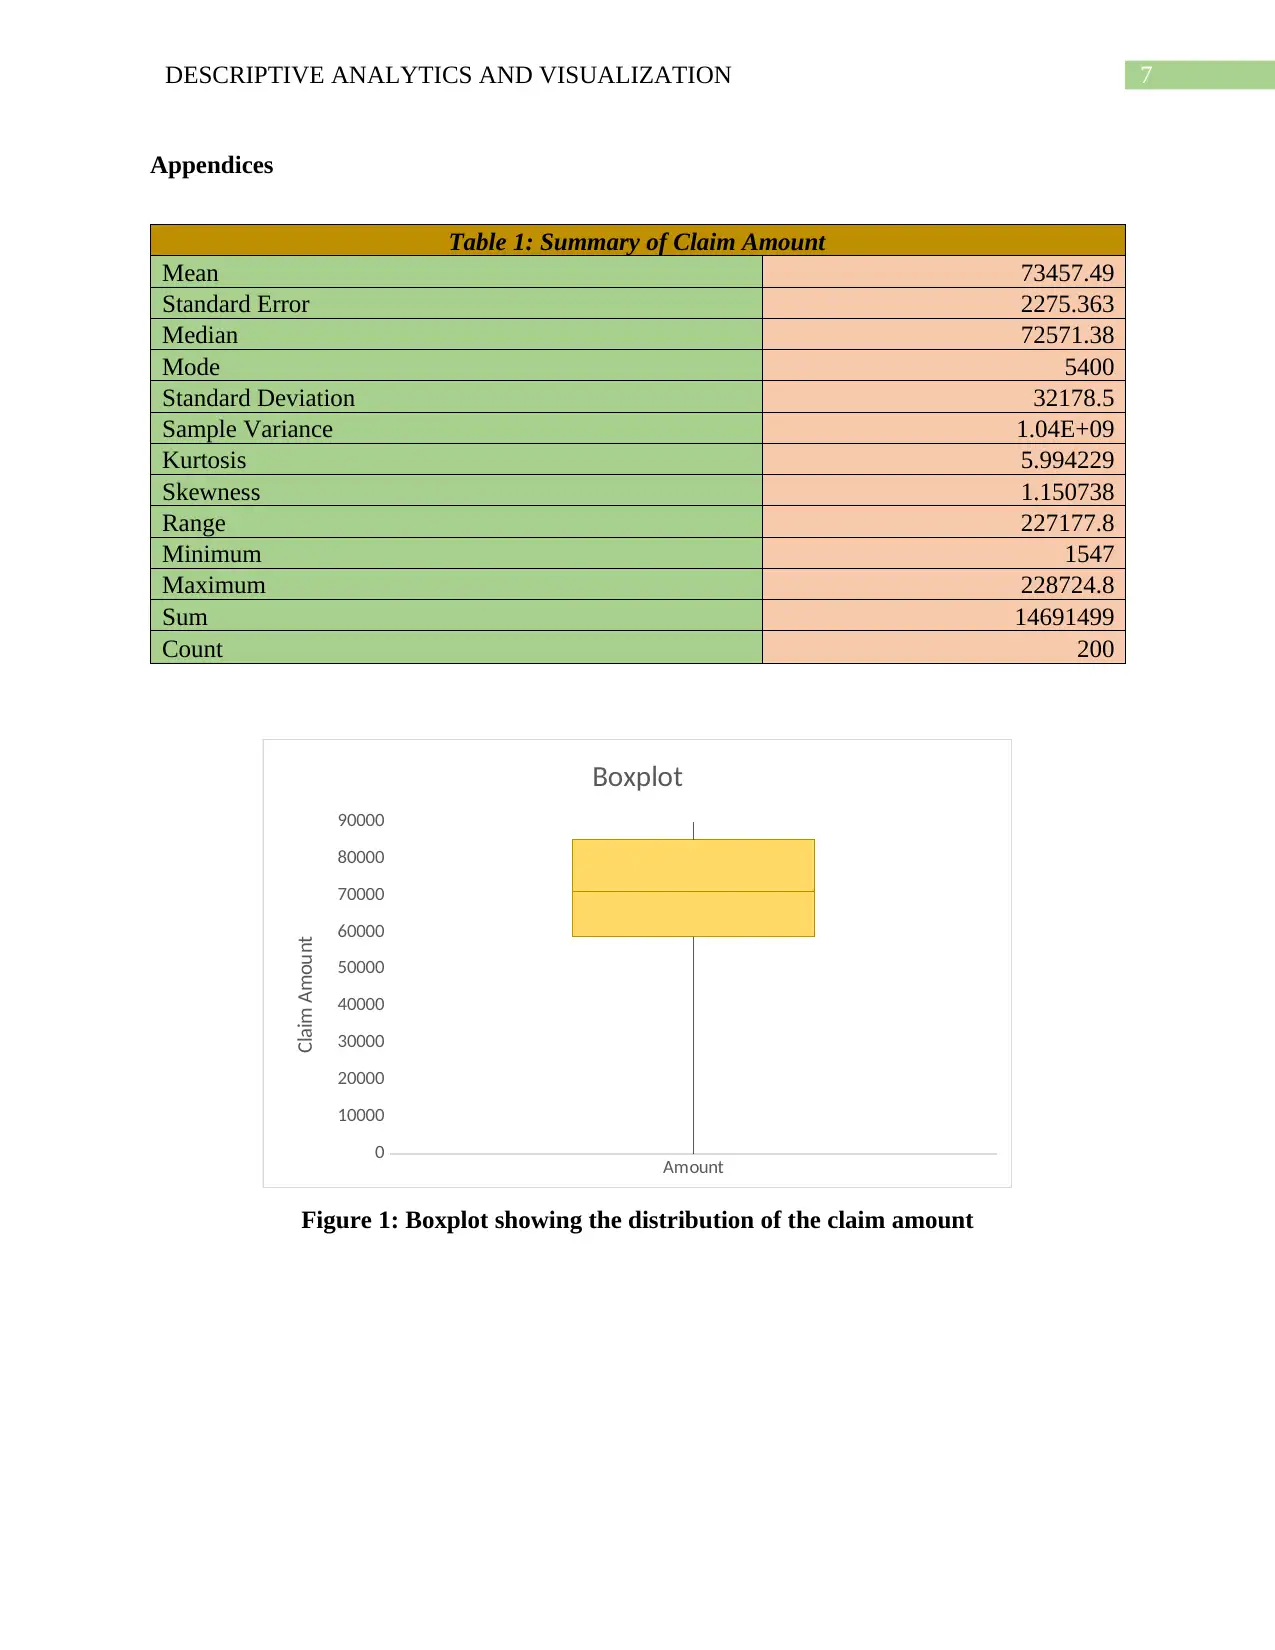
Appendices
Table 1: Summary of Claim Amount
Mean 73457.49
Standard Error 2275.363
Median 72571.38
Mode 5400
Standard Deviation 32178.5
Sample Variance 1.04E+09
Kurtosis 5.994229
Skewness 1.150738
Range 227177.8
Minimum 1547
Maximum 228724.8
Sum 14691499
Count 200
Amount
0
10000
20000
30000
40000
50000
60000
70000
80000
90000
Boxplot
Claim Amount
Figure 1: Boxplot showing the distribution of the claim amount
8DESCRIPTIVE ANALYTICS AND VISUALIZATION
Table 2: Proportion of Insurance
Row Labels Frequency Proportion
Medicare/Medicaid 20 0.1
No Insurance 18 0.09
Private 95 0.475
Unknown 60 0.3
Workers Compensation 7 0.035
Grand Total 200 1
Table 3: Proportion of Gender
Row Labels Frequency Proportion
Female 121 0.605
Male 79 0.395
Grand Total 200 1
Table 4: Proportion of Severity
Row Labels Frequency Proportion
MEDIUM 128 0.64
MILD 26 0.13
SEVERE 46 0.23
Grand Total 200 1
Table 5: Test for average claim amount
Hypothesis Test for μ
Hypotheses
Null Hypothesis μ ≥ 77500
Alternative Hypothesis μ < 77500
Test Type Lower
Level of significance
α 0.05
Critical Region
Degrees of Freedom 199
Critical Value -1.6525
Sample Data
Sample Standard Deviation 32178.49647
⊘ This is a preview!⊘
Do you want full access?
Subscribe today to unlock all pages.
Trusted by 1+ million students worldwide
9DESCRIPTIVE ANALYTICS AND VISUALIZATION
Sample Mean 73457.49355
Sample Size 200
Standard Error of the Mean 2275.3633
t Sample Statistic -1.7766
p-value 0.0386
Decision
Reject Null Hypothesis
Table 6: Test for proportion of MILD or MEDIUM Severity Conditions
Hypothesis Test for π
Hypotheses
Null Hypothesis π ≤ 75%
Alternative Hypothesis π > 75%
Test Type Upper
Level of significance
α 0.05
Critical Region
Critical Value 1.6449
Sample Data
Sample Size 200
Count of 'Successes' 72
Sample proportion, p 36.00%
Standard Error 3.06%
z Sample Statistic -12.7373
p-value 1.0000
Decision
Fail to reject Null Hypothesis
Table 7: Test for difference in MILD or MEDIUM proportions across Gender
Hypothesis Test for π1 - π2
Hypotheses
Null Hypothesis π1 - π2 = 0%
Paraphrase This Document
Need a fresh take? Get an instant paraphrase of this document with our AI Paraphraser
10DESCRIPTIVE ANALYTICS AND VISUALIZATION
Alternative Hypothesis π1 - π2 <> 0%
Test Type Two
Level of significance
α 0.05
Critical Region
Lower Critical Value -1.9600
Upper Critical Value 1.9600
Sample Data
Sample 1 Data
Sample Size 121
Count of 'Successes' 94
Sample proportion, p1 77.69%
Sample 2 Data
Sample Size 79
Count of 'Successes' 60
Sample proportion, p2 75.95%
Pooled estimate of proportion 77.00%
Standard Error 6.09%
z Sample Statistic 0.2853
p-value 0.7754
Decision
Fail to reject Null Hypothesis
Table 8: Test for the difference in average claim amount with and without private attorney
Hypothesis Test for μ1 - μ2 (independent, unequal variances)
Hypotheses
Null Hypothesis μ1 - μ2 ≤ 0
Alternative Hypothesis μ1 - μ2 > 0
Test Type Upper
Level of significance
α 0.05
Critical Region
Degrees of Freedom 119
Critical Value 1.6578
Sample Results
Sample 1 Data (Private Attorney)
11DESCRIPTIVE ANALYTICS AND VISUALIZATION
Sample Standard Deviation 30414.88
Sample Mean 80501.07
Sample Size 137
Sample 2 Data (Not Private Attorney)
Sample Standard Deviation 30761.71
Sample Mean 58140.51
Sample Size 63
Standard Error of the Mean 4666.1187
t Sample Statistic 4.7921
p-value 0.0000
Decision
Reject Null Hypothesis
Table 9: Test for difference in the proportion of representation of Private Attorney for
Severe and Medium claims
Hypothesis Test for π1 - π2
Hypotheses
Null Hypothesis π1 - π2 ≤ 0%
Alternative Hypothesis π1 - π2 > 0%
Test Type Upper
Level of significance
α 0.05
Critical Region
Critical Value 1.6449
Sample Data
Sample 1 Data (SEVERE)
Sample Size 46
Count of 'Successes' 36
Sample proportion, p1 78.26%
Sample 2 Data (MEDIUM)
Sample Size 128
Count of 'Successes' 93
Sample proportion, p2 72.66%
Pooled estimate of proportion 74.14%
⊘ This is a preview!⊘
Do you want full access?
Subscribe today to unlock all pages.
Trusted by 1+ million students worldwide
1 out of 14
Related Documents


Your All-in-One AI-Powered Toolkit for Academic Success.
+13062052269
info@desklib.com
Available 24*7 on WhatsApp / Email
![[object Object]](/_next/static/media/star-bottom.7253800d.svg)
Unlock your academic potential
Copyright © 2020–2026 A2Z Services. All Rights Reserved. Developed and managed by ZUCOL.