Statistical Analysis of Phone Call Data: Mean, Median, and More

Verified

Added on  2023/01/07

|10
|1355
|59
Homework Assignment
AI Summary
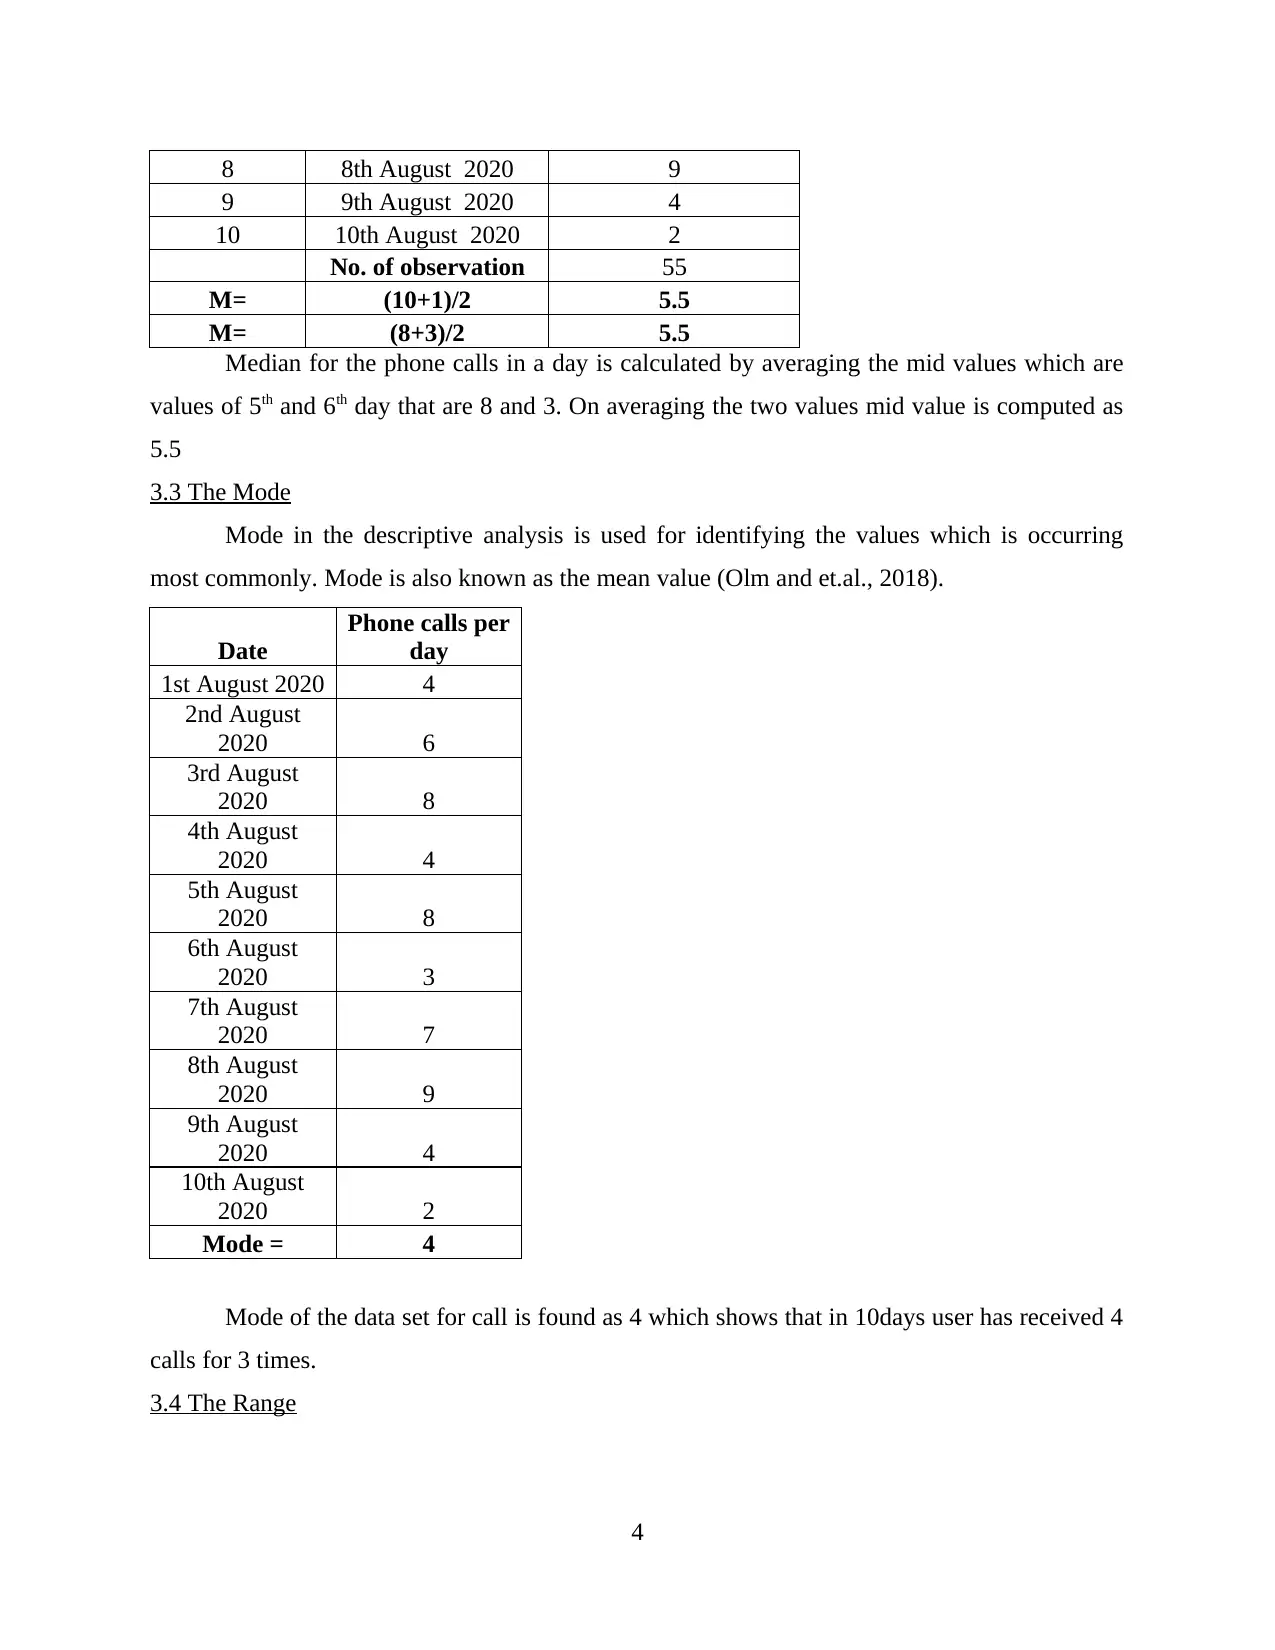
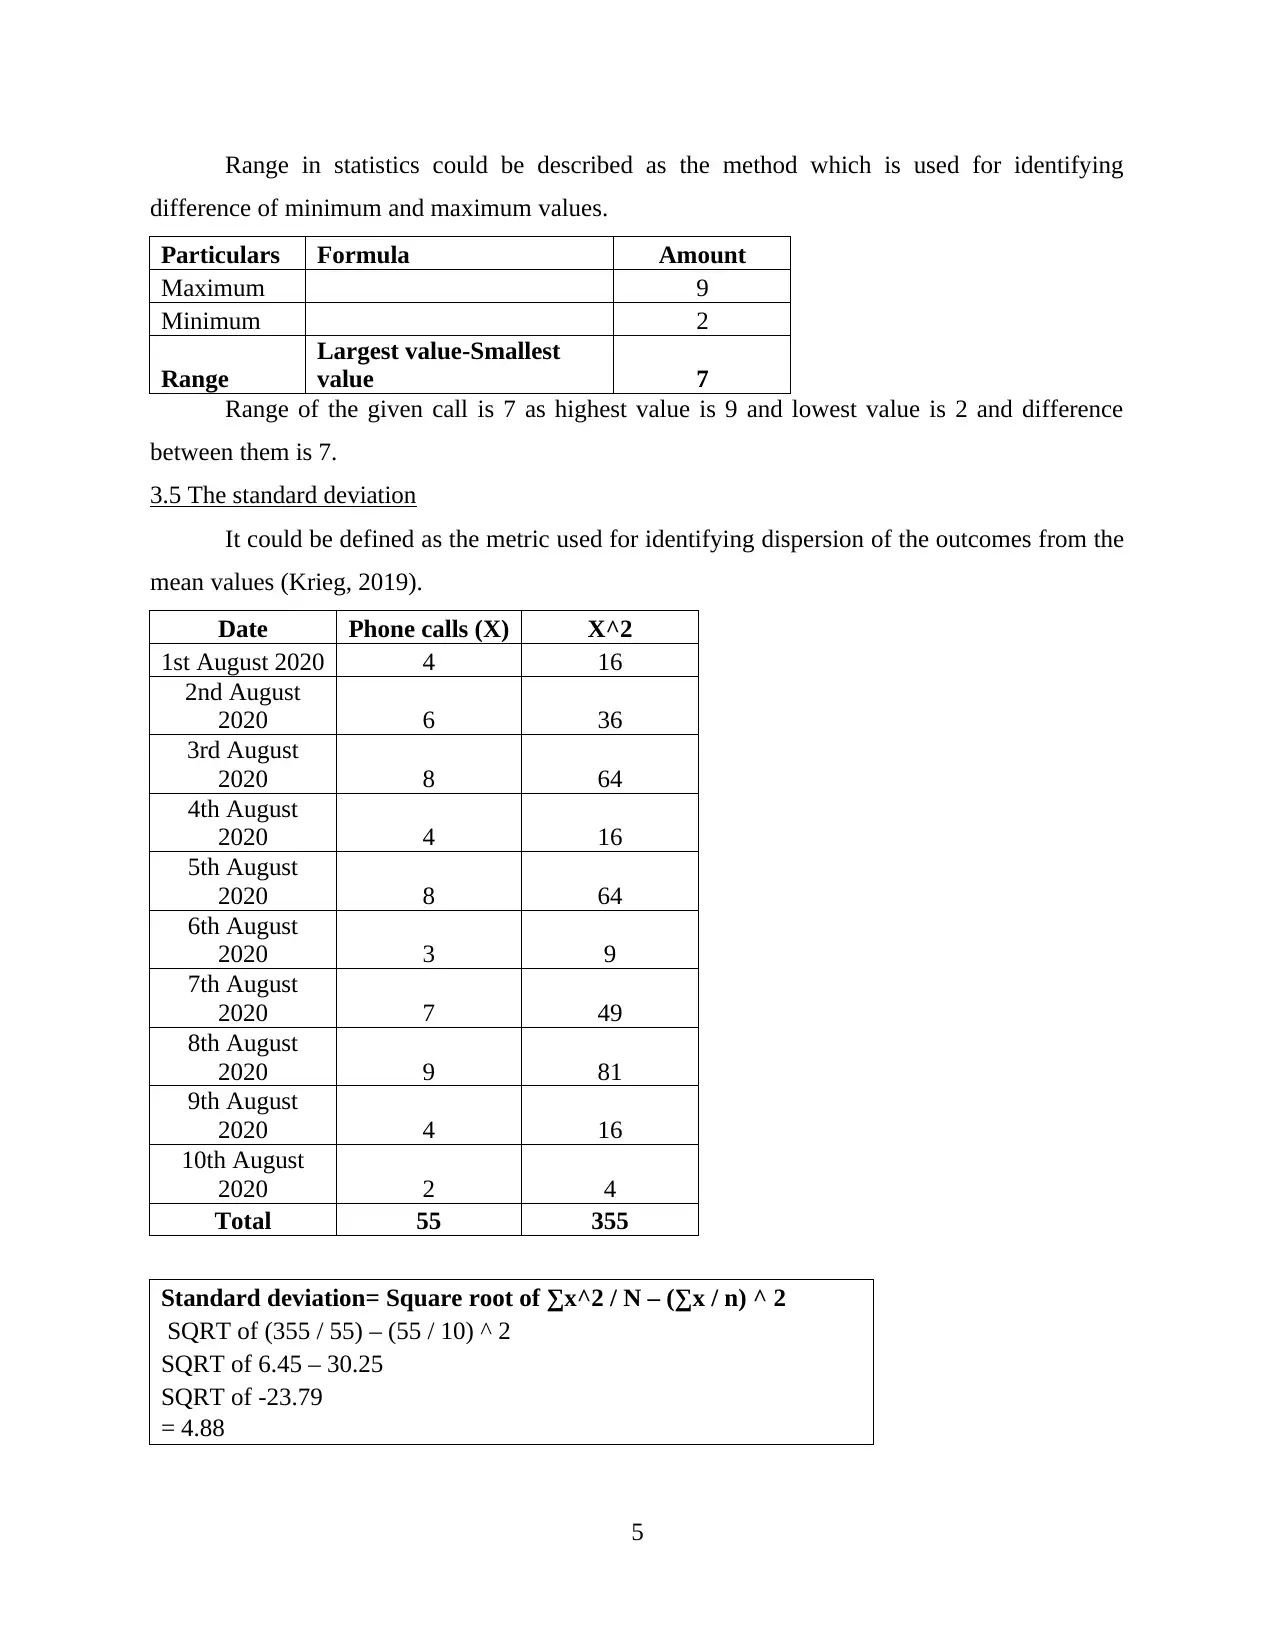
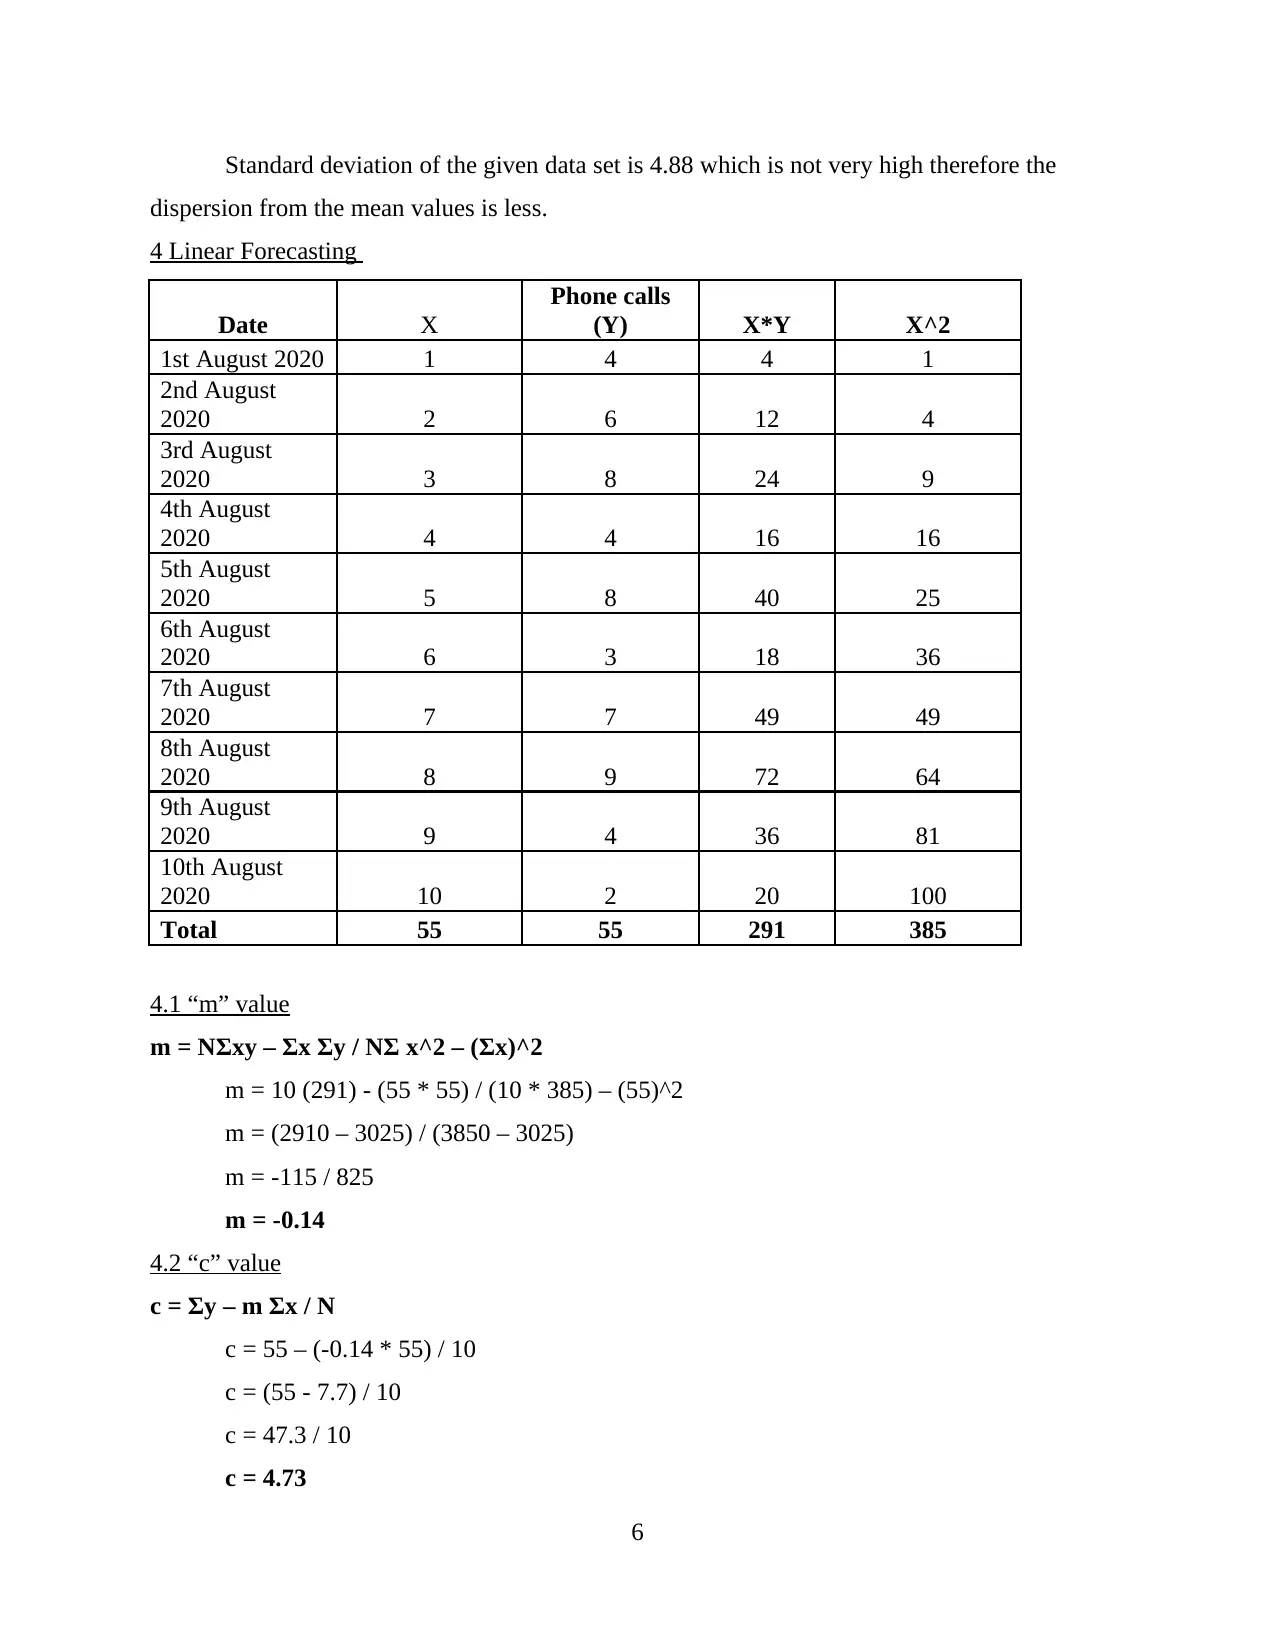
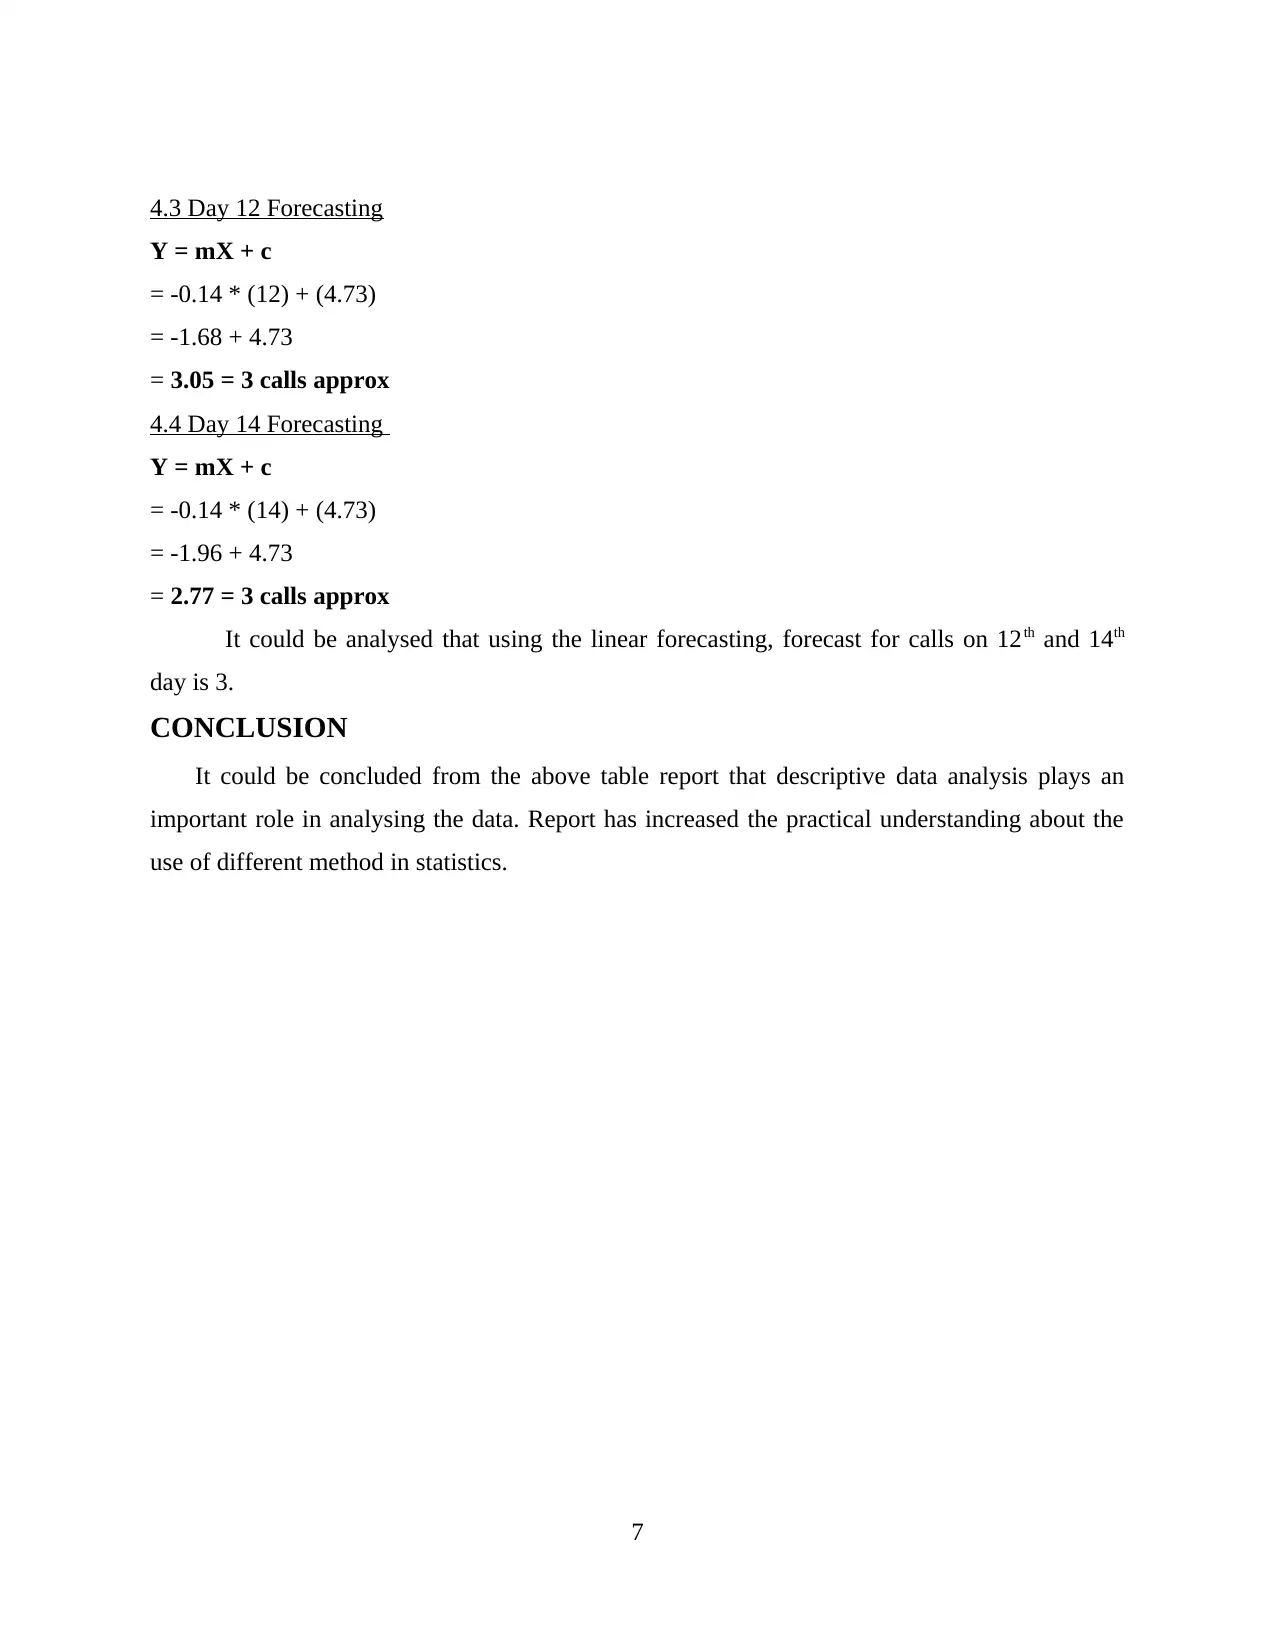
This assignment provides a comprehensive analysis of phone call data. It begins with creating a table to organize the data and then presents the data visually using column and line charts. The core of the assignment involves calculating key descriptive statistics: mean, median, mode, range, and standard deviation, providing insights into the central tendencies and variability of the data. Furthermore, the assignment applies linear forecasting to predict future phone call volumes. The analysis includes step-by-step calculations and interpretations, demonstrating a practical understanding of statistical methods. The report concludes with a summary of the findings and references to supporting literature.
Document Page
NDA
tabler-icon-diamond-filled.svg

Secure Best Marks with AI Grader

Need help grading? Try our AI Grader for instant feedback on your assignments.
Document Page
TABLE OF CONTENTS
TABLE OF CONTENTS................................................................................................................2
INTRODUTION..............................................................................................................................1
TASK...............................................................................................................................................1
1. Creating a table for the data related to phone calls..................................................................1
2. Presentation of data for phone calls in graphical format.........................................................1
3. Mean, Median, range and standard deviation..........................................................................3
4 Linear Forecasting....................................................................................................................6
CONCLUSION................................................................................................................................7
REFERENCES................................................................................................................................8
Document Page
INTRODUTION
Descriptive analysis is important and first step in conducting the statistical analyses. It helps
in appropriate distribution of the data which helps in detecting the typos and outliers and enable
them to identify the association among the variables, enabling them to make further research.
TASK
1. Creating a table for the data related to phone calls
Sr. No. Date
Phone calls
per day
1 1st August 2020 4
2
2nd August
2020 6
3
3rd August
2020 8
4
4th August
2020 4
5
5th August
2020 8
6
6th August
2020 3
7
7th August
2020 7
8
8th August
2020 9
9
9th August
2020 4
10
10th August
2020 2
2. Presentation of data for phone calls in graphical format
1
Document Page
2.1 Column Chart
01-Jul-
20 02-Jul-
20 03-Jul-
20 04-Jul-
20 05-Jul-
20 06-Jul-
20 07-Jul-
20 08-Jul-
20 09-Jul-
20 10-Jul-
20
1 2 3 4 5 6 7 8 9 10
0
1
2
3
4
5
6
7
8
9
Phone calls per day
Phone calls per day
2.2 Line Chart
30/Jun/20 02/Jul/20 04/Jul/20 06/Jul/20 08/Jul/20 10/Jul/20 12/Jul/20
0
1
2
3
4
5
6
7
8
9
10
Phone calls per day Phone calls per day
days
no of phone calls
2
tabler-icon-diamond-filled.svg

Secure Best Marks with AI Grader

Need help grading? Try our AI Grader for instant feedback on your assignments.
Document Page
3. Mean, Median, range and standard deviation
3.1 The mean
It is the metric that is used for finding the average value of the given data in statistics. It
is the first step in statistics which is used for analysing data (Jiang and Yu, 2017).
Sr. No. Date
Phone calls
per day
1 1st August 2020 4
2 2nd August 2020 6
3 3rd August 2020 8
4 4th August 2020 4
5 5th August 2020 8
6 6th August 2020 3
7 7th August 2020 7
8 8th August 2020 9
9 9th August 2020 4
10 10th August 2020 2
Sum total of phone
calls 55
No. of observation 10
Mean 5.5
In the given data mean is computed by sum of observations divided by no of
observations. It is essential for the experts to identify the average occurrence of value in given
data set. Mean in the data for phone calls is 5.5.
3.2 The Median
It could be described as the measure of the central tendency in the descriptive analysis. it
is used by the experts and researchers to identify the mid values.
Sr. No. Date
Data in relation to
phone calls per day
1 1st August 2020 4
2 2nd August 2020 6
3 3rd August 2020 8
4 4th August 2020 4
5 5th August 2020 8
6 6th August 2020 3
7 7th August 2020 7
3
Document Page
8 8th August 2020 9
9 9th August 2020 4
10 10th August 2020 2
No. of observation 55
M= (10+1)/2 5.5
M= (8+3)/2 5.5
Median for the phone calls in a day is calculated by averaging the mid values which are
values of 5th and 6th day that are 8 and 3. On averaging the two values mid value is computed as
5.5
3.3 The Mode
Mode in the descriptive analysis is used for identifying the values which is occurring
most commonly. Mode is also known as the mean value (Olm and et.al., 2018).
Date
Phone calls per
day
1st August 2020 4
2nd August
2020 6
3rd August
2020 8
4th August
2020 4
5th August
2020 8
6th August
2020 3
7th August
2020 7
8th August
2020 9
9th August
2020 4
10th August
2020 2
Mode = 4
Mode of the data set for call is found as 4 which shows that in 10days user has received 4
calls for 3 times.
3.4 The Range
4
Document Page
Range in statistics could be described as the method which is used for identifying
difference of minimum and maximum values.
Particulars Formula Amount
Maximum 9
Minimum 2
Range
Largest value-Smallest
value 7
Range of the given call is 7 as highest value is 9 and lowest value is 2 and difference
between them is 7.
3.5 The standard deviation
It could be defined as the metric used for identifying dispersion of the outcomes from the
mean values (Krieg, 2019).
Date Phone calls (X) X^2
1st August 2020 4 16
2nd August
2020 6 36
3rd August
2020 8 64
4th August
2020 4 16
5th August
2020 8 64
6th August
2020 3 9
7th August
2020 7 49
8th August
2020 9 81
9th August
2020 4 16
10th August
2020 2 4
Total 55 355
Standard deviation= Square root of ∑x^2 / N – (∑x / n) ^ 2
SQRT of (355 / 55) – (55 / 10) ^ 2
SQRT of 6.45 – 30.25
SQRT of -23.79
= 4.88
5
tabler-icon-diamond-filled.svg

Paraphrase This Document

Need a fresh take? Get an instant paraphrase of this document with our AI Paraphraser
Document Page
Standard deviation of the given data set is 4.88 which is not very high therefore the
dispersion from the mean values is less.
4 Linear Forecasting
Date X
Phone calls
(Y) X*Y X^2
1st August 2020 1 4 4 1
2nd August
2020 2 6 12 4
3rd August
2020 3 8 24 9
4th August
2020 4 4 16 16
5th August
2020 5 8 40 25
6th August
2020 6 3 18 36
7th August
2020 7 7 49 49
8th August
2020 8 9 72 64
9th August
2020 9 4 36 81
10th August
2020 10 2 20 100
Total 55 55 291 385
4.1 “m” value
m = NΣxy – Σx Σy / NΣ x^2 – (Σx)^2
m = 10 (291) - (55 * 55) / (10 * 385) – (55)^2
m = (2910 – 3025) / (3850 – 3025)
m = -115 / 825
m = -0.14
4.2 “c” value
c = Σy – m Σx / N
c = 55 – (-0.14 * 55) / 10
c = (55 - 7.7) / 10
c = 47.3 / 10
c = 4.73
6
Document Page
4.3 Day 12 Forecasting
Y = mX + c
= -0.14 * (12) + (4.73)
= -1.68 + 4.73
= 3.05 = 3 calls approx
4.4 Day 14 Forecasting
Y = mX + c
= -0.14 * (14) + (4.73)
= -1.96 + 4.73
= 2.77 = 3 calls approx
It could be analysed that using the linear forecasting, forecast for calls on 12th and 14th
day is 3.
CONCLUSION
It could be concluded from the above table report that descriptive data analysis plays an
important role in analysing the data. Report has increased the practical understanding about the
use of different method in statistics.
7
Document Page
REFERENCES
Books and Journals
Jiang, W. and Yu, W., 2017. Controlling the joint local false discovery rate is more powerful
than meta-analysis methods in joint analysis of summary statistics from multiple genome-
wide association studies. Bioinformatics. 33(4). pp.500-507.
Olm, M., and et.al., 2018. Operative treatment of diabetics with vascular complications:
Secondary data analysis of diagnosis-related groups statistics from 2005 to 2014 in
Germany. Der Chirurg; Zeitschrift fur alle Gebiete der operativen Medizen. 89(7). p.545.
Krieg, E.J., 2019. Statistics and data analysis for social science. SAGE Publications,
8
chevron_up_icon
1 out of 10
circle_padding
hide_on_mobile
zoom_out_icon
logo.png

Your All-in-One AI-Powered Toolkit for Academic Success.

Available 24*7 on WhatsApp / Email

[object Object]