Report: Descriptive Analytics of Medical Malpractice Claims Data
VerifiedAdded on 2023/03/20
|10
|2314
|66
Report
AI Summary
This business report presents a descriptive analysis of medical malpractice claims data, based on a study in the US. The report examines 200 randomly selected claims, focusing on the cost of medical malpractice in the United States, the profile of a typical claimant (including age and insurance status), and comparisons against industry standards. It analyzes the relationship between physician specialty and claim severity, including the percentage of severe claims with orthopaedic surgeons and average claim amounts. The analysis includes statistical measures such as average age, standard deviation, frequency, and correlations to evaluate the dynamics of medical malpractice claims. The report concludes with a summary of findings and references to relevant literature.
Descriptive Analytics
and Visualisation
and Visualisation
Paraphrase This Document
Need a fresh take? Get an instant paraphrase of this document with our AI Paraphraser
Table of Contents
BUSINESS REPORT.......................................................................................................................1
INRODUCTION..............................................................................................................................1
Q1: Overall summary.............................................................................................................1
Q2: Development of a profile of a typical claimant...............................................................1
(a): Average age of claimants.................................................................................................1
(b): Proportion of claimants with no insurances.....................................................................2
Q3. Comparison of year's claim data against several industry standards...............................2
(a): Evidence to support argument.........................................................................................2
(b) Evaluation of statement whether it is valid for all parties................................................2
(c) Analysation of difference in proportion of mild or medium.............................................2
d) Data support this proportion...............................................................................................3
e) Analysis between 'SEVERE' claims for claims with a 'MEDIUM' severity......................3
Q.4 Relationship between the speciality of the physician......................................................4
involved, the severity of the claim........................................................................................4
(a): Percentage of SEVERE claims with orthopaedic surgeon is lower.................................4
(b): Average claim amount for SEVERE claim is higher.......................................................4
CONCLUSION................................................................................................................................5
REFERENCES................................................................................................................................6
APPENDIX ....................................................................................................................................7

⊘ This is a preview!⊘
Do you want full access?
Subscribe today to unlock all pages.
Trusted by 1+ million students worldwide
BUSINESS REPORT
INRODUCTION
This is an analytical reports which is prepared subject to a study in the US news and
world report. This case study is based upon cost of medical malpractice in the United states. The
United Health Group of America's most outstanding health and insurance provide which
collected range of data and wants to understand the dynamics of claims which are paid out for
medical malpractice lawsuits. This analytical report is based upon 200 randomly selected claims
made this year.
Q1: Overall summary
This project report is all about discussing cost of medical malpractices in UK which is
evaluated as $ 55.6billion in a year. A total of 7.4 percent of every physicians licensed in various
parts of US which is having a malpractice claims. Such staggering count is not only contribute to
high cost of health care but total size of successful malpractice claims in accounts to high
premiums for medical malpractices insurances. This report provide valuable information about
various descriptive data analysis about total claim payment amount. The analysis is done by
taking take reviews from total 200 randomized claims during the year. The overall project guide
as to evaluate proper understanding of results those are helpful in attaining maximum growth
opportunities in next couple of years.
Q2: Development of a profile of a typical claimant
(a): Average age of claimants
As per above analysis of a profile of typical claimant following results come across such as:
average age of claimants is determined 44.49 years. standard deviation is computed as 17.692
subject to portion of claimants. Median is computed as 45.00 and mode is calculated as 50.
variance analysis also done subject to evaluate the aspects of average claimants. Variance is
calculated as 312.995
Frequency of gender also computed in respect of male and female. Descriptive statistics
also determined subject to claimant ID and age factors. Minimum, maximum mean and standard
deviation is also computed.
1
Paraphrase This Document
Need a fresh take? Get an instant paraphrase of this document with our AI Paraphraser
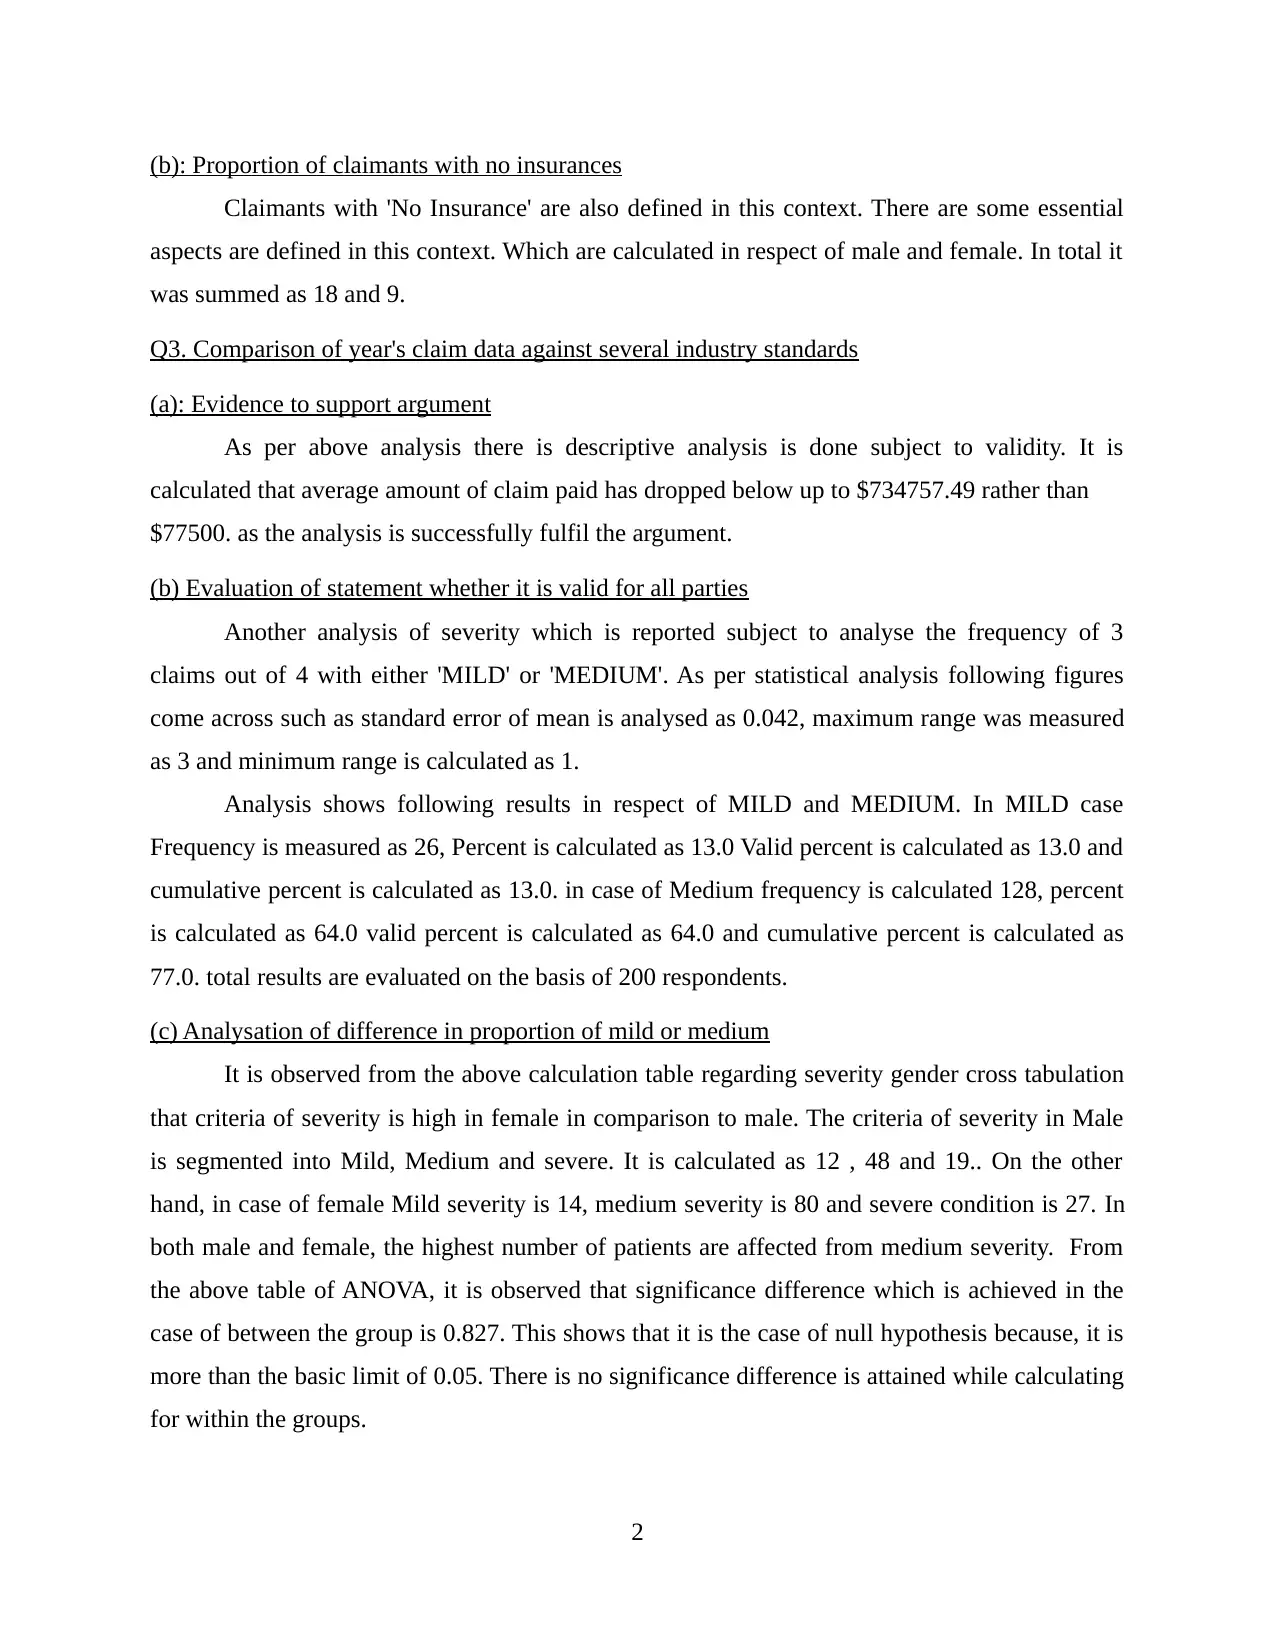
(b): Proportion of claimants with no insurances
Claimants with 'No Insurance' are also defined in this context. There are some essential
aspects are defined in this context. Which are calculated in respect of male and female. In total it
was summed as 18 and 9.
Q3. Comparison of year's claim data against several industry standards
(a): Evidence to support argument
As per above analysis there is descriptive analysis is done subject to validity. It is
calculated that average amount of claim paid has dropped below up to $734757.49 rather than
$77500. as the analysis is successfully fulfil the argument.
(b) Evaluation of statement whether it is valid for all parties
Another analysis of severity which is reported subject to analyse the frequency of 3
claims out of 4 with either 'MILD' or 'MEDIUM'. As per statistical analysis following figures
come across such as standard error of mean is analysed as 0.042, maximum range was measured
as 3 and minimum range is calculated as 1.
Analysis shows following results in respect of MILD and MEDIUM. In MILD case
Frequency is measured as 26, Percent is calculated as 13.0 Valid percent is calculated as 13.0 and
cumulative percent is calculated as 13.0. in case of Medium frequency is calculated 128, percent
is calculated as 64.0 valid percent is calculated as 64.0 and cumulative percent is calculated as
77.0. total results are evaluated on the basis of 200 respondents.
(c) Analysation of difference in proportion of mild or medium
It is observed from the above calculation table regarding severity gender cross tabulation
that criteria of severity is high in female in comparison to male. The criteria of severity in Male
is segmented into Mild, Medium and severe. It is calculated as 12 , 48 and 19.. On the other
hand, in case of female Mild severity is 14, medium severity is 80 and severe condition is 27. In
both male and female, the highest number of patients are affected from medium severity. From
the above table of ANOVA, it is observed that significance difference which is achieved in the
case of between the group is 0.827. This shows that it is the case of null hypothesis because, it is
more than the basic limit of 0.05. There is no significance difference is attained while calculating
for within the groups.
2
d) Data support this proportion
Descriptive analysis
AS an industry standard there are some essential aspects also come across in respect of
payment amounts. Descriptive analysis and correlations are measured in respect of Private
attorney and the claimant. There are some followings results found by descriptive statistics
analysis of Private Attorney such as mean is calculated 1.32, standard deviation present .466
subject to 200 respondents.
Descriptive statistical analysis subject to Claimant ID present following results such as
mean is computed such as 100.50, standard deviation is calculated as 57.879 subject to numbers
of 200 respondents.
Correlations
This analysis is done in respect of analysing the pairs which remain highly related to each
other. As per above given case, there is a correlation is established in respect of Private Attorney
and involved with in Claimant ID.
Correlation analysis in respect of Private attorney presents following results such as
Person correlation indicates towards 1 and claimant ID as -0.007. significant (2 Tailed ) is
found as 0.924. sum of squares and cross products are evaluated as 43.155 for private attorney
and -36.500
Correlation analysis in respect of Claimant ID
Person correlation is computed as -0.007 in respect of private attorney as 1 is computed
as Claimant ID. Significant (2 Tailed) is calculated as 0.952. sum of squares and cross products
are defined in this subject -36.500 as private attorney and 666650.000 for Claimant ID.
Covariance is computed as -0.183 for private attorney and 3350 for claimant ID.
As per above analysis it is evaluated that average claim amount when a private attorney.
As per above analysis data do not support the proposition because there is no any significant
difference exist between Private attorney and Claimant ID.
e) Analysis between 'SEVERE' claims for claims with a 'MEDIUM' severity
Group statistics is analysed subject to Private attorney. Mean is calculated as 1.69, Std.
Deviation is calculated as .471 and standard error mean is calculated as 0.092 in respect of
SEVERE.
3
⊘ This is a preview!⊘
Do you want full access?
Subscribe today to unlock all pages.
Trusted by 1+ million students worldwide
Group statistics analysis in respect of MEDIUM shows following results as follows;
Mean is calculated as 1.27, standard deviation is calculated as .447 and standard error mean is
calculated as .040.
Q.4 Relationship between the speciality of the physician
involved, the severity of the claim
(a): Percentage of SEVERE claims with orthopaedic surgeon is lower
From the above information, it has been seen that in order to understand positive
relationship among speciality of higher for SEVERE claims in accordance with orthopaedic
surgeons is much lower than that of other specialists. As per the sample statistics table, it has
been found that Severe people categorise in respect to orthopaedic is much lower as compare to
other specialist. The data is being taken from 200 sample size of respondents. The total mean of
orthopaedic is about 2.1450 with standard deviation of 1.19. This would be analyse that severity
has significance difference of .849. Under this particular situation, it has been determine that
there is no significance differences in the mentioned table. The alternative hypothesis is being
rejected. In order to become positive in relationship they need to be have difference of 0.5. The
United Health group has determine that prominent health insurances provider has gathered a
wide range of data and wants to formulate a better understanding of their claims those are being
paid out for medical malpractice. In case of probability value is much taken into consideration
which is lower that other specialists. The effect is statistically important and null hypothesis is
not accepted. If the null hypothesis is rejected, then the alternative to null is taken into
consideration. The hypothesis that is providing data does not conform and provide relative
outcomes in accordance to other specialities. In case of 95% significance level, the results are
collected as .635 which is collected by using data from two variables.
(b): Average claim amount for SEVERE claim is higher
According to the above data which is being presented by taking information from severe
and orthopaedic surgeon relationship. In this particular situation, a total average sum of outcomes
is being determine by using variable outcomes whether their total claim are much higher as
compare to other specialist. If data is included under these situation they are getting 100% of
outcomes which is much higher as compare to other valuable specialist those are responsible for
delivering better results in accordance with the SEVERE patients.
4
Paraphrase This Document
Need a fresh take? Get an instant paraphrase of this document with our AI Paraphraser
Some useful analysis is done by using paired differences which has been collected from
total mean value of .04500 with standard deviation of 1.33. With 95% of confidence level they
are getting .635 of significance differences. It means that there is no any significance difference
among those two variable. It means that alternative hypothesis will be accepted. In order to
measure regression which is indicating negative outcomes in respect to health care issues that are
being faced by SEVERE patients. The orthopaedic surgeons involvement are more higher as
compare to other specialist. The total average claim amount for SEVERE is much higher which
means that there is positive relationship exists among both of them.
CONCLUSION
There is a report is prepared on the basis of statistical analysis of dataset information about 200
randomly selected claims made for the year. A detailed analysis and summary reports is prepared
in this context.
5
REFERENCES
Books and Journals:
Munzner, T., 2014. Visualization analysis and design. CRC press.
Assunção, M. D. And et. al., 2015. Big Data computing and clouds: Trends and future
directions. Journal of Parallel and Distributed Computing. 79. pp.3-15.
Drucker, J., 2014. Graphesis: Visual forms of knowledge production. Harvard University Press.
Gabadinho, A., Ritschard, G., Mueller, N. S. and Studer, M., 2011. Analyzing and visualizing
state sequences in R with TraMineR. Journal of Statistical Software. 40(4). pp.1-37.
De Luca, L. and et. Al., 2011. A semantic-based platform for the digital analysis of architectural
heritage. Computers & Graphics. 35(2). pp.227-241.
Wang, Y. Q., 2014. MeteoInfo: GIS software for meteorological data visualization and
analysis. Meteorological Applications. 21(2). pp.360-368.
Cobo, M.J. And et. al., 2011. An approach for detecting, quantifying, and visualizing the
evolution of a research field: A practical application to the fuzzy sets theory
field. Journal of Informetrics. 5(1). pp.146-166.
Bazeley, P., 2013. Qualitative data analysis: Practical strategies. Sage.
Kolaczyk, E.D. and Csárdi, G., 2014. Statistical analysis of network data with R (Vol. 65). New
York: Springer.
Ali, L., Hatala, M., Gašević, D. and Jovanović, J., 2012. A qualitative evaluation of evolution of
a learning analytics tool. Computers & Education. 58(1). pp.470-489.
Online
Descriptive analysis, 2006. [Online]. Available through:
<https://www.socialresearchmethods.net/kb/statdesc.htm>.
6
⊘ This is a preview!⊘
Do you want full access?
Subscribe today to unlock all pages.
Trusted by 1+ million students worldwide
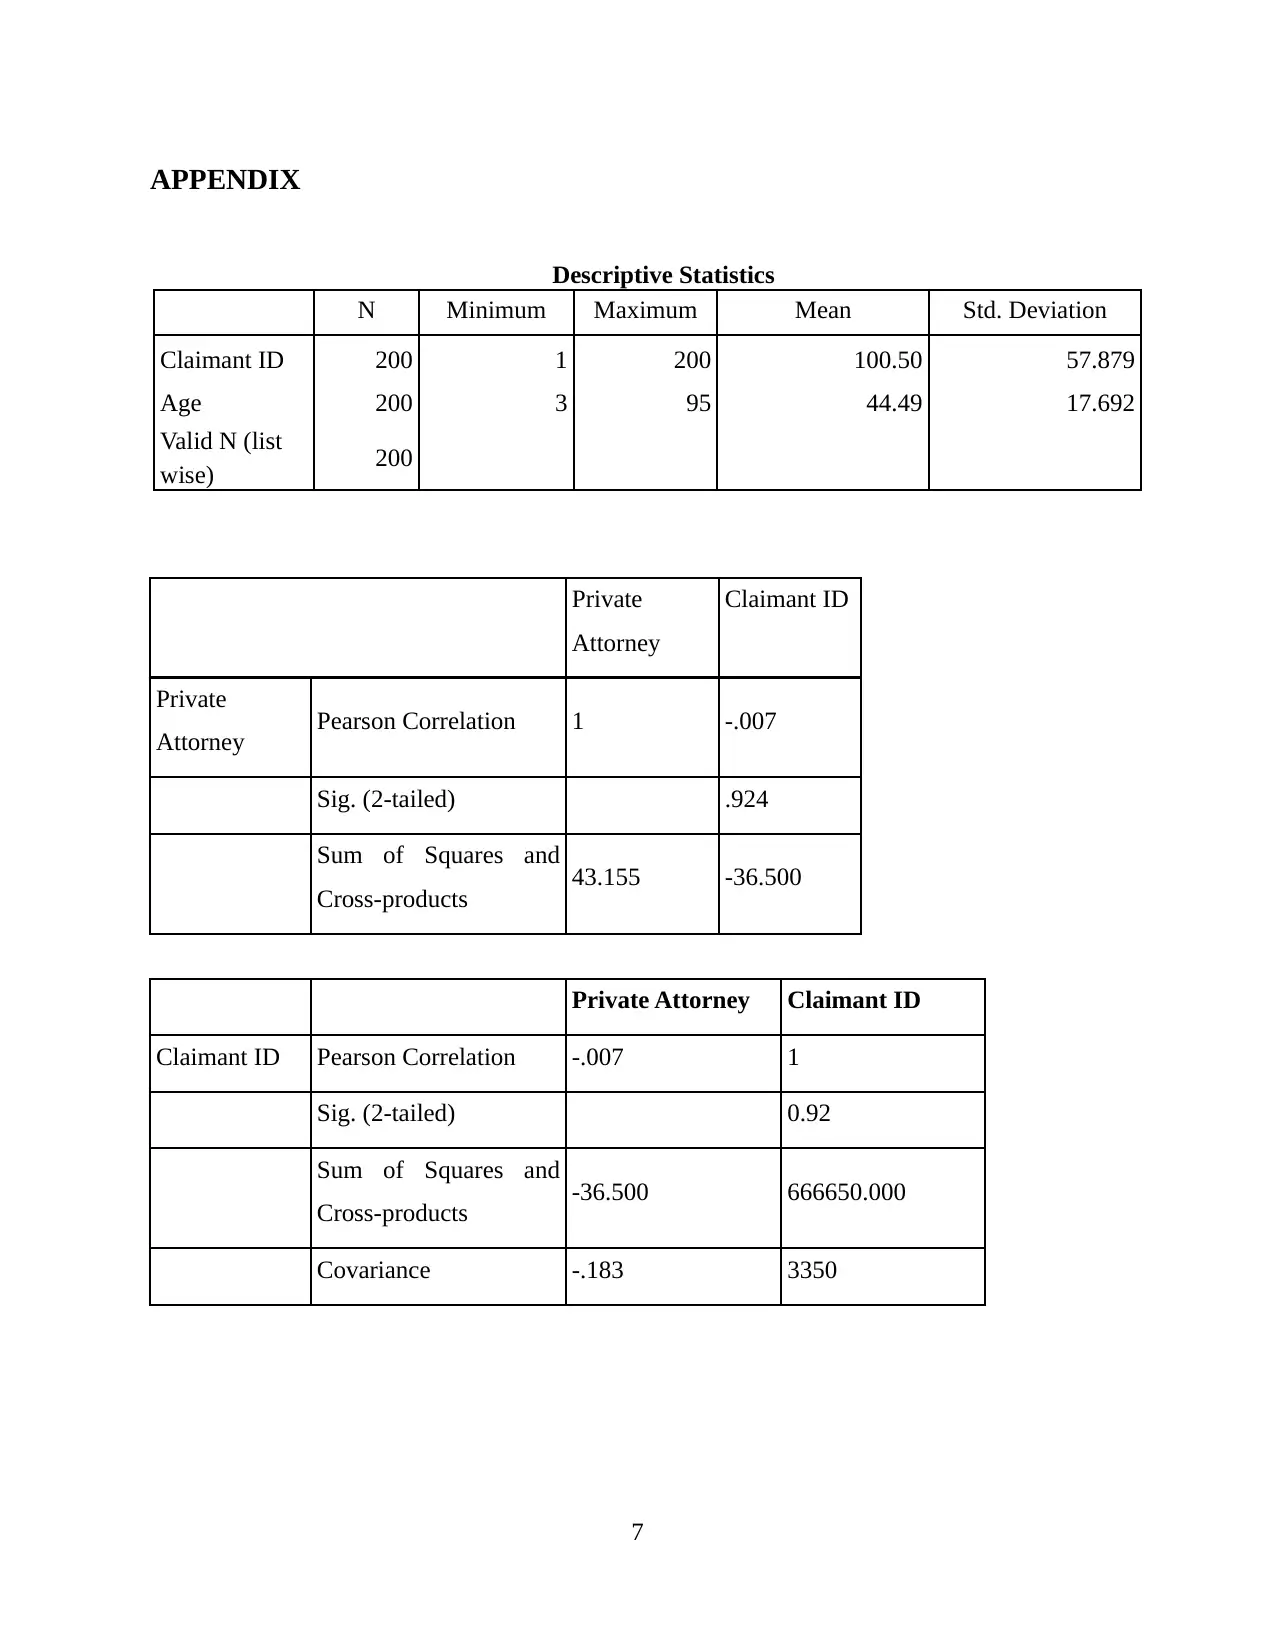
APPENDIX
Descriptive Statistics
N Minimum Maximum Mean Std. Deviation
Claimant ID 200 1 200 100.50 57.879
Age 200 3 95 44.49 17.692
Valid N (list
wise) 200
Private
Attorney
Claimant ID
Private
Attorney Pearson Correlation 1 -.007
Sig. (2-tailed) .924
Sum of Squares and
Cross-products 43.155 -36.500
Private Attorney Claimant ID
Claimant ID Pearson Correlation -.007 1
Sig. (2-tailed) 0.92
Sum of Squares and
Cross-products -36.500 666650.000
Covariance -.183 3350
7
1 out of 10
Related Documents


Your All-in-One AI-Powered Toolkit for Academic Success.
+13062052269
info@desklib.com
Available 24*7 on WhatsApp / Email
![[object Object]](/_next/static/media/star-bottom.7253800d.svg)
Unlock your academic potential
Copyright © 2020–2026 A2Z Services. All Rights Reserved. Developed and managed by ZUCOL.