Descriptive and Inferential Data Analysis Report - United Health Group
VerifiedAdded on 2023/06/14
|26
|2779
|470
Report
AI Summary
This report presents a data analysis of insurance claims, employing descriptive and inferential statistics. Descriptive statistics highlight an average claim payment of $73457.49, with a 95% probability of claims falling between $68970.58 and $77944.41. The average claimant age is 44.49 years, with a 95% confidence interval between 42.02 and 46.96 years. Hypothesis testing reveals that the average paid claim amount is likely below $77,500, and the proportion of 'MILD' or 'MEDIUM' severity claims is at least 75%. Gender significantly impacts claim severity proportions. Claim amounts are higher when claimants have private attorneys. The proportion of private attorney representation is similar for both 'SEVERE' and 'MEDIUM' claims. Finally, the analysis indicates that the percentage of 'SEVERE' claims does not significantly differ between Orthopaedic surgeons and other specialists, and the average claim amount for 'SEVERE' severity is not higher for Orthopaedic surgeons.
Running head: DATA ANALYSIS
Descriptive and Inferential Analytics
Name of the Student:
Name of the University:
Author’s Note:
Descriptive and Inferential Analytics
Name of the Student:
Name of the University:
Author’s Note:
Paraphrase This Document
Need a fresh take? Get an instant paraphrase of this document with our AI Paraphraser
1DATA ANALYSIS
Table of Contents
Introduction:...............................................................................................................................2
1. Descriptive Statistics:.............................................................................................................2
2. Estimation:.........................................................................................................................2
2.a)......................................................................................................................................2
2. b)....................................................................................................................................3
Answer 3................................................................................................................................3
3.a)......................................................................................................................................3
3. b)....................................................................................................................................3
3.c)......................................................................................................................................4
3.d).....................................................................................................................................4
3. e).....................................................................................................................................4
Answer 4................................................................................................................................5
4. a).....................................................................................................................................5
4.b).....................................................................................................................................5
Conclusion:................................................................................................................................6
References:.................................................................................................................................7
Appendix:...................................................................................................................................8
2DATA ANALYSIS
Table of Tables
Table 1......................................................................................................................................12
Table 2......................................................................................................................................12
Table 3......................................................................................................................................12
Table 4......................................................................................................................................13
Table 5......................................................................................................................................14
Table 6......................................................................................................................................15
Table 7.1...................................................................................................................................17
Table 7.2……………………………………………………………………………………...18
Table 8......................................................................................................................................20
Table 9......................................................................................................................................22
Table 10.1.................................................................................................................................23
Table 10.2……………………………………………………………………………………24
Table of Figures
Figure 1....................................................................................................................................13
Figure 2....................................................................................................................................14
Figure 3....................................................................................................................................15
Figure 4....................................................................................................................................16
Figure 5....................................................................................................................................19
Figure 6....................................................................................................................................21
Figure 7....................................................................................................................................24
Figure 8....................................................................................................................................26
⊘ This is a preview!⊘
Do you want full access?
Subscribe today to unlock all pages.
Trusted by 1+ million students worldwide
3DATA ANALYSIS
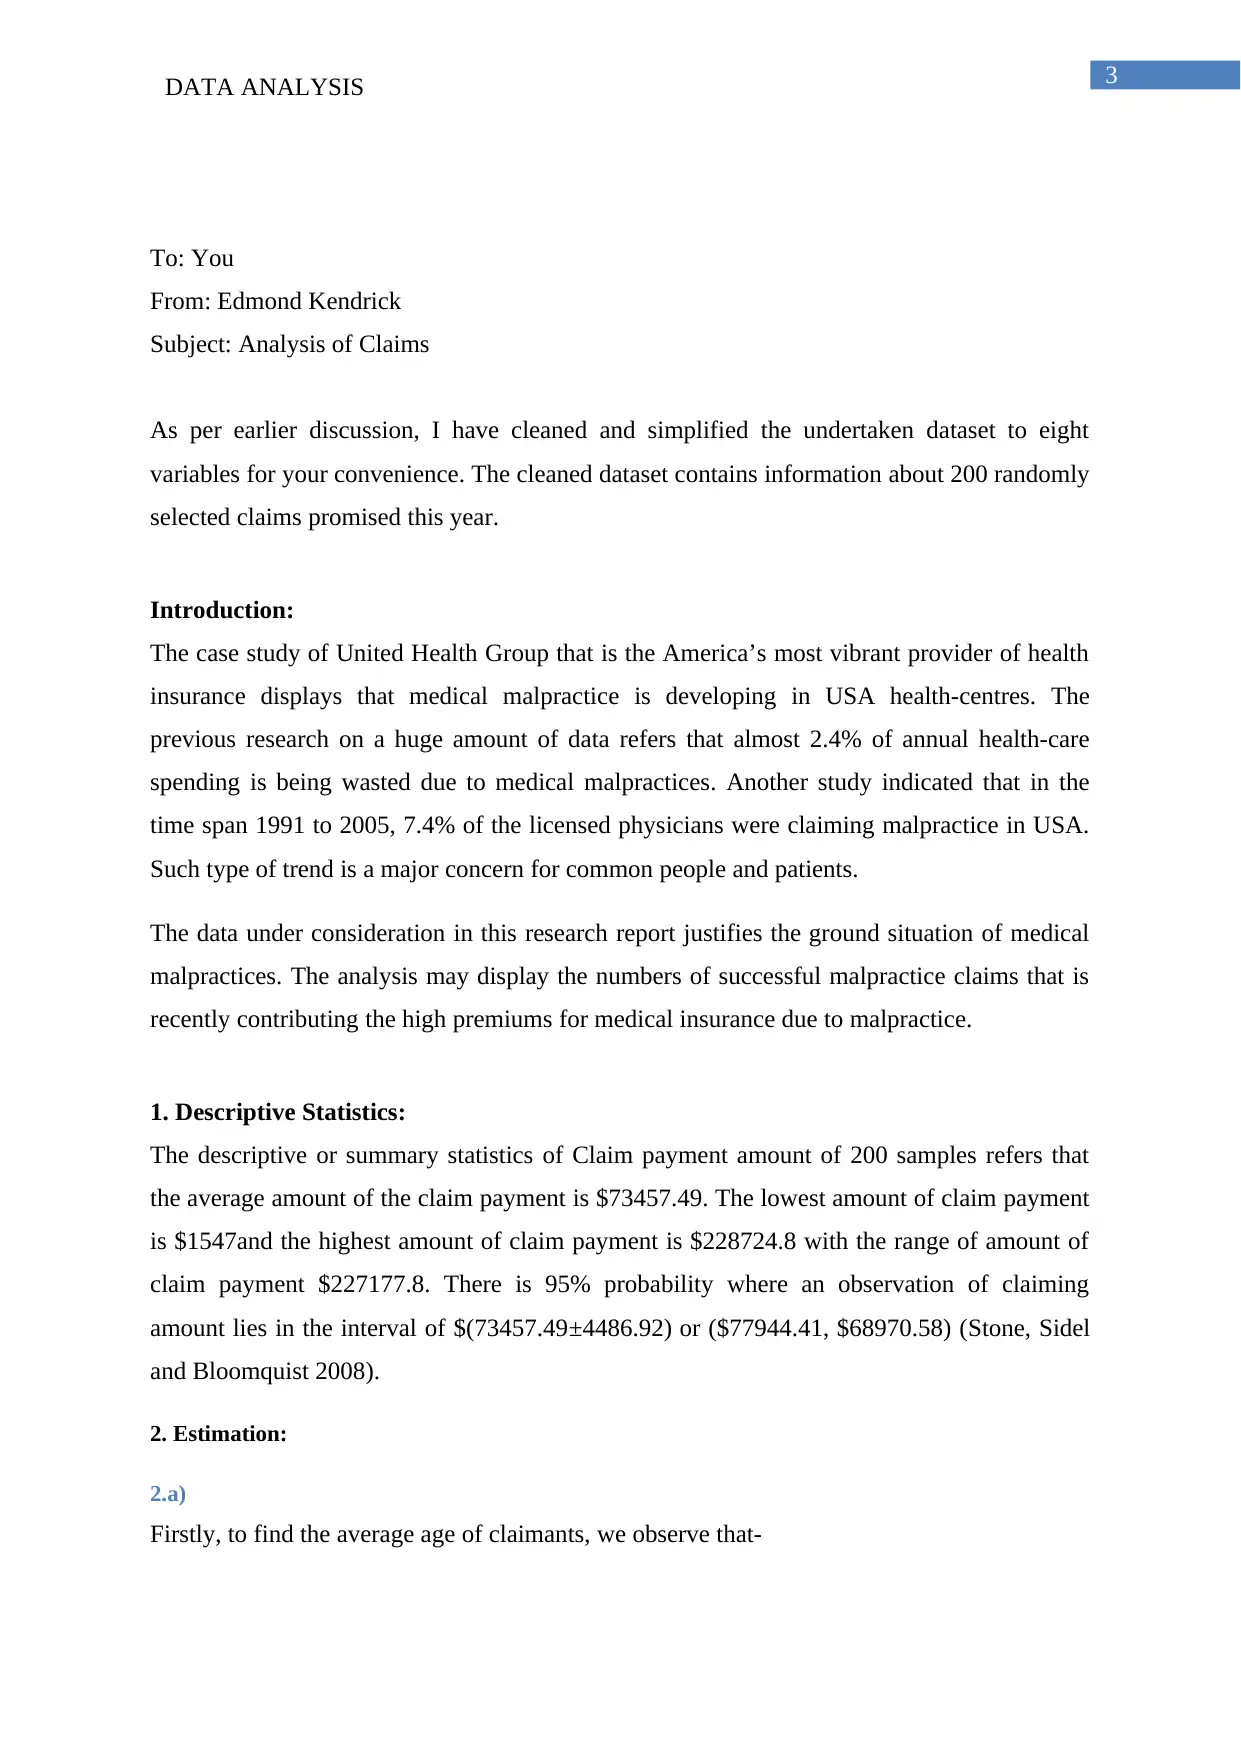
To: You
From: Edmond Kendrick
Subject: Analysis of Claims
As per earlier discussion, I have cleaned and simplified the undertaken dataset to eight
variables for your convenience. The cleaned dataset contains information about 200 randomly
selected claims promised this year.
Introduction:
The case study of United Health Group that is the America’s most vibrant provider of health
insurance displays that medical malpractice is developing in USA health-centres. The
previous research on a huge amount of data refers that almost 2.4% of annual health-care
spending is being wasted due to medical malpractices. Another study indicated that in the
time span 1991 to 2005, 7.4% of the licensed physicians were claiming malpractice in USA.
Such type of trend is a major concern for common people and patients.
The data under consideration in this research report justifies the ground situation of medical
malpractices. The analysis may display the numbers of successful malpractice claims that is
recently contributing the high premiums for medical insurance due to malpractice.
1. Descriptive Statistics:
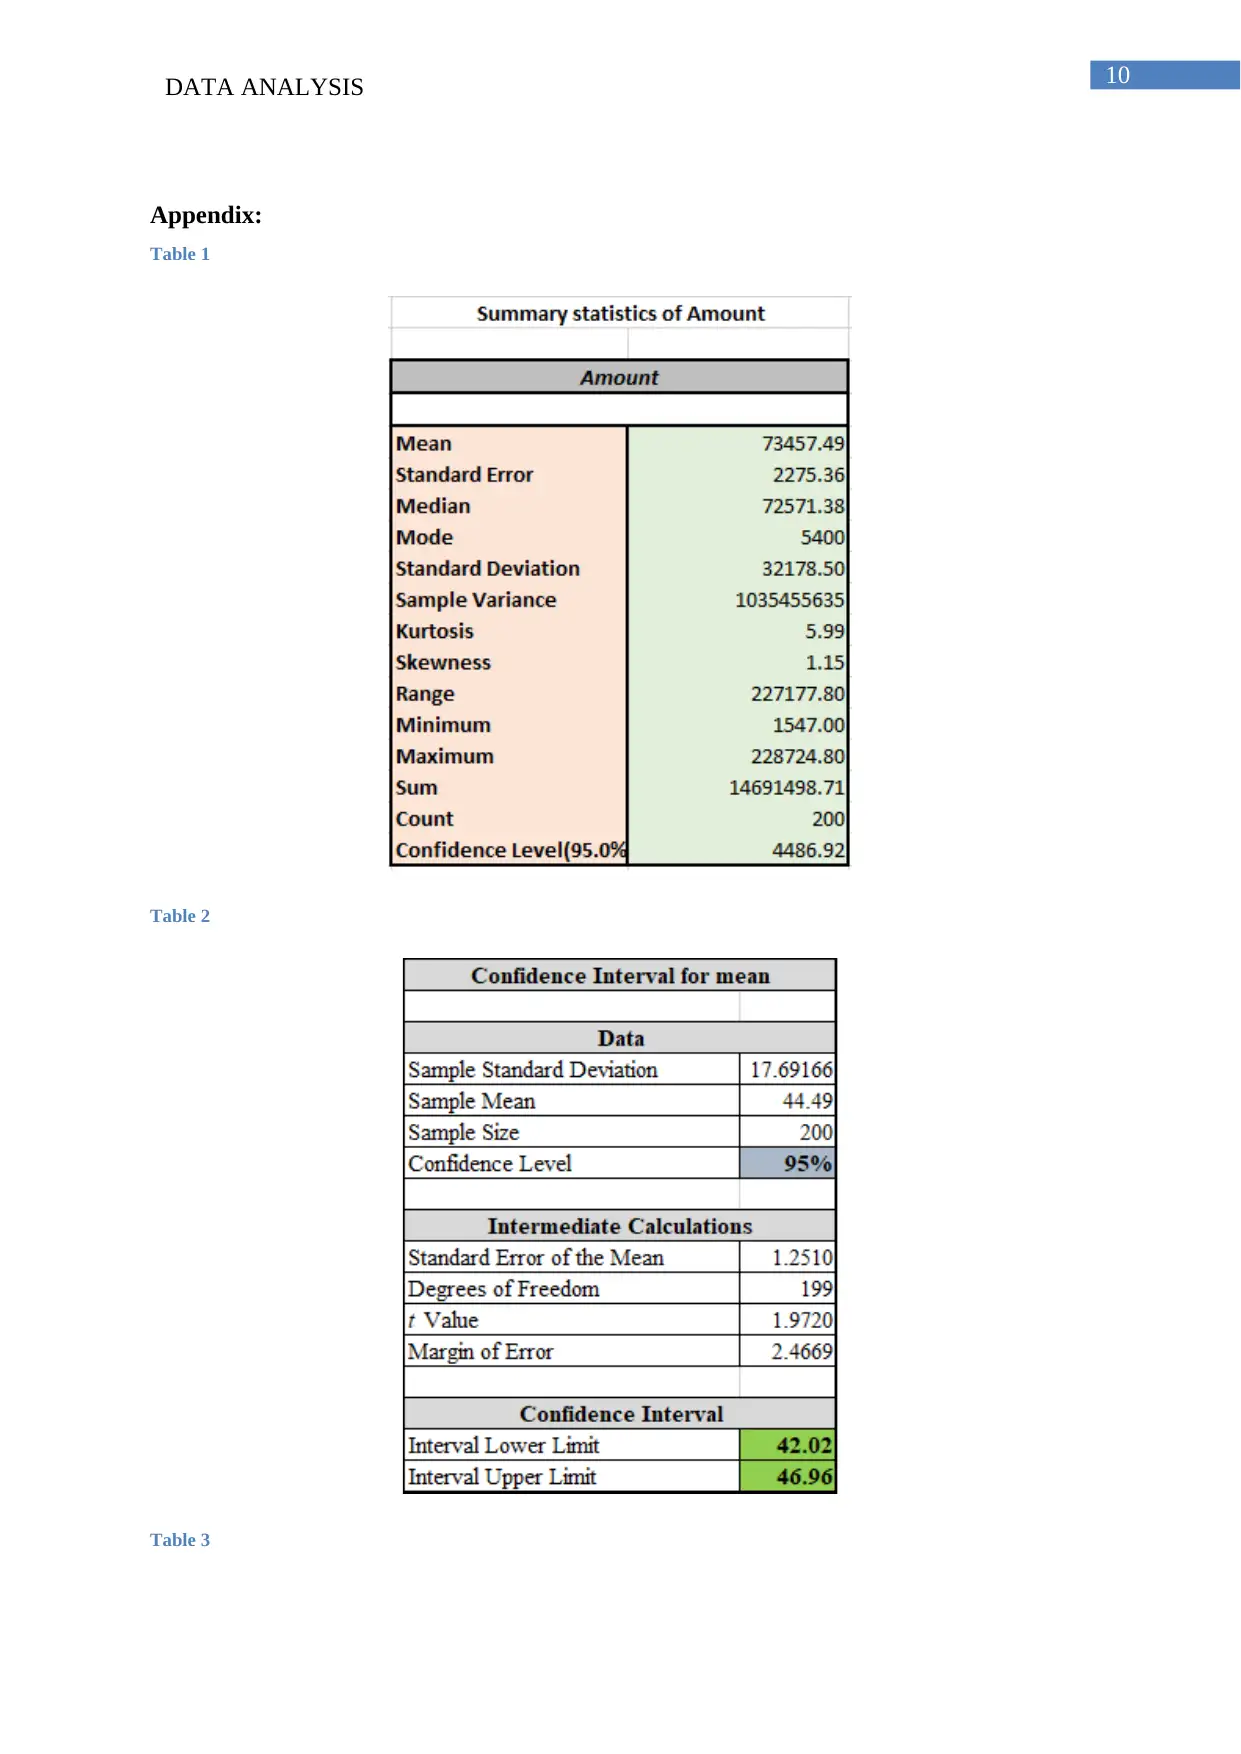
The descriptive or summary statistics of Claim payment amount of 200 samples refers that
the average amount of the claim payment is $73457.49. The lowest amount of claim payment
is $1547and the highest amount of claim payment is $228724.8 with the range of amount of
claim payment $227177.8. There is 95% probability where an observation of claiming
amount lies in the interval of $(73457.49±4486.92) or ($77944.41, $68970.58) (Stone, Sidel
and Bloomquist 2008).
2. Estimation:
2.a)
Firstly, to find the average age of claimants, we observe that-
To: You
From: Edmond Kendrick
Subject: Analysis of Claims
As per earlier discussion, I have cleaned and simplified the undertaken dataset to eight
variables for your convenience. The cleaned dataset contains information about 200 randomly
selected claims promised this year.
Introduction:
The case study of United Health Group that is the America’s most vibrant provider of health
insurance displays that medical malpractice is developing in USA health-centres. The
previous research on a huge amount of data refers that almost 2.4% of annual health-care
spending is being wasted due to medical malpractices. Another study indicated that in the
time span 1991 to 2005, 7.4% of the licensed physicians were claiming malpractice in USA.
Such type of trend is a major concern for common people and patients.
The data under consideration in this research report justifies the ground situation of medical
malpractices. The analysis may display the numbers of successful malpractice claims that is
recently contributing the high premiums for medical insurance due to malpractice.
1. Descriptive Statistics:
The descriptive or summary statistics of Claim payment amount of 200 samples refers that
the average amount of the claim payment is $73457.49. The lowest amount of claim payment
is $1547and the highest amount of claim payment is $228724.8 with the range of amount of
claim payment $227177.8. There is 95% probability where an observation of claiming
amount lies in the interval of $(73457.49±4486.92) or ($77944.41, $68970.58) (Stone, Sidel
and Bloomquist 2008).
2. Estimation:
2.a)
Firstly, to find the average age of claimants, we observe that-
Paraphrase This Document
Need a fresh take? Get an instant paraphrase of this document with our AI Paraphraser
4DATA ANALYSIS
The average age of the insurance claimants is 44.49 years. The interval lower limit of 95%
confidence interval is (44.49-2.4669) years or 42.02 years. The interval upper limit of 95%
confidence interval is (44.49+2.4669) years or 46.96 years. Therefore, it is 95% probable that
the average age of all the claimants lie in the limit of 42.02 years and 46.96 years. That
means 95% of the estimated ages of total claimants lie in the range of 42.02 years and 46.96
years.
2. b)
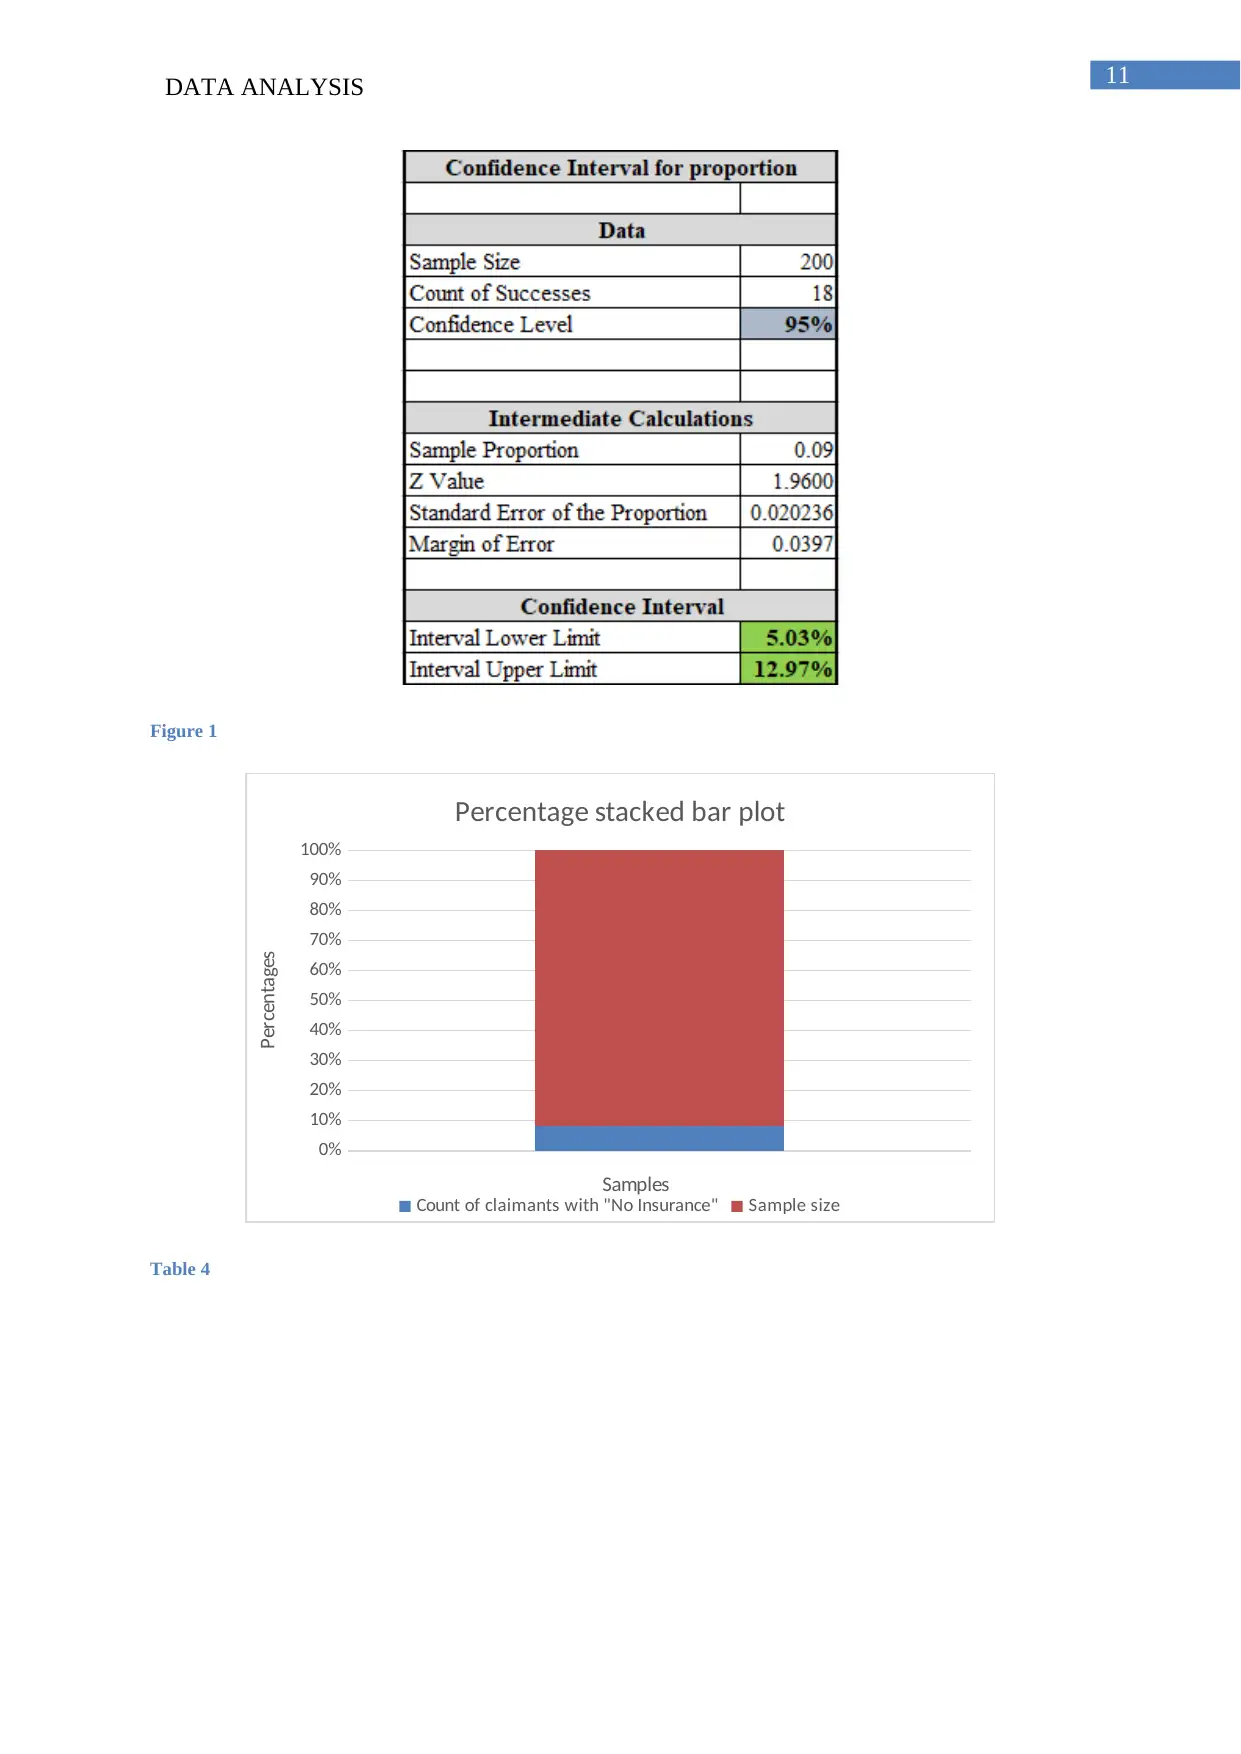
The number of claimants who do not have insurance is 18 among 200 samples. Here number
of samples is 200 and the amount of successes is 18. The proportion of the claimants who do
not have insurance is 0.09.
The upper confidence interval of the proportion of claimants who does not have insurance is
found to be 5.03%. The upper confidence interval of the proportion of claimants who does
not have insurance is found to be 12.97%. Therefore, 95% probability of the estimated
proportion of claimants who do not have insurance lies in the range of 5.03% and 12.97%
(Montgomery, Runger and Hubele 2009).
Answer 3.
3.a)
We construct the basic assertion (H0), where the average paid claim amount is greater than or
equal to $77,500. The alternative assertion (H1), the average of paid claim amount is less than
$77,500.
For the 200 observed claimants, the average of the paid claim amount is $73457.49.
Therefore, with 95% probability, the basic assertion is failed to accept (Lehmann and
Romano 2006). Therefore, it could be interpreted that the mean of paid claiming amount is
below $77,500. At 5% level of significance, there is there is no evidence that the average paid
claim amount is greater than or equal to the proposed amount of industry.
3. b)
A study reported that 3 out of 4 claims (75%) are either “MILD” or “MEDIUM” severity
conditions. Out of 200 people, the number of insurance claimants of “MILD” and
“MEDIUM” severity is 154. The proportion is calculated as 0.77. To find the proportions, the
basic assertion is set that- among every type of severity, the proportion of severity conditions
of “MILD” and “MEDIUM” is less than or equal to 75%. Alternative assertion is assumed as
The average age of the insurance claimants is 44.49 years. The interval lower limit of 95%
confidence interval is (44.49-2.4669) years or 42.02 years. The interval upper limit of 95%
confidence interval is (44.49+2.4669) years or 46.96 years. Therefore, it is 95% probable that
the average age of all the claimants lie in the limit of 42.02 years and 46.96 years. That
means 95% of the estimated ages of total claimants lie in the range of 42.02 years and 46.96
years.
2. b)
The number of claimants who do not have insurance is 18 among 200 samples. Here number
of samples is 200 and the amount of successes is 18. The proportion of the claimants who do
not have insurance is 0.09.
The upper confidence interval of the proportion of claimants who does not have insurance is
found to be 5.03%. The upper confidence interval of the proportion of claimants who does
not have insurance is found to be 12.97%. Therefore, 95% probability of the estimated
proportion of claimants who do not have insurance lies in the range of 5.03% and 12.97%
(Montgomery, Runger and Hubele 2009).
Answer 3.
3.a)
We construct the basic assertion (H0), where the average paid claim amount is greater than or
equal to $77,500. The alternative assertion (H1), the average of paid claim amount is less than
$77,500.
For the 200 observed claimants, the average of the paid claim amount is $73457.49.
Therefore, with 95% probability, the basic assertion is failed to accept (Lehmann and
Romano 2006). Therefore, it could be interpreted that the mean of paid claiming amount is
below $77,500. At 5% level of significance, there is there is no evidence that the average paid
claim amount is greater than or equal to the proposed amount of industry.
3. b)
A study reported that 3 out of 4 claims (75%) are either “MILD” or “MEDIUM” severity
conditions. Out of 200 people, the number of insurance claimants of “MILD” and
“MEDIUM” severity is 154. The proportion is calculated as 0.77. To find the proportions, the
basic assertion is set that- among every type of severity, the proportion of severity conditions
of “MILD” and “MEDIUM” is less than or equal to 75%. Alternative assertion is assumed as
5DATA ANALYSIS
among every type of severity, the proportion of severity conditions of “MILD” and
“MEDIUM” is greater than 75%.
With 95% evidence, the basic assertion is accepted. Therefore, it could be inferred that with
respect to all the severity conditions, the proportion of insurance claimants of “MILD” and
“MEDIUM” severity is at least 75%. The conclusion of such inference has enough evidence
about the fact.
3.c)
Now, our investigation is on the basis of finding the significant difference in the proportion of
“MILD” and “MEDIUM” claims according to the gender of the patients. The difference in
proportion of “MILD” or “MEDIUM” claims by female patients compared to the male
patients is calculated.
It is observed that the count of insurance claimants whose severity conditions are either
“MILD” or “MEDIUM” is 154. Among those people, 60 claimants are males and 94
claimants are females. The proportions of males and females in the total claimants are
38.96% and 61.04% respectively. According to the 95% probability, the equality of
proportions of frequencies of males and females is rejected. Therefore, it could be stated that
the difference of proportions is prominent as per inference (Wolpert 1996). It could be
observed that the proportions of “MILD” and “MEDIUM” severity according to the genders
of the insurance claimant are unequal. Therefore, gender has an effect in it.
3.d)
According to the standard of industry, it is hypothecated that the payment amounts of the
samples are associated to private attorney of the claimants represented the claimants.
Particularly, the average claim amount for the private attorney is greater than the average
claim when no private attorney is involved. The average payment amount of the claimants
who has private attorney is $80501.07. The average payment amount of the claimants who has
non-private attorney is $58140.51.
According to the null assertion the difference of the average payment amount of private
attorney and the average payment amount related to non-private attorney is assumed 0. The
⊘ This is a preview!⊘
Do you want full access?
Subscribe today to unlock all pages.
Trusted by 1+ million students worldwide
6DATA ANALYSIS
alternative assertion about the average payment amount of private attorney is unequal to the
average payment amount related to non-private attorney.
The null hypothesis of equality of payment amounts is rejected with 95% possibility (Abbott 2017).
The proposition of the higher average paid claim amount of private attorney with respect to
absence of private attorney is accepted at 5% level of significance. Therefore, there is
sufficient evidence that average payment amount of the claimants who has private attorney is
greater than the payment amount who has non-private attorney. The data completely supports
the proposition.
3. e)
The industry stakeholders consider that private attorney representation is greater in case of
“SEVERE” claims than for claims in case of “MEDIUM” severity. The validity of the
statement is measured with the help of testing of hypothesis. The basic assertion is assumed
as the proportion of private attorney for “SEVERE” severity is equal to the claims with a
“MEDIUM” severity. The alternative assertion is assumed as the difference between
proportion of private attorney for “SEVERE” claims and claims with “MEDIUM” severity is
unequal to 0.
The total number of private attorney is 129. The number of private attorney representation for
“MEDIUM” severity claims is 93. The number of private attorney representation for
“SEVERE” severity claims is 36. According to the private attorney representation, the
proportions of these two severities are 78.26% and 72.66% respectively.
The basic assertion is accepted at 5% level of significance. It could be concluded that the
proportions of claims in case of private attorney in “SEVERE” condition is equal to the
proportions of claims in case of non-private attorney in “MEDIUM” condition. The
proposition is found to be absolutely valid. Hence, the assertion that the number of private
attorney is higher for “SEVERE” claims than for claims with “MEDIUM” severity is invalid.
Answer 4.
Paraphrase This Document
Need a fresh take? Get an instant paraphrase of this document with our AI Paraphraser
7DATA ANALYSIS
4. a)
You were also interested to find the relationship between the speciality of physician involved,
severity of the claim and the average amount of insurance claim. You regard that the
percentage of claims in “SEVERE” severity is greater for Orthopaedic surgeon and lesser
than other specialists.
The basic assertion assumed that the difference between the percentage of Orthopaedic
surgeon and the other specialists in the “SEVERE” severity is 0. The alternative assertion
assumed that the percentage of Orthopaedic surgeon is lower than other specialists in the
“SEVERE” severity.
It is observed that the 46 patients claim “SEVERE” severity. Among them, 8 patients get
treatment from Orthopaedic surgeons and 38 patients get treatment from other types of
specialists. The proportions are calculated as 17.39% and 82.61% respectively.
Here the basic assertion is rejected at 5% level of significance. Therefore, the assertion of the equal
percentages of “SEVERE” severity that claims insurance under treatment of an Orthopaedic
surgeon and other specialists is accepted. The alternative hypothesis of claims of insurance
from the claimants under Orthopaedic surgeon is lower than the claims about other types of
specialists is accepted.
4.b)
You also consider that the average claim amount for “SEVERE” severity is higher when an
Orthopaedic surgeon is taken under consideration rather than other specialists.
The basic assertion is that the differences of average claim amount for “SEVERE” condition
for Orthopaedic surgeon and the average claim amount for “SEVERE” condition for the other
specialists is 0. The alternative assertion is that the difference of average claim amount for
“SEVERE” condition for Orthopaedic surgeon and the average claim amount for “SEVERE”
condition for the other specialists is unequal to 0.
The number of claimants in “SEVERE” severity is 46. Out of them, 8 claimants were under
supervision of Orthopaedic surgeon and 38 patients were under supervision of other types of
specialists. The average claiming amount of 8 patients is $118944.27. The average claiming
amount of 38 patients is $108466.41.
8DATA ANALYSIS
The basic assertion is accepted here. Hence, the hypothesis of the average claim amount for
“SEVERE” claims is equal for the speciality criterion of both Orthopaedic surgeon and other
specialisations with 95% possibility. Hence, the average claim amount for “SEVERE” severity
is not higher for the involvement of Orthopaedic surgeon than other specialisations.
I look forward to your response.
Sincerely,
Edmond Kendrick
Chief Data Scientist – United Health Group.
⊘ This is a preview!⊘
Do you want full access?
Subscribe today to unlock all pages.
Trusted by 1+ million students worldwide
9DATA ANALYSIS
References:
Abbott, M. L. (2017). Independent Sample T Test.
Chan, I.S. and Zhang, Z., 1999. Test‐based exact confidence intervals for the difference of
two binomial proportions. Biometrics, 55(4), pp.1202-1209.
Gilbert, R., Widom, C.S., Browne, K., Fergusson, D., Webb, E. and Janson, S., 2009. Burden
and consequences of child maltreatment in high-income countries. The lancet, 373(9657),
pp.68-81.
Lehmann, E.L. and Romano, J.P., 2006. Testing statistical hypotheses. Springer Science &
Business Media.
Lowry, R., 2014. Concepts and applications of inferential statistics.
Montgomery, D.C., Runger, G.C. and Hubele, N.F., 2009. Engineering statistics. John Wiley
& Sons.
Stone, H., Sidel, J.L. and Bloomquist, J., 2008. Quantitative descriptive analysis. Descriptive
Sensory Analysis in Practice, pp.53-69.
Wolpert, R.L., 1996. Testing simple hypotheses. In Data Analysis and Information Systems
(pp. 289-297). Springer, Berlin, Heidelberg.
Paraphrase This Document
Need a fresh take? Get an instant paraphrase of this document with our AI Paraphraser
10DATA ANALYSIS
Appendix:
Table 1
Table 2
Table 3
Appendix:
Table 1
Table 2
Table 3
11DATA ANALYSIS
Figure 1
0%
10%
20%
30%
40%
50%
60%
70%
80%
90%
100%
Percentage stacked bar plot
Count of claimants with "No Insurance" Sample size
Samples
Percentages
Table 4
Figure 1
0%
10%
20%
30%
40%
50%
60%
70%
80%
90%
100%
Percentage stacked bar plot
Count of claimants with "No Insurance" Sample size
Samples
Percentages
Table 4
⊘ This is a preview!⊘
Do you want full access?
Subscribe today to unlock all pages.
Trusted by 1+ million students worldwide
1 out of 26
Related Documents


Your All-in-One AI-Powered Toolkit for Academic Success.
+13062052269
info@desklib.com
Available 24*7 on WhatsApp / Email
![[object Object]](/_next/static/media/star-bottom.7253800d.svg)
Unlock your academic potential
Copyright © 2020–2026 A2Z Services. All Rights Reserved. Developed and managed by ZUCOL.