Statistics Assignment: Analysis of Pulse Rate Descriptive Statistics

Verified

Added on  2022/11/16

|5
|486
|44
Homework Assignment
AI Summary
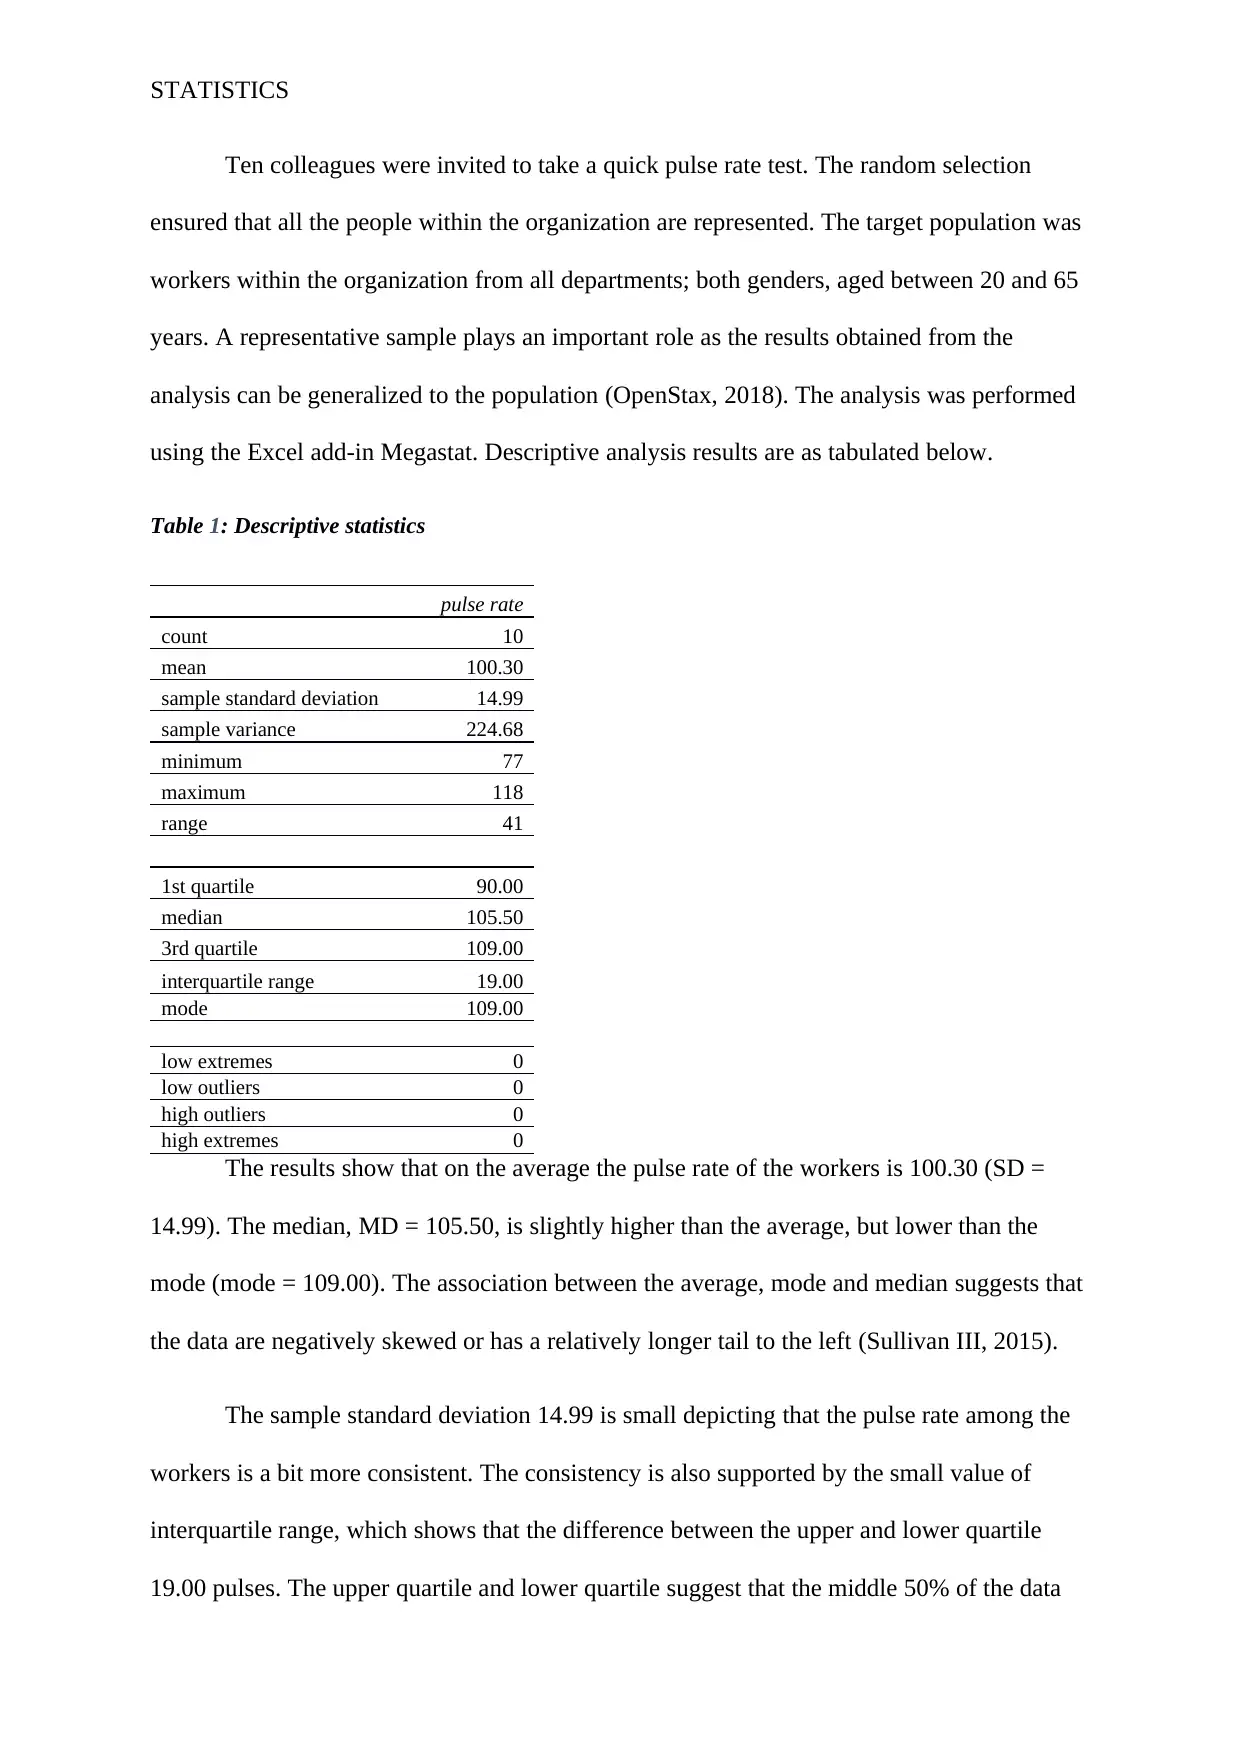
This assignment analyzes pulse rate data collected from ten colleagues. It presents descriptive statistics including mean, median, mode, standard deviation, range, and quartiles. The analysis reveals a mean pulse rate of 100.30 with a standard deviation of 14.99. The median is slightly higher than the mean, and the mode is the highest, suggesting a negative skew. The assignment discusses the consistency of the data, lack of outliers, and potential variables influencing the measures. References to statistical concepts and resources are included, demonstrating a comprehensive understanding of the data and its interpretation. The analysis was performed using Excel add-in Megastat.
Document Page
Running head: STATISTICS
Statistics
Name:
Institution:
tabler-icon-diamond-filled.svg

Secure Best Marks with AI Grader

Need help grading? Try our AI Grader for instant feedback on your assignments.
Document Page
STATISTICS
Ten colleagues were invited to take a quick pulse rate test. The random selection
ensured that all the people within the organization are represented. The target population was
workers within the organization from all departments; both genders, aged between 20 and 65
years. A representative sample plays an important role as the results obtained from the
analysis can be generalized to the population (OpenStax, 2018). The analysis was performed
using the Excel add-in Megastat. Descriptive analysis results are as tabulated below.
Table 1: Descriptive statistics
pulse rate
count 10
mean 100.30
sample standard deviation 14.99
sample variance 224.68
minimum 77
maximum 118
range 41
1st quartile 90.00
median 105.50
3rd quartile 109.00
interquartile range 19.00
mode 109.00
low extremes 0
low outliers 0
high outliers 0
high extremes 0
The results show that on the average the pulse rate of the workers is 100.30 (SD =
14.99). The median, MD = 105.50, is slightly higher than the average, but lower than the
mode (mode = 109.00). The association between the average, mode and median suggests that
the data are negatively skewed or has a relatively longer tail to the left (Sullivan III, 2015).
The sample standard deviation 14.99 is small depicting that the pulse rate among the
workers is a bit more consistent. The consistency is also supported by the small value of
interquartile range, which shows that the difference between the upper and lower quartile
19.00 pulses. The upper quartile and lower quartile suggest that the middle 50% of the data
Document Page
STATISTICS
has a pulse rate between 90 pulses and 109 pulses. Last but not least, the minimum pulse rate
is 77 and maximum of 118 pulses, meaning that the range of the pulse rate is 41 pulses.
Using the rule of thumb (Q1 – 1.5*IQR and Q3 + 1.5*IQR) all the data points are
within the acceptable range (Keller, 2015). Thus, there are no outliers in the data. The data
show that on average people have a pulse rate of 100.30 pulses (SD = 14.99 pulses). The
mean and standard deviation are two sample statistics that are commonly used to describe the
sample data.
Document Page
STATISTICS
References
Keller, G. (2015). Statistics for Management and Economics, Abbreviated. Cengage
Learning.
OpenStax. (2018). Introductory Business Statistics. OpenStax Business Statistics. Retrieved
from https://legacy.cnx.org/content/col11776/1.35
Sullivan III, M. (2015). Fundamentals of statistics. Pearson.
tabler-icon-diamond-filled.svg

Secure Best Marks with AI Grader

Need help grading? Try our AI Grader for instant feedback on your assignments.
Document Page
STATISTICS
Appendix 1: Data sample
pulse
rate
108
109
103
118
109
79
93
89
118
77
chevron_up_icon
1 out of 5
circle_padding
hide_on_mobile
zoom_out_icon
[object Object]