BUGEN1502 Semester 2 Assignment 1: Descriptive Statistics and Analysis

Verified

Added on  2022/09/15

|6
|564
|15
Homework Assignment
AI Summary
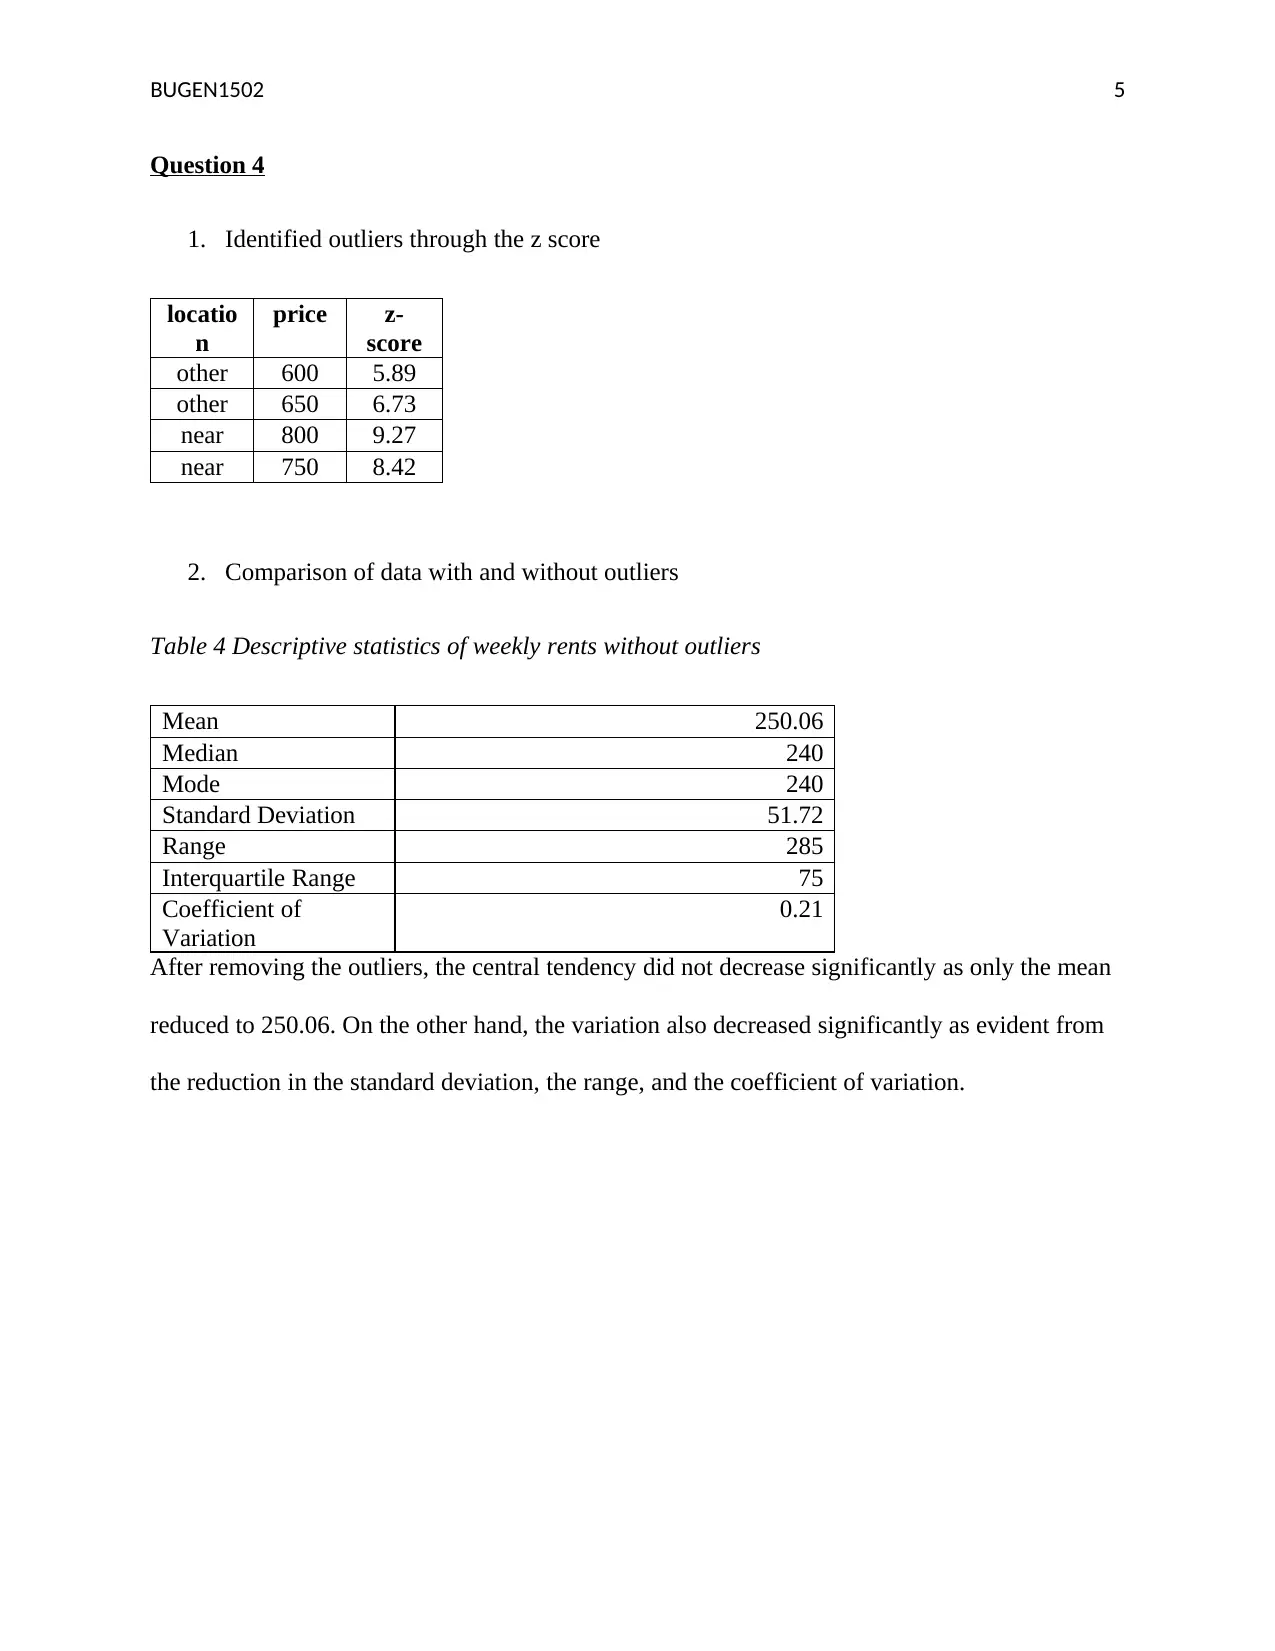
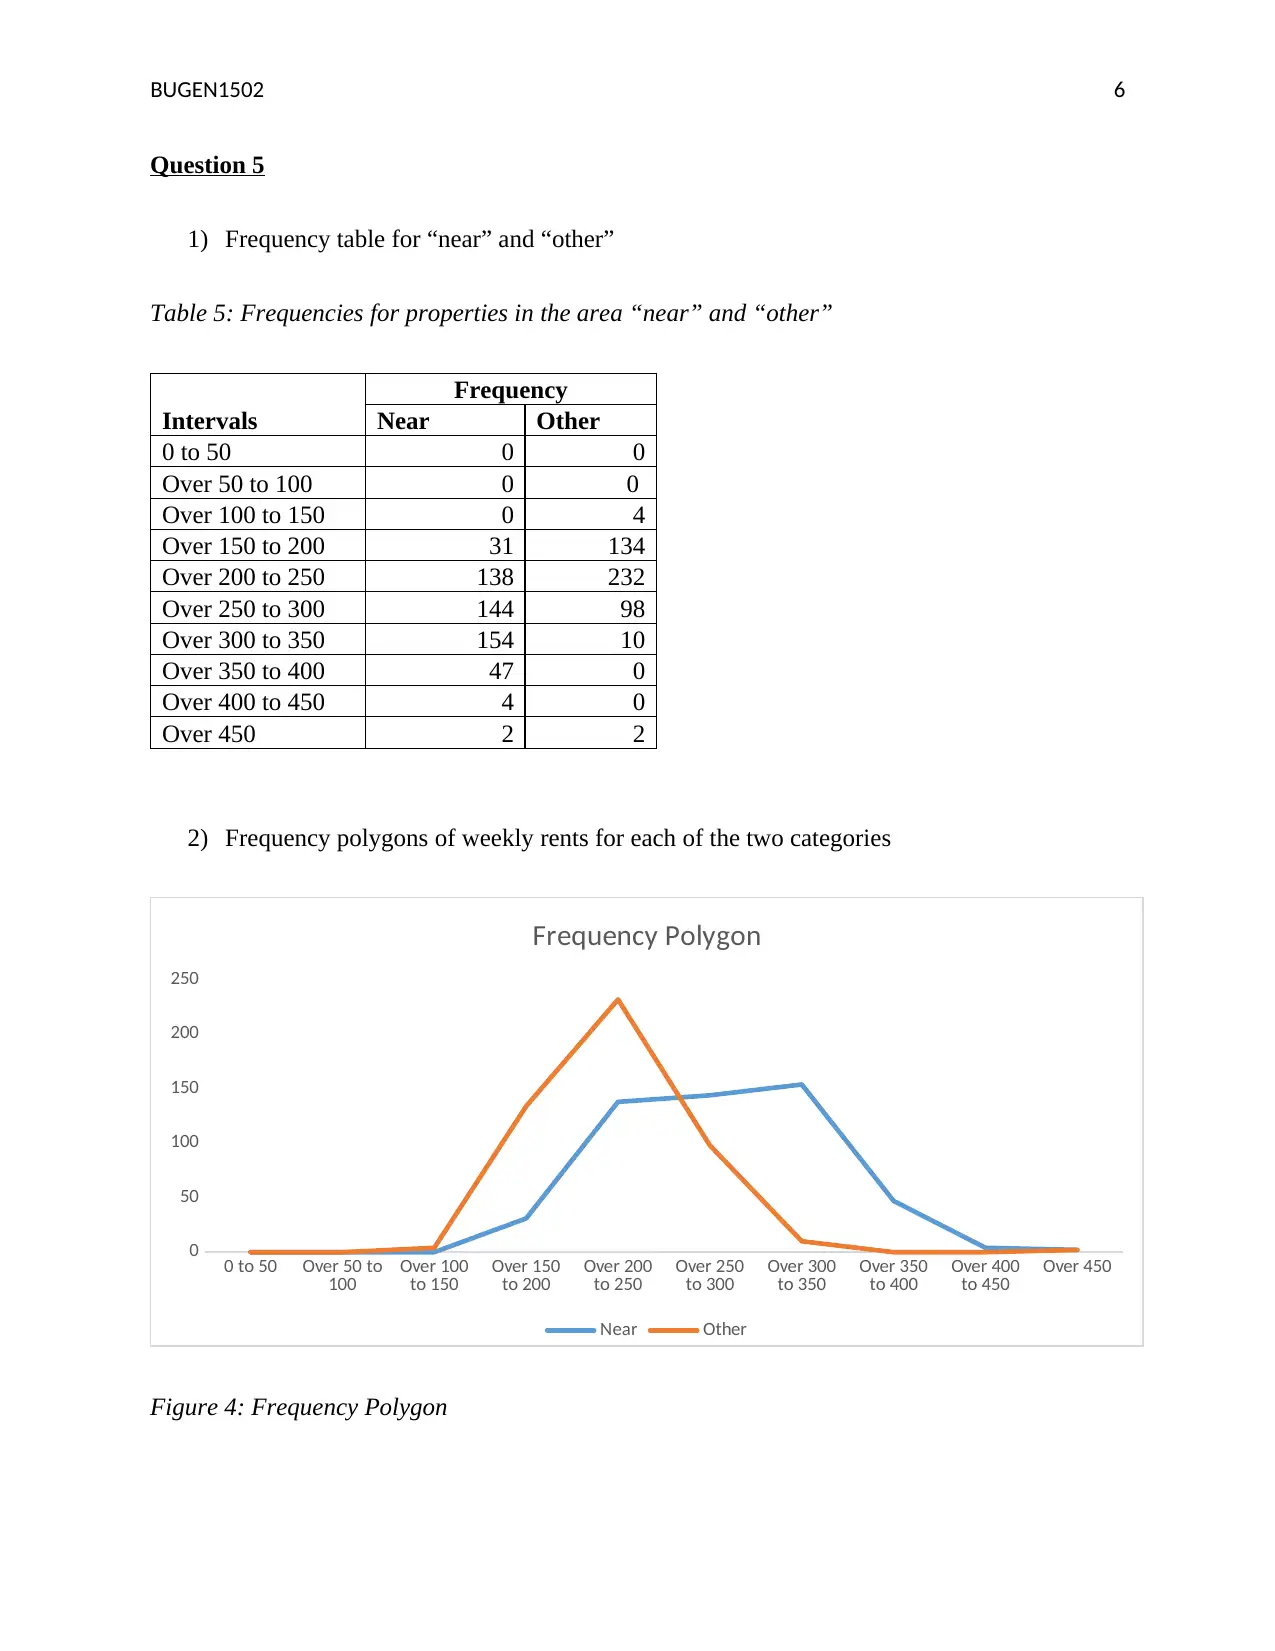
This document presents a solution to BUGEN1502 Assignment 1, focusing on descriptive statistics related to weekly rental costs and property locations. The assignment involves calculating frequencies and percentages for different rental cost intervals, creating bar and pie charts to visualize the data. Further analysis includes generating histograms and descriptive statistics like mean, median, mode, standard deviation, and identifying outliers using z-scores. The solution compares data with and without outliers and analyzes the frequency distributions for properties near the university versus other locations, using frequency polygons to illustrate the distributions. The analysis provides insights into the central tendencies, variations, and distributions of the data, supporting a comprehensive understanding of the rental market data.
Document Page
RUNNING HEADER: BUGEN1502 1
BUGEN1502
Students Name:
Subject:
Date:
1
tabler-icon-diamond-filled.svg

Secure Best Marks with AI Grader

Need help grading? Try our AI Grader for instant feedback on your assignments.
Document Page
BUGEN1502 2
Question 1
1) Frequency and percentages associated with the 5 categories
Table 1: Frequencies for all the properties
Intervals (dollars) Frequency Percentage
0 to 200 169 17%
Over 200 to 250 370 37%
Over 250 to 300 306 31%
Over 300 to 30 100 10%
Over 350 55 6%
2) Bar chart of the frequencies associated with the categories
0 to 200 Over 200 to
250 Over 250 to
300 Over 300 to
350 Over 350
0
50
100
150
200
250
300
350
400
Frequency
Figure 1: Bar chart of the frequencies
3) Pie chart of the percentages associated with the categories
Document Page
BUGEN1502 3
169
370
306
100
55
Frequency
0 to 200 Over 200 to 250 Over 250 to 300
Over 300 to 350 Over 350
Figure 2: Pie chart of the frequencies
4) Discussion of table and chart
From the bar chart and the pie chart in question 2 & 3, it is evident that majority of the weekly
rental cost fell between 200 and 250 dollars with a frequency of 370. This was closely followed
by the range 250 to 300 dollars with a frequency of 306. The least weekly rental cost frequency
was over 350 with a frequency of 55.
Question 2
1) Frequencies associated with each interval
Table 2: Frequencies for all the properties
Intervals
Freque
ncy
0 to 50 0
Over 50 to 100 0
Over 100 to 150 24
Over 150 to 200 145
Over 200 to 250 370
Over 250 to 300 306
Over 300 to 350 100
Over 350 to 400 47
Document Page
BUGEN1502 4
Over 400 to 450 4
Over 450 4
2) Histogram of weekly rents with frequencies of each interval
0 to 50 Over 50 to
100 Over 100
to 150 Over 150
to 200 Over 200
to 250 Over 250
to 300 Over 300
to 350 Over 350
to 400 Over 400
to 450 Over 450
Frequency
Figure 3: Histogram on weekly rents with frequencies
From the histogram above, it is evident that the distribution is normally distributed since the
histogram is bell shaped. Consequently, it can also be seen that the distribution is positively
skewed.
Question 3
Table 3: Descriptive statistics of weekly rents
Mean 251.86
Median 240
Mode 240
Standard Deviation 59.13
Range 665
Interquartile Range 75
Coefficient of Variation 0.23
tabler-icon-diamond-filled.svg

Secure Best Marks with AI Grader

Need help grading? Try our AI Grader for instant feedback on your assignments.
Document Page
BUGEN1502 5
Question 4
1. Identified outliers through the z score
locatio
n
price z-
score
other 600 5.89
other 650 6.73
near 800 9.27
near 750 8.42
2. Comparison of data with and without outliers
Table 4 Descriptive statistics of weekly rents without outliers
Mean 250.06
Median 240
Mode 240
Standard Deviation 51.72
Range 285
Interquartile Range 75
Coefficient of
Variation
0.21
After removing the outliers, the central tendency did not decrease significantly as only the mean
reduced to 250.06. On the other hand, the variation also decreased significantly as evident from
the reduction in the standard deviation, the range, and the coefficient of variation.
Document Page
BUGEN1502 6
Question 5
1) Frequency table for “near” and “other”
Table 5: Frequencies for properties in the area “near” and “other”
Intervals
Frequency
Near Other
0 to 50 0 0
Over 50 to 100 0 0
Over 100 to 150 0 4
Over 150 to 200 31 134
Over 200 to 250 138 232
Over 250 to 300 144 98
Over 300 to 350 154 10
Over 350 to 400 47 0
Over 400 to 450 4 0
Over 450 2 2
2) Frequency polygons of weekly rents for each of the two categories
0 to 50 Over 50 to
100 Over 100
to 150 Over 150
to 200 Over 200
to 250 Over 250
to 300 Over 300
to 350 Over 350
to 400 Over 400
to 450 Over 450
0
50
100
150
200
250
Frequency Polygon
Near Other
Figure 4: Frequency Polygon
chevron_up_icon
1 out of 6
circle_padding
hide_on_mobile
zoom_out_icon
[object Object]