Descriptive Statistics in Healthcare: Measures, Uses and Examples

Verified

Added on  2022/11/29

|13
|1557
|300
Report
AI Summary
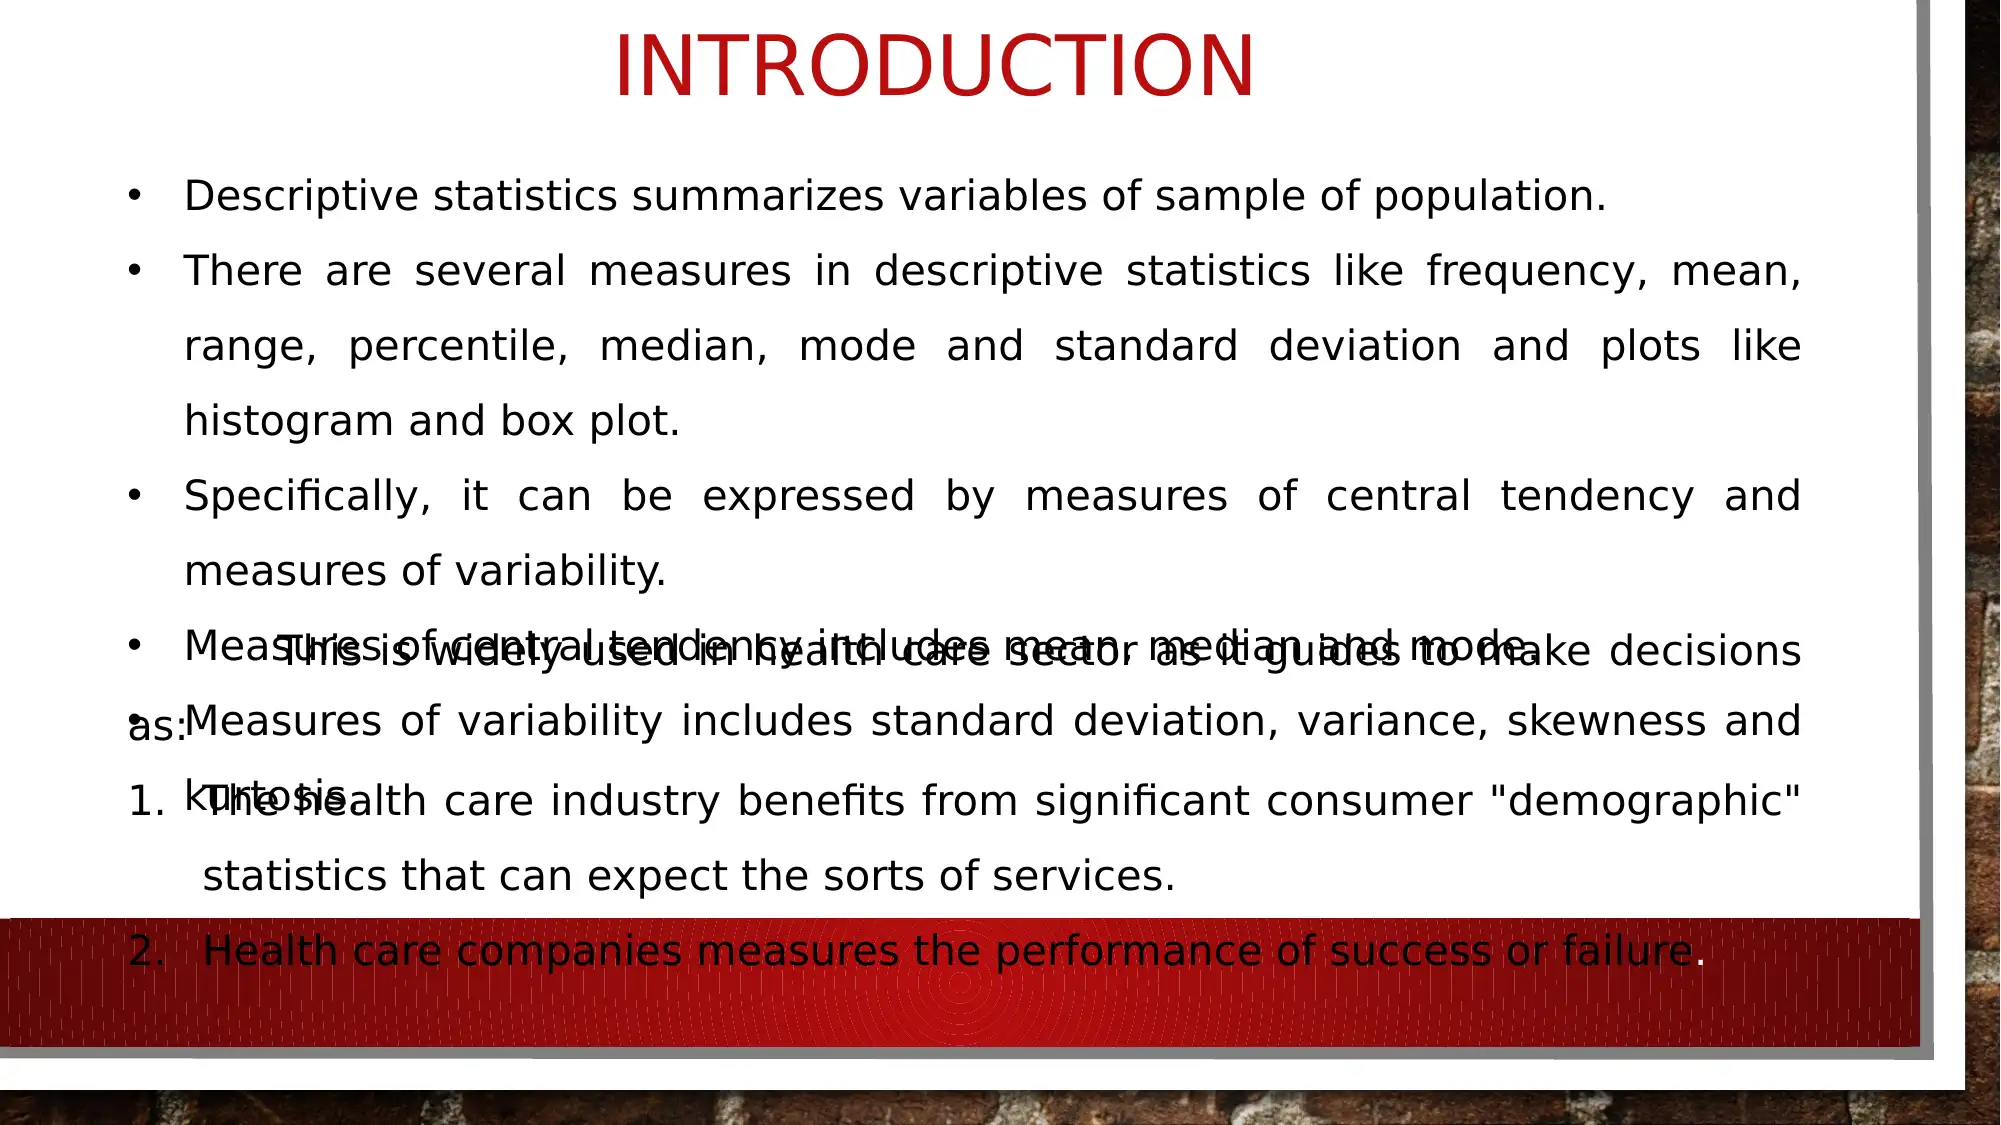
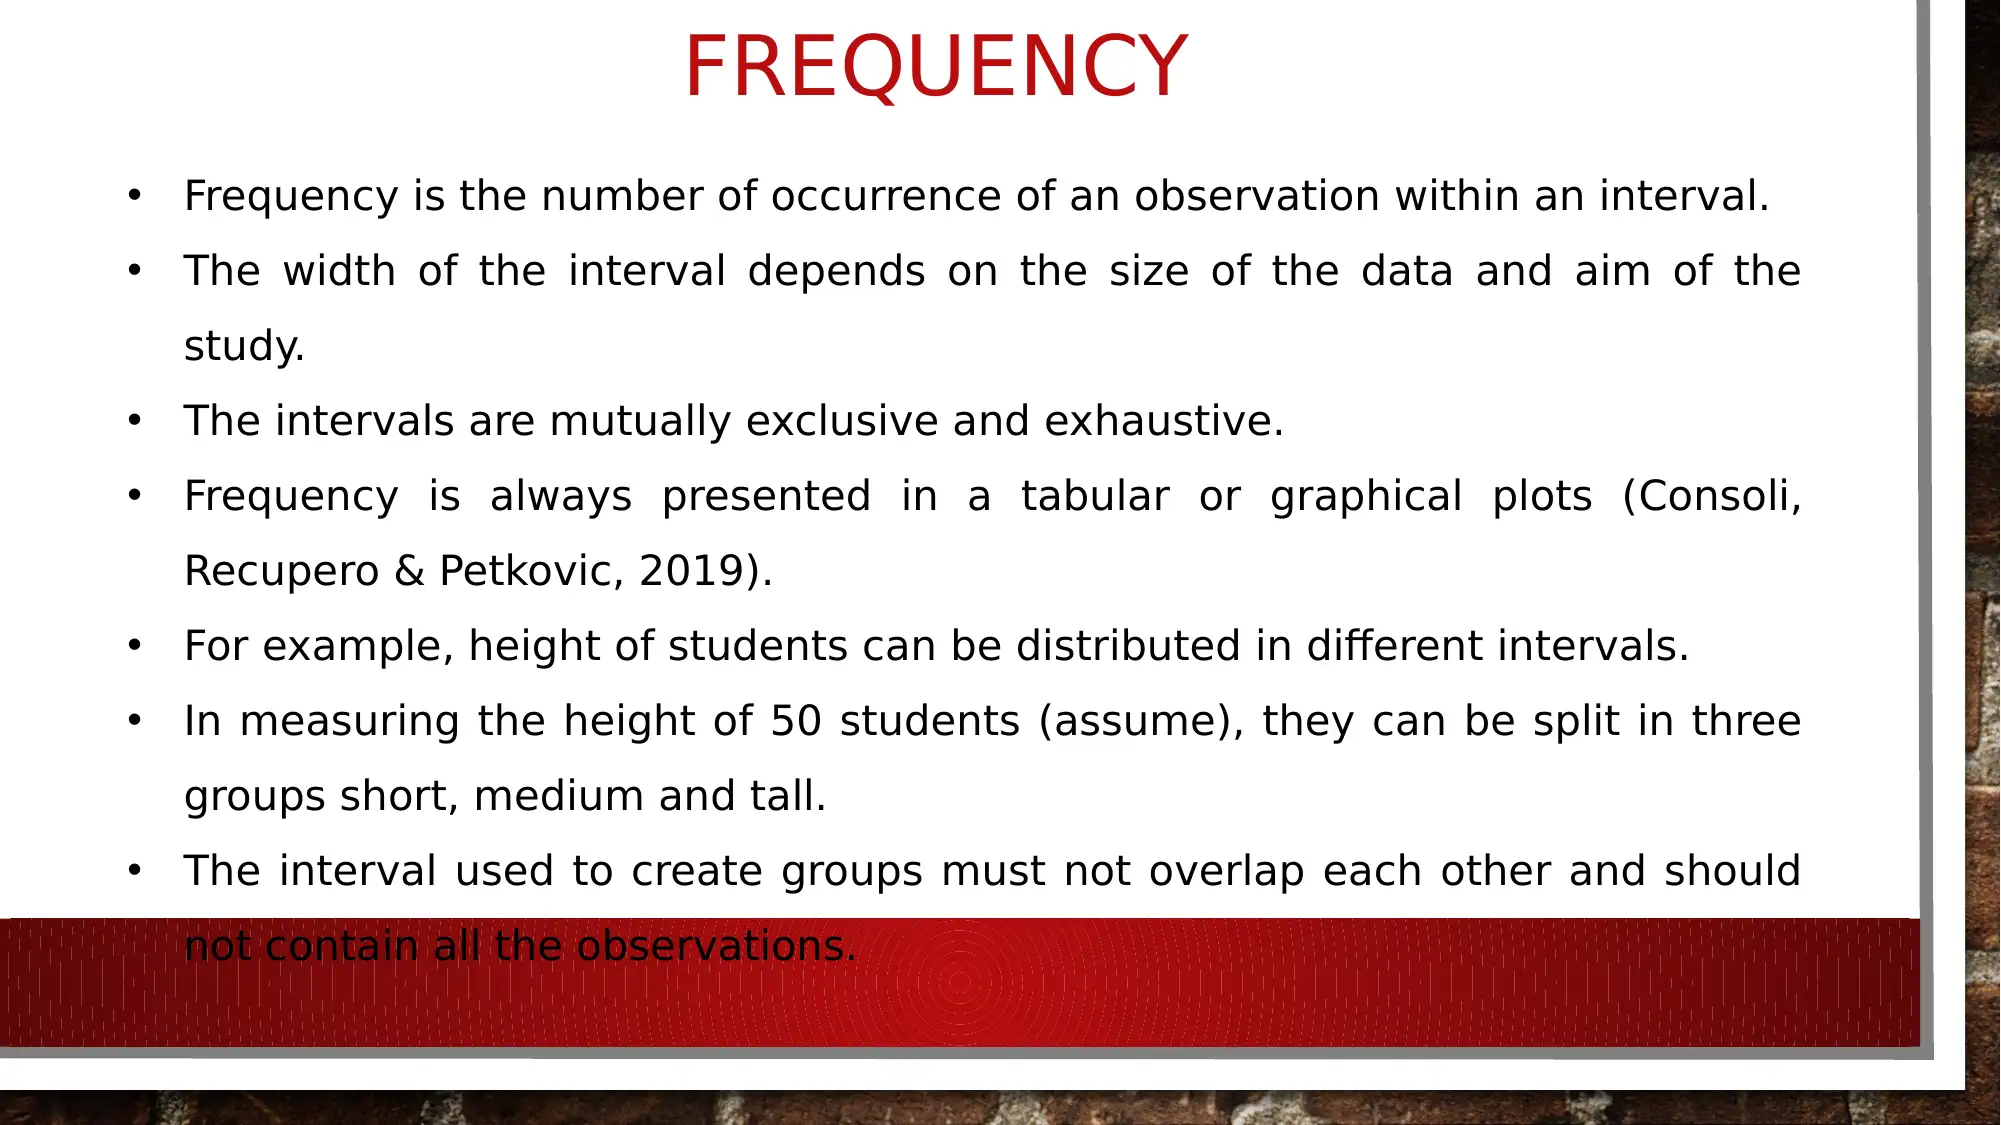
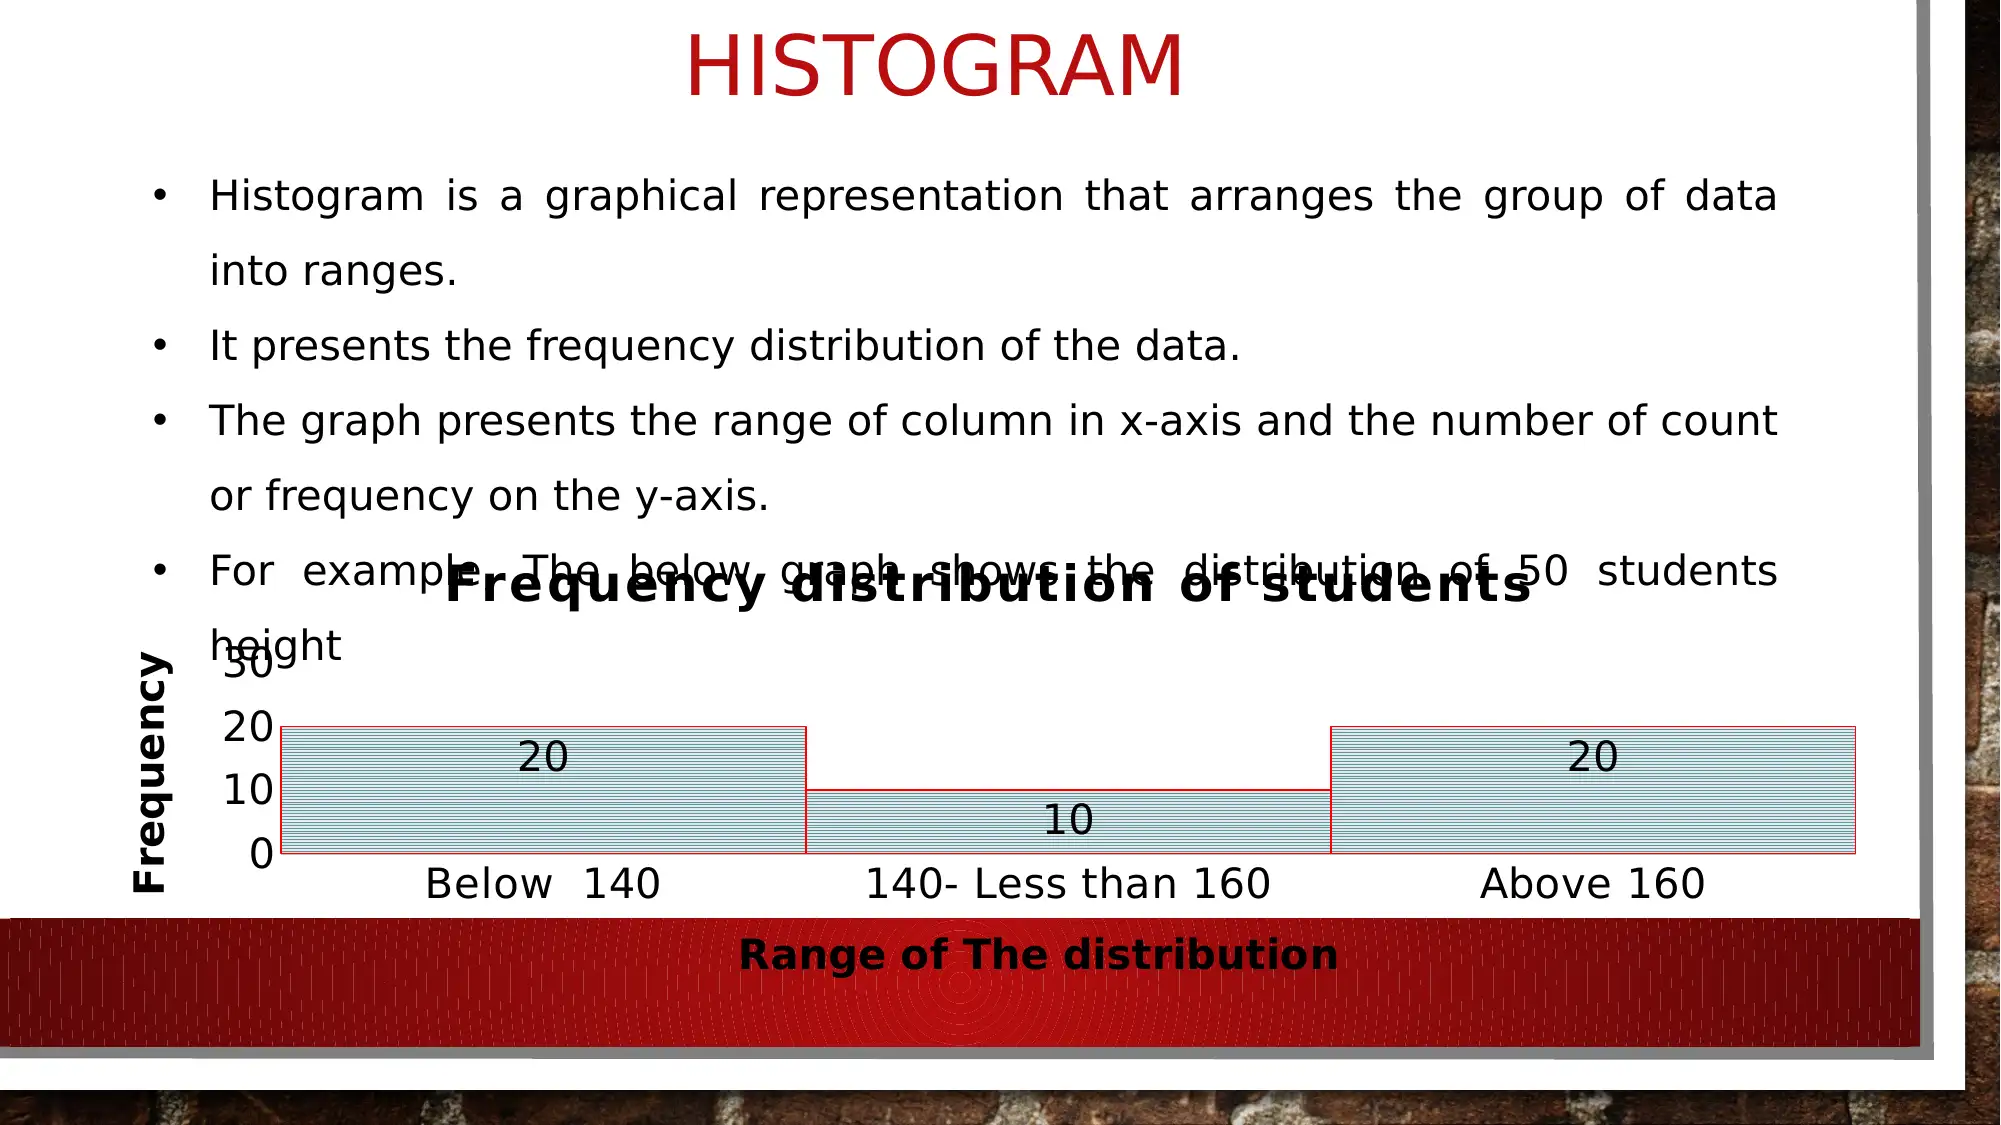
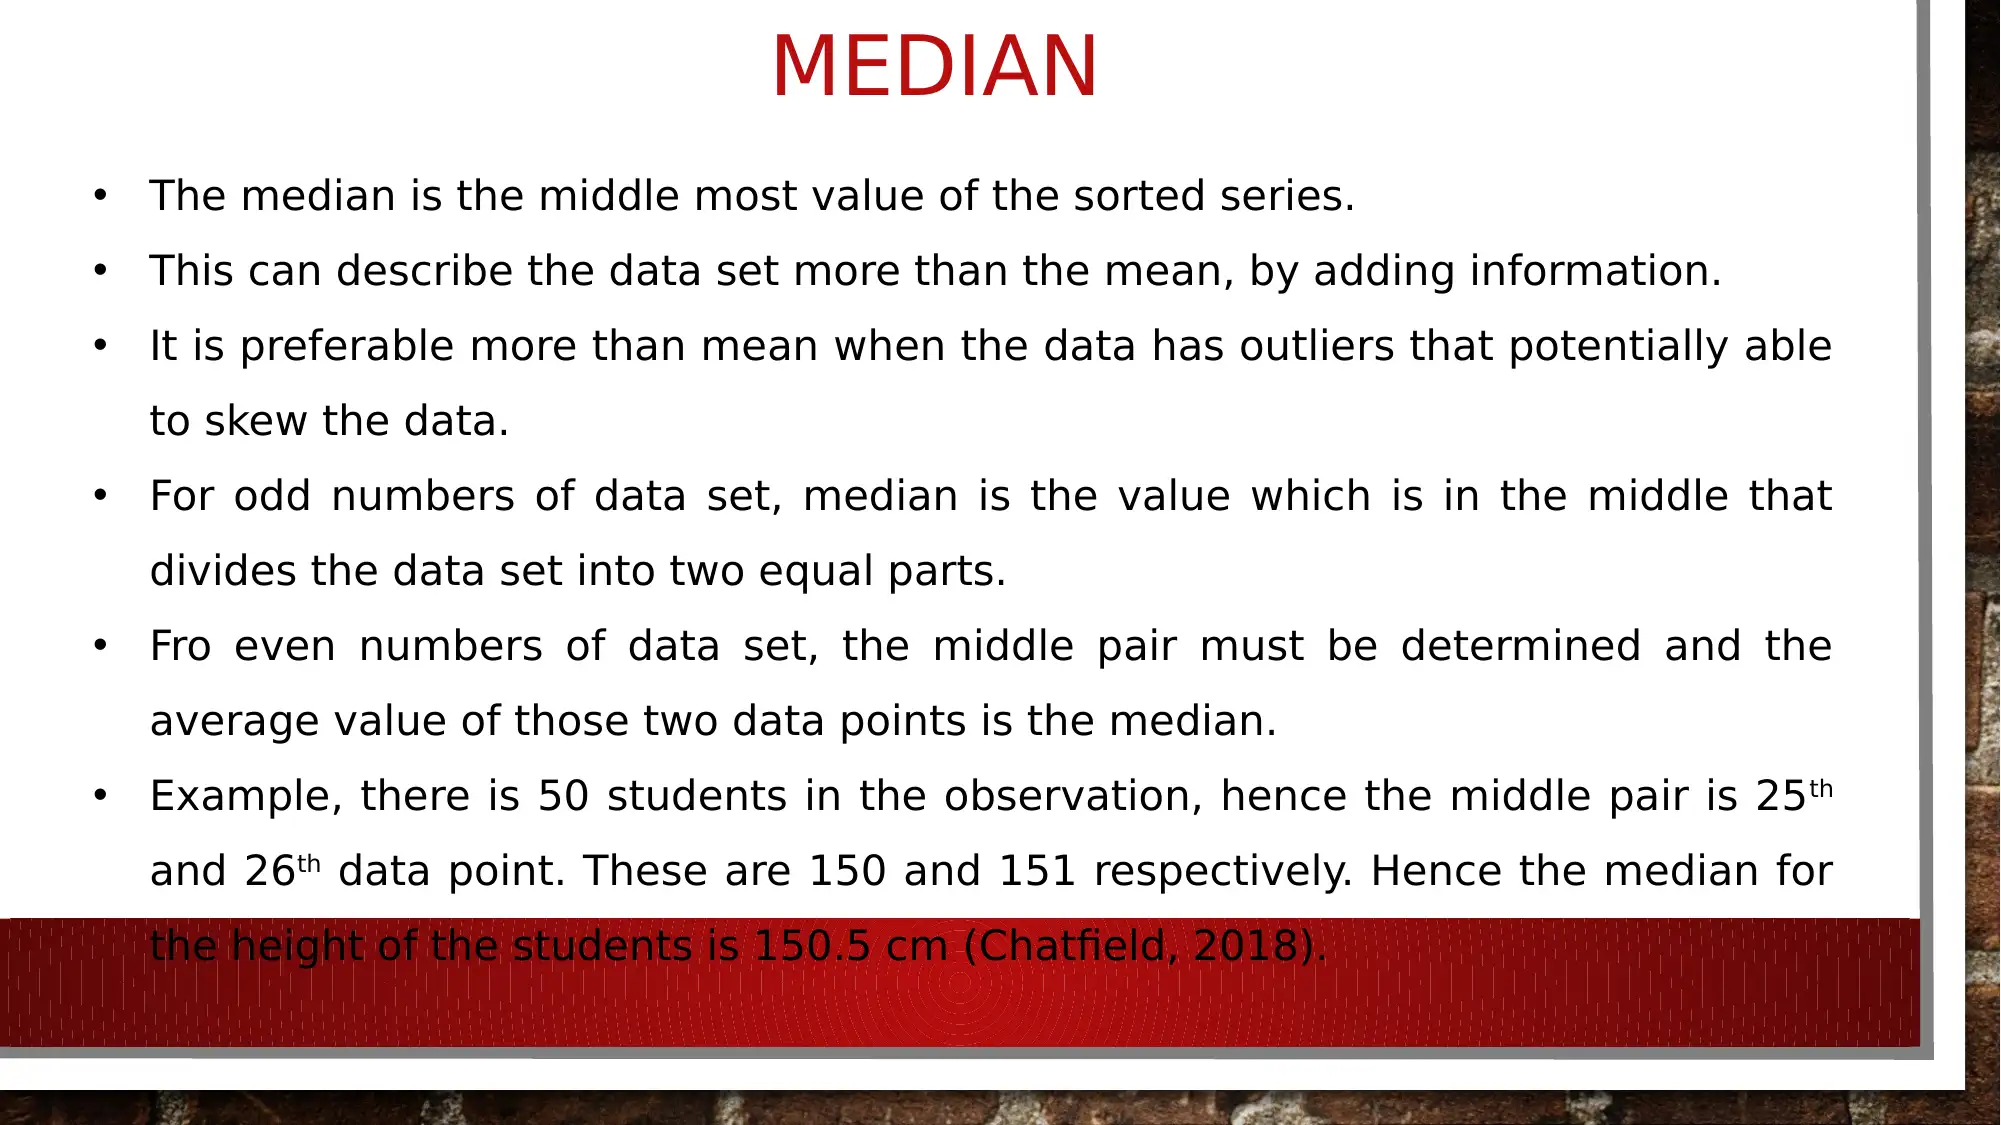
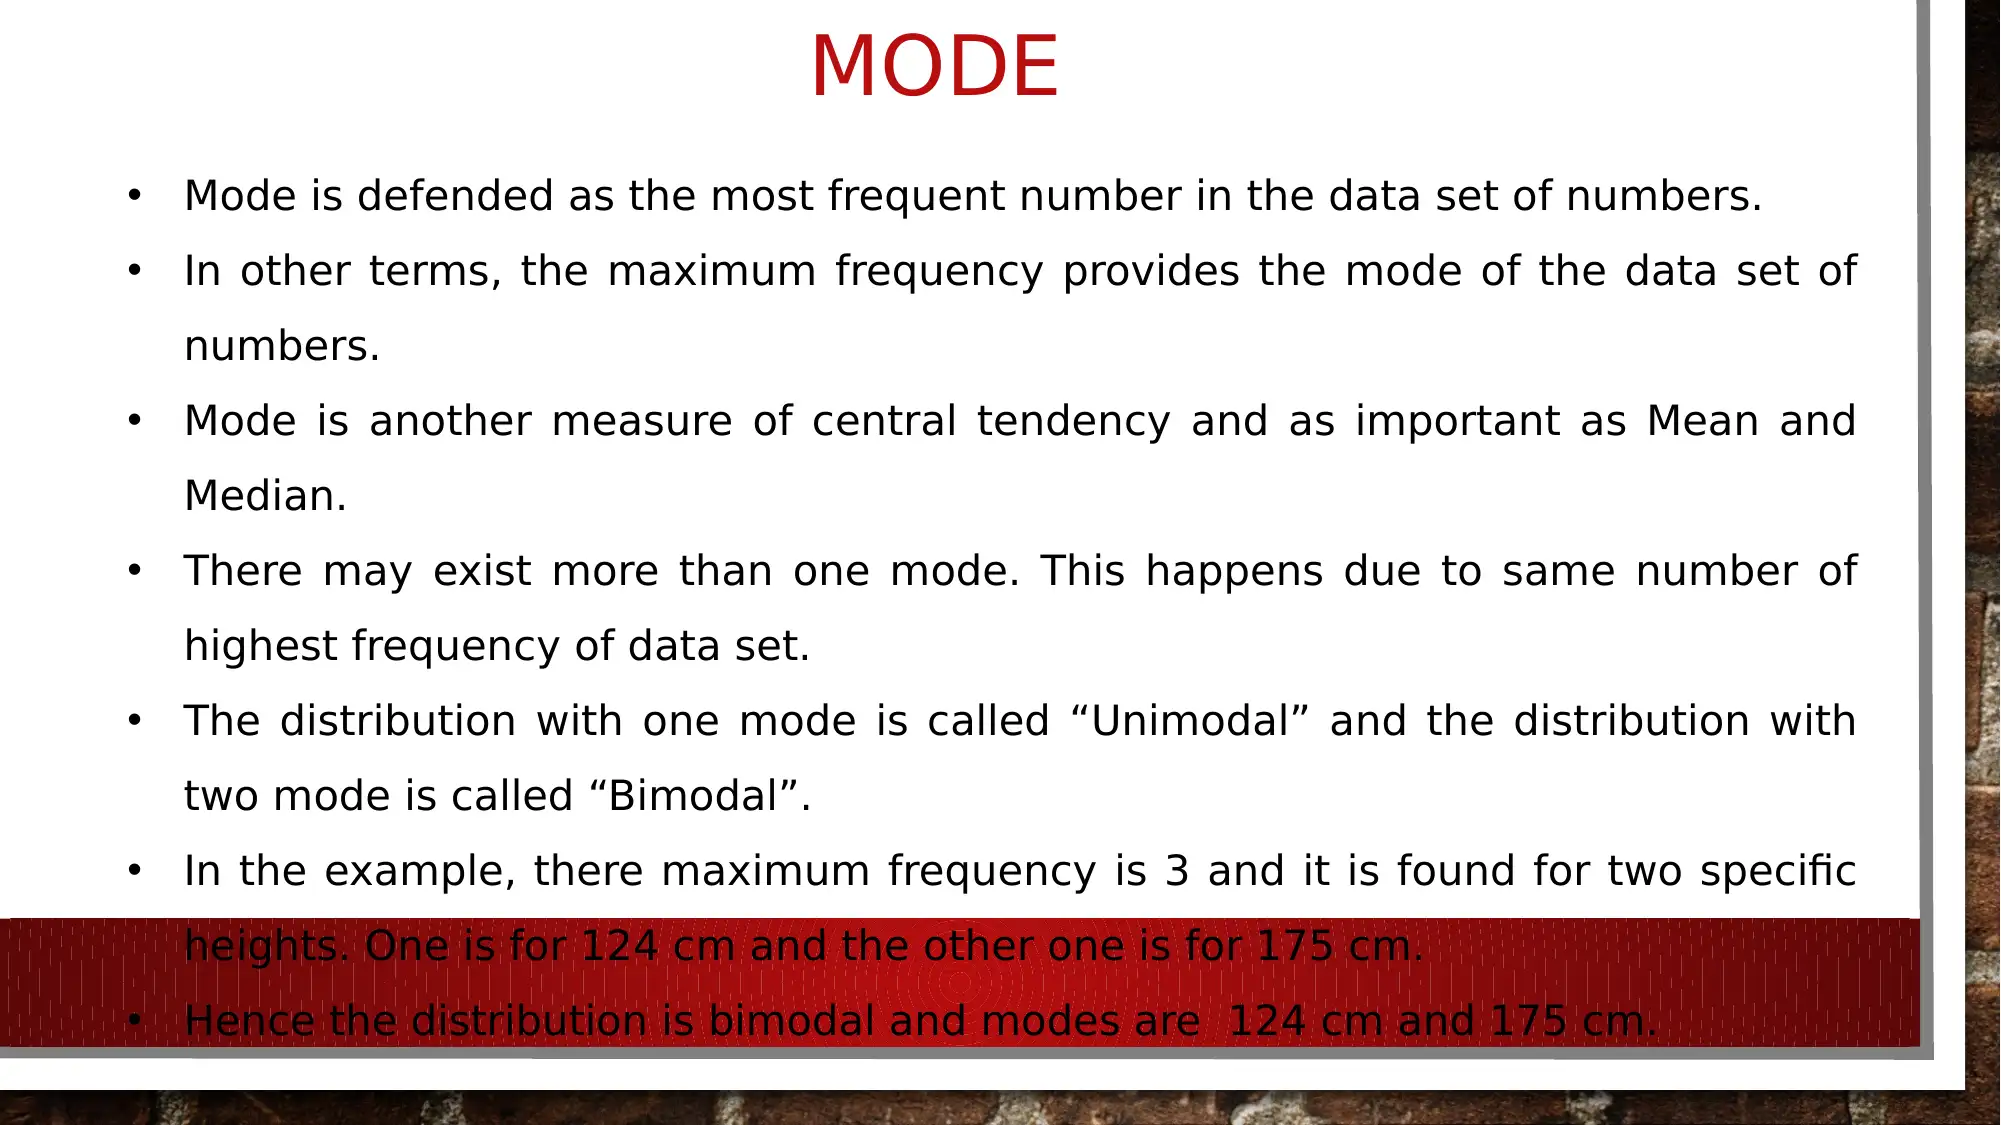
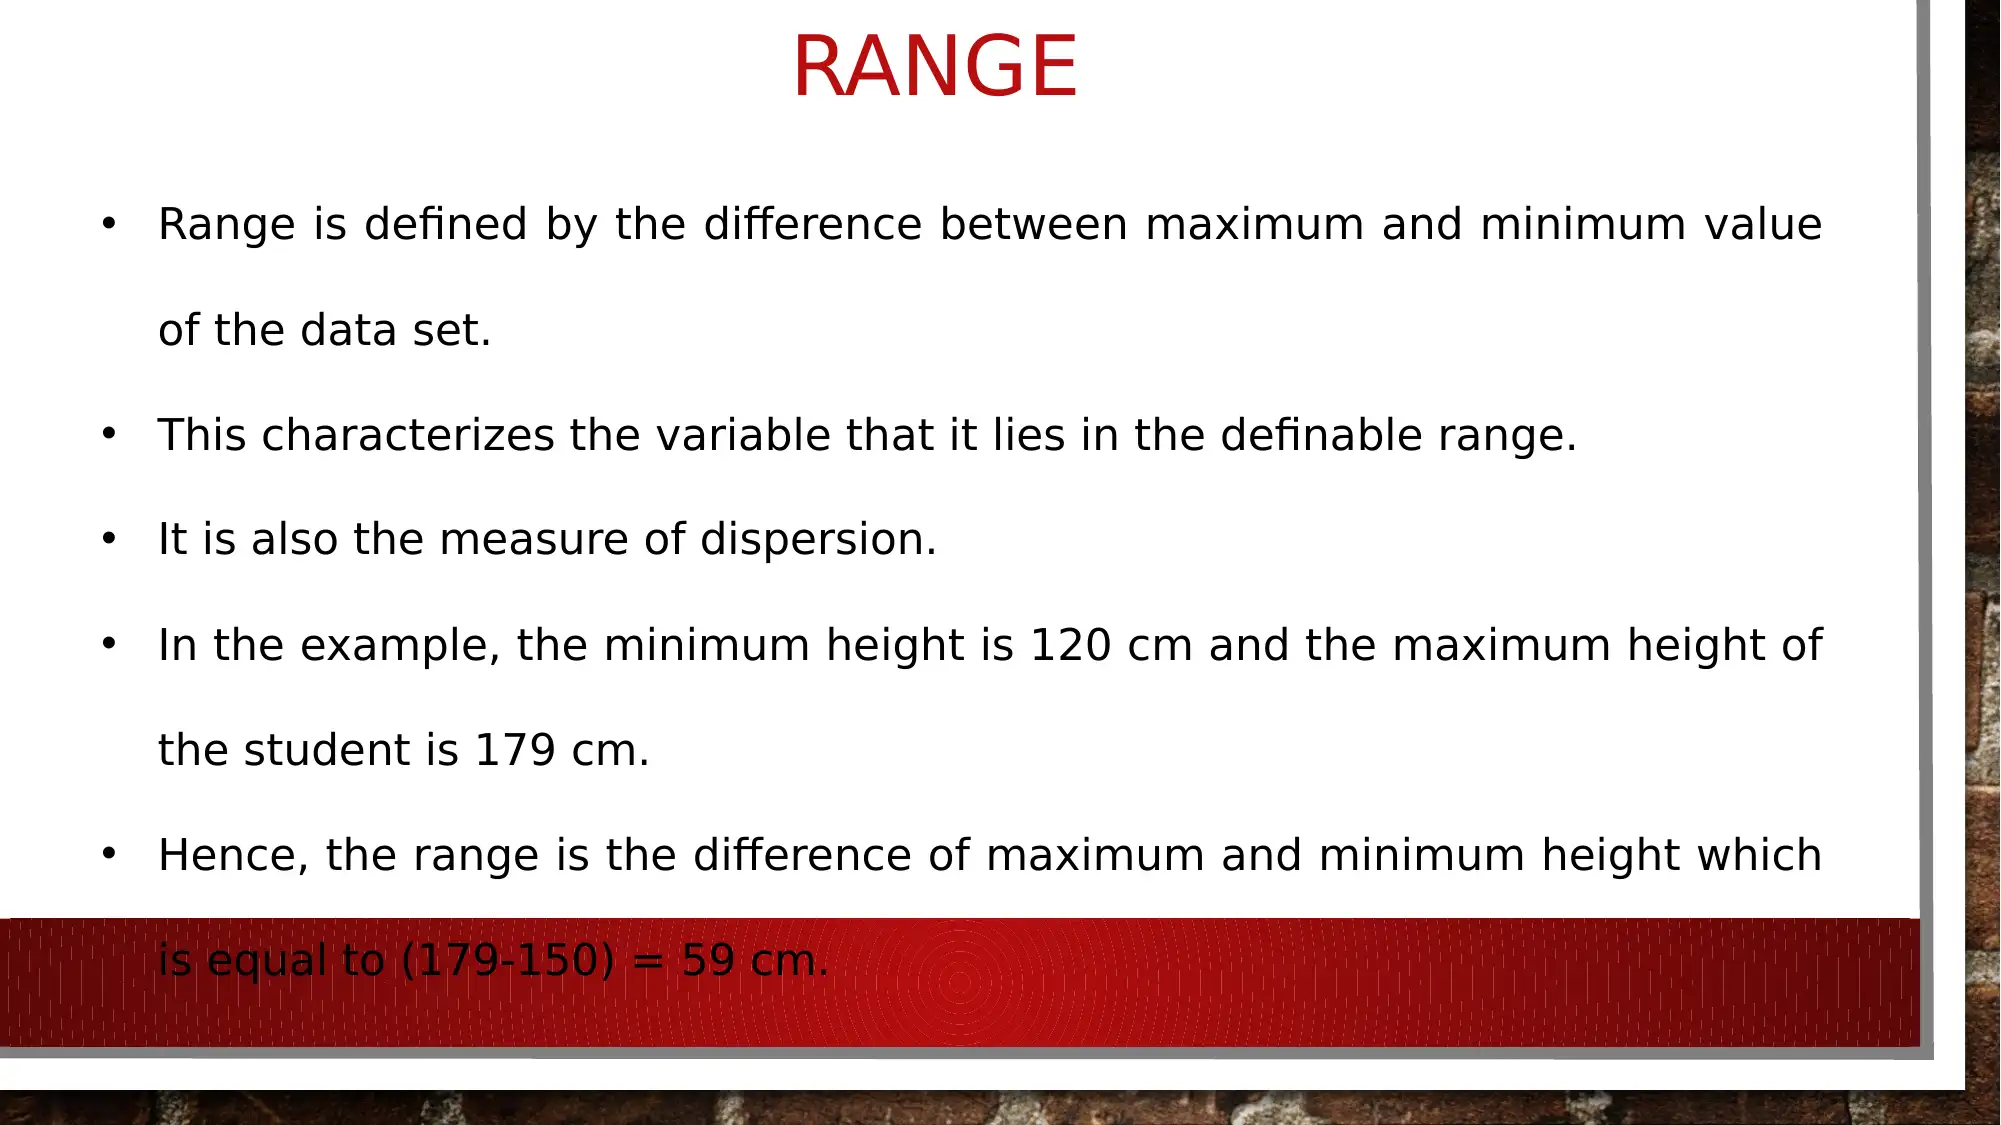
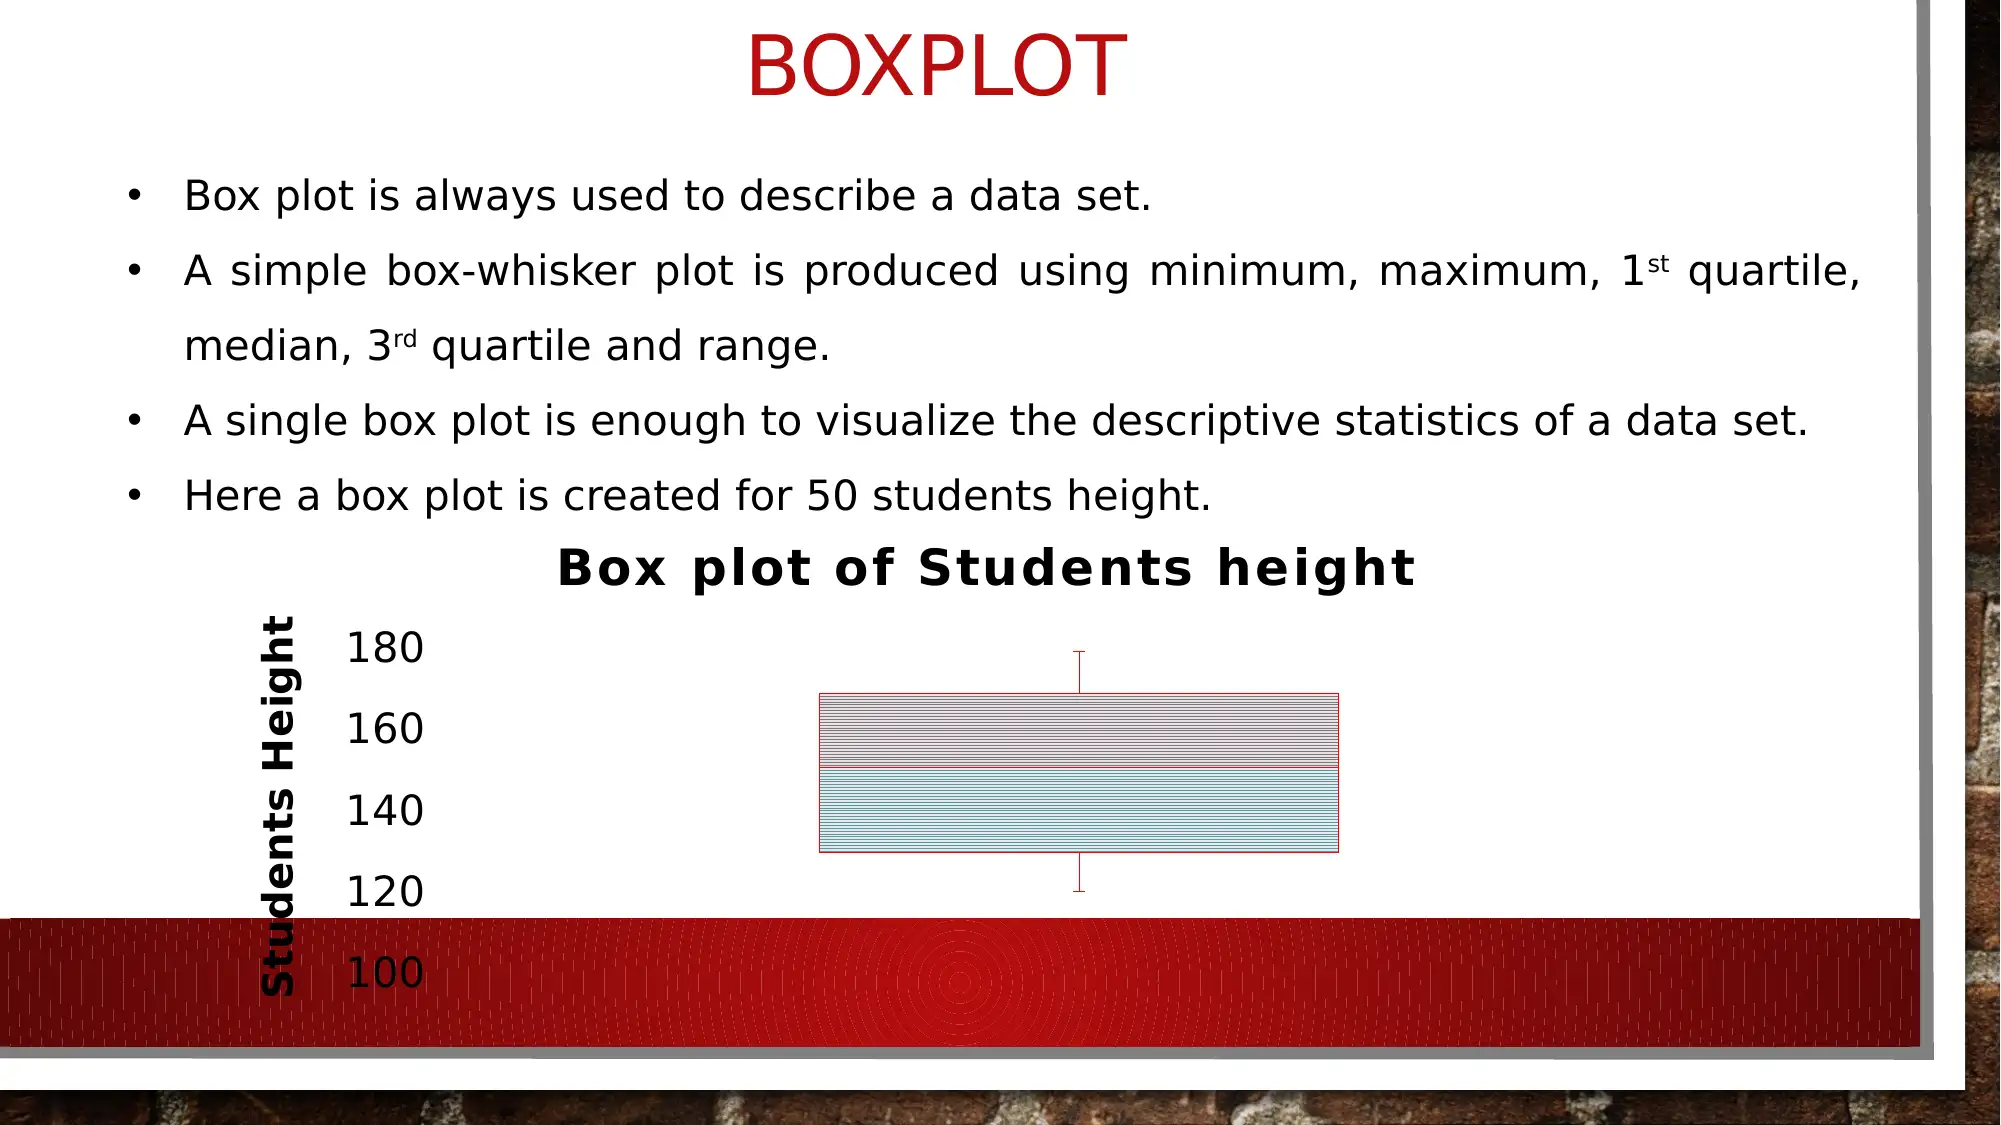
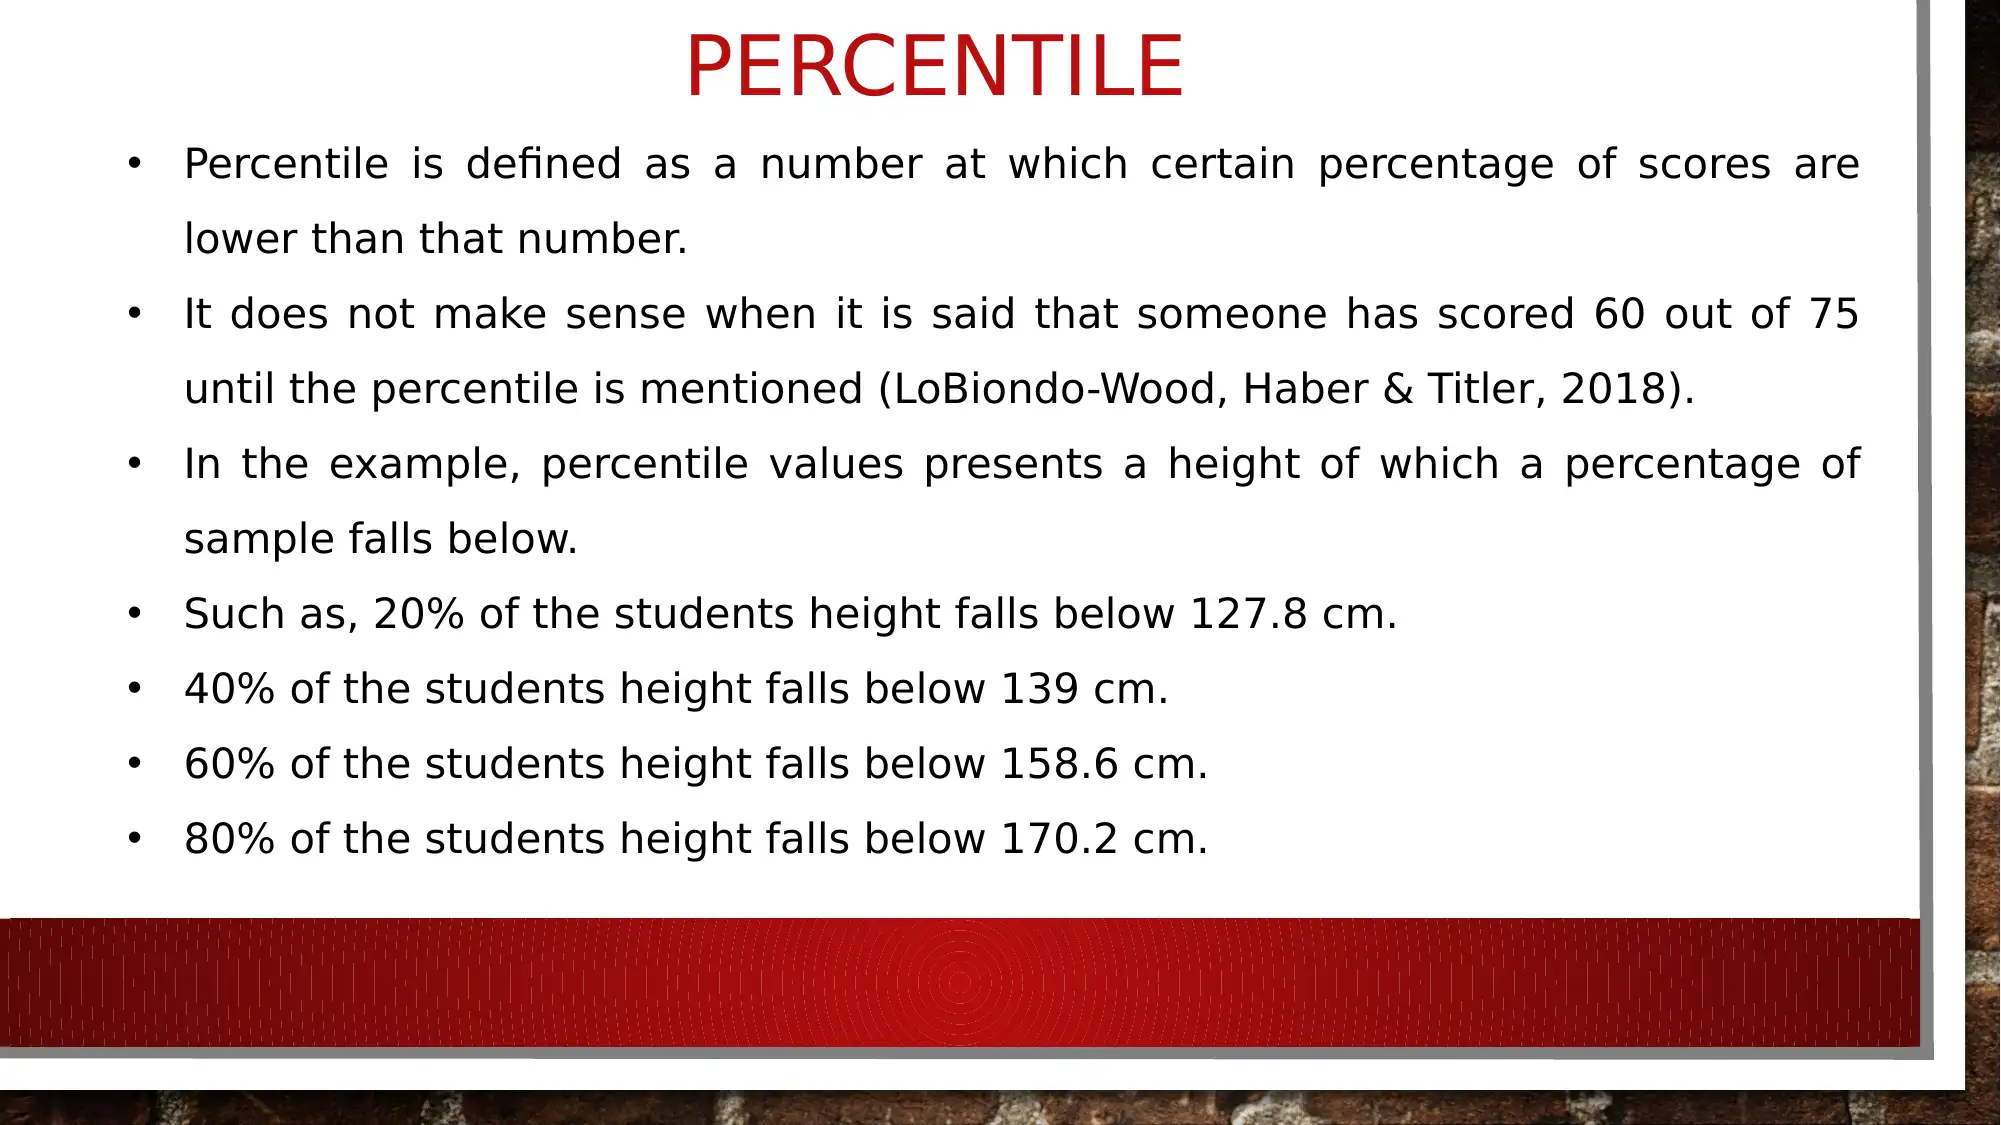
This report provides a detailed overview of descriptive statistics and their application in the healthcare sector. It begins by defining descriptive statistics as methods to summarize variables within a sample population, highlighting measures such as frequency, mean, range, percentile, median, mode, standard deviation, and graphical representations like histograms and box plots. The report emphasizes the importance of measures of central tendency (mean, median, mode) and measures of variability (standard deviation, variance, skewness, kurtosis) in guiding healthcare decisions and assessing performance. It includes explanations and examples of frequency distributions, histograms, and the calculation and interpretation of mean, median, mode, range, box plots, percentiles, and standard deviation, using a sample dataset of student heights. The report concludes by referencing relevant studies and providing an appendix with detailed calculations, demonstrating the practical application of these statistical measures in healthcare analysis. Desklib offers additional solved assignments and study tools for students.
Document Page
DESCRIPTIVE STATISTICS IN
HEALTHCARE
The basic understanding and importance of statistics in
healthcare.
tabler-icon-diamond-filled.svg

Paraphrase This Document

Need a fresh take? Get an instant paraphrase of this document with our AI Paraphraser
Document Page
INTRODUCTION
This is widely used in health care sector as it guides to make decisions
as:
1. The health care industry benefits from significant consumer "demographic"
statistics that can expect the sorts of services.
2. Health care companies measures the performance of success or failure.
Descriptive statistics summarizes variables of sample of population.
There are several measures in descriptive statistics like frequency, mean,
range, percentile, median, mode and standard deviation and plots like
histogram and box plot.
Specifically, it can be expressed by measures of central tendency and
measures of variability.
Measures of central tendency includes mean, median and mode.
Measures of variability includes standard deviation, variance, skewness and
kurtosis.
Document Page
FREQUENCY
Frequency is the number of occurrence of an observation within an interval.
The width of the interval depends on the size of the data and aim of the
study.
The intervals are mutually exclusive and exhaustive.
Frequency is always presented in a tabular or graphical plots (Consoli,
Recupero & Petkovic, 2019).
For example, height of students can be distributed in different intervals.
In measuring the height of 50 students (assume), they can be split in three
groups short, medium and tall.
The interval used to create groups must not overlap each other and should
not contain all the observations.
Document Page
HISTOGRAM
Histogram is a graphical representation that arranges the group of data
into ranges.
It presents the frequency distribution of the data.
The graph presents the range of column in x-axis and the number of count
or frequency on the y-axis.
For example, The below graph shows the distribution of 50 students
height
Below 140 140- Less than 160 Above 160
0
10
20
30
20
10
20
Frequency distribution of students
Range of The distribution
Frequency
tabler-icon-diamond-filled.svg

Paraphrase This Document

Need a fresh take? Get an instant paraphrase of this document with our AI Paraphraser
Document Page
MEAN
A mean shows the average of the set of the data with more than two
observations.
There are several methods to compute mean like arithmetic mean and
geometric mean (Solomon & Morgan, 2018).
Generally arithmetic mean (AM) is used due to its computational technique.
Arithmetic mean is computed using the following formula, where 𝜇= mean of
x, f presents the frequency of x,
For example, the computation of mean is shown for the distribution of 50
students height:
The value indicates that the average height of students is 149.06 cms.
Document Page
MEDIAN
The median is the middle most value of the sorted series.
This can describe the data set more than the mean, by adding information.
It is preferable more than mean when the data has outliers that potentially able
to skew the data.
For odd numbers of data set, median is the value which is in the middle that
divides the data set into two equal parts.
Fro even numbers of data set, the middle pair must be determined and the
average value of those two data points is the median.
Example, there is 50 students in the observation, hence the middle pair is 25th
and 26th data point. These are 150 and 151 respectively. Hence the median for
the height of the students is 150.5 cm (Chatfield, 2018).
Document Page
MODE
Mode is defended as the most frequent number in the data set of numbers.
In other terms, the maximum frequency provides the mode of the data set of
numbers.
Mode is another measure of central tendency and as important as Mean and
Median.
There may exist more than one mode. This happens due to same number of
highest frequency of data set.
The distribution with one mode is called “Unimodal” and the distribution with
two mode is called “Bimodal”.
In the example, there maximum frequency is 3 and it is found for two specific
heights. One is for 124 cm and the other one is for 175 cm.
Hence the distribution is bimodal and modes are 124 cm and 175 cm.
tabler-icon-diamond-filled.svg

Paraphrase This Document

Need a fresh take? Get an instant paraphrase of this document with our AI Paraphraser
Document Page
RANGE
Range is defined by the difference between maximum and minimum value
of the data set.
This characterizes the variable that it lies in the definable range.
It is also the measure of dispersion.
In the example, the minimum height is 120 cm and the maximum height of
the student is 179 cm.
Hence, the range is the difference of maximum and minimum height which
is equal to (179-150) = 59 cm.
Document Page
BOXPLOT
Box plot is always used to describe a data set.
A simple box-whisker plot is produced using minimum, maximum, 1st quartile,
median, 3rd quartile and range.
A single box plot is enough to visualize the descriptive statistics of a data set.
Here a box plot is created for 50 students height.
100
120
140
160
180
Box plot of Students height
Students Height
Document Page
PERCENTILE
Percentile is defined as a number at which certain percentage of scores are
lower than that number.
It does not make sense when it is said that someone has scored 60 out of 75
until the percentile is mentioned (LoBiondo-Wood, Haber & Titler, 2018).
In the example, percentile values presents a height of which a percentage of
sample falls below.
Such as, 20% of the students height falls below 127.8 cm.
40% of the students height falls below 139 cm.
60% of the students height falls below 158.6 cm.
80% of the students height falls below 170.2 cm.
tabler-icon-diamond-filled.svg

Paraphrase This Document

Need a fresh take? Get an instant paraphrase of this document with our AI Paraphraser
Document Page
STANDARD DEVIATION
On of the most important measures of dispersion is standard deviation.
The standard deviation shows the dispersion of the data set from the mean.
It is nothing but the square root of variance.
Another way to calculate standard deviation is using formula.
Formula: f presents the frequency of the data point, N is the summation of the
frequency (Falk, 2018).
The standard deviation for the height of the students:
Document Page
REFERENCE
Chatfield, C. (2018). Statistics for technology: a course in applied statistics.
Routledge.
Consoli, S., Recupero, D. R., & Petkovic, M. (2019). Data Science for Healthcare.
Springer International Publishing.
Falk, R. (2018). Understanding probability and statistics: a book of problems. AK
Peters/CRC Press.
LoBiondo-Wood, G., Haber, J., & Titler, M. G. (2018). Evidence-Based Practice for
Nursing and Healthcare Quality Improvement-E-Book. Elsevier Health Sciences.
Solomon, J. A., & Morgan, M. J. (2018). Calculation efficiencies for mean
numerosity. Psychological science, 29(11), 1824-1831.
Stewart, A. (2018). Basic statistics and epidemiology: a practical guide. CRC
Press.
chevron_up_icon
1 out of 13
circle_padding
hide_on_mobile
zoom_out_icon
[object Object]