Descriptive Statistics and Probability Analysis for MBA Programs

Verified

Added on  2022/11/24

|12
|873
|325
Homework Assignment
AI Summary
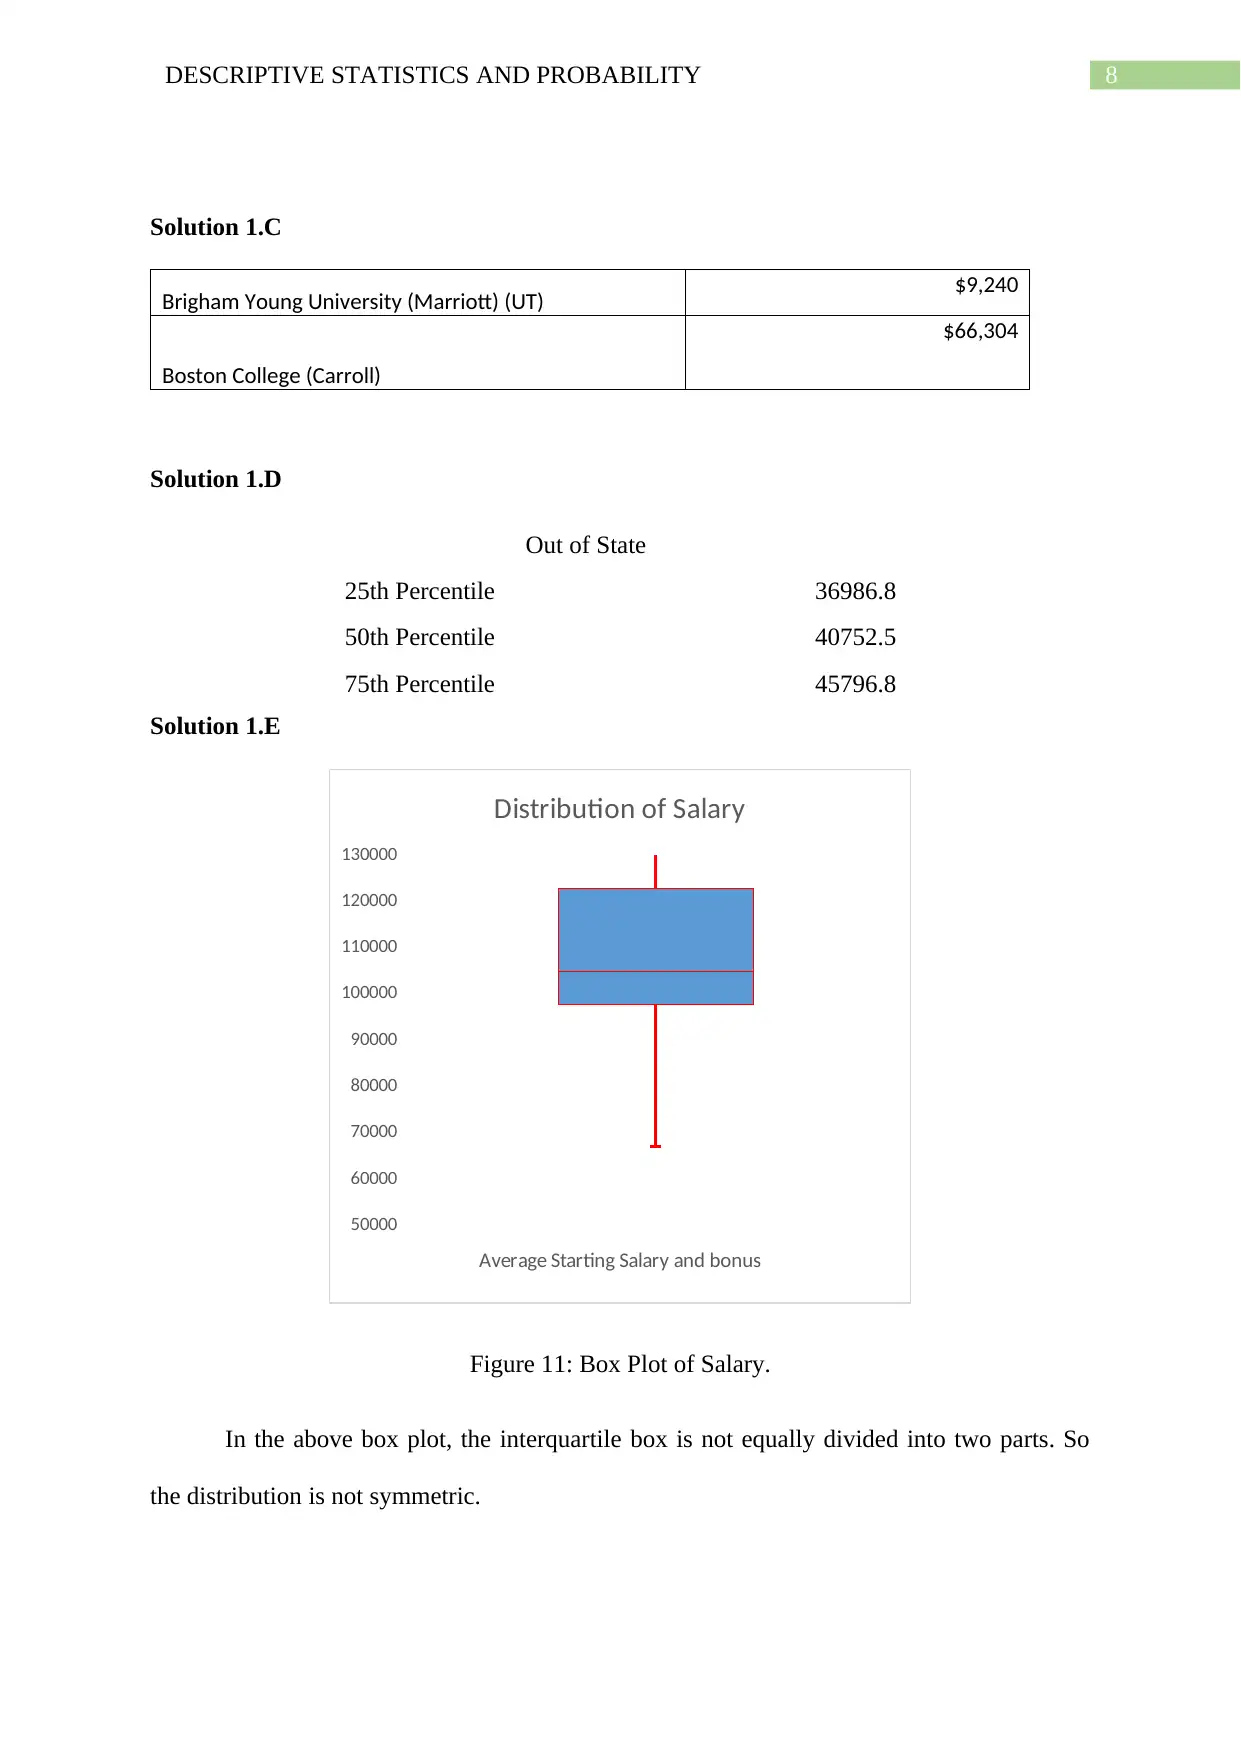
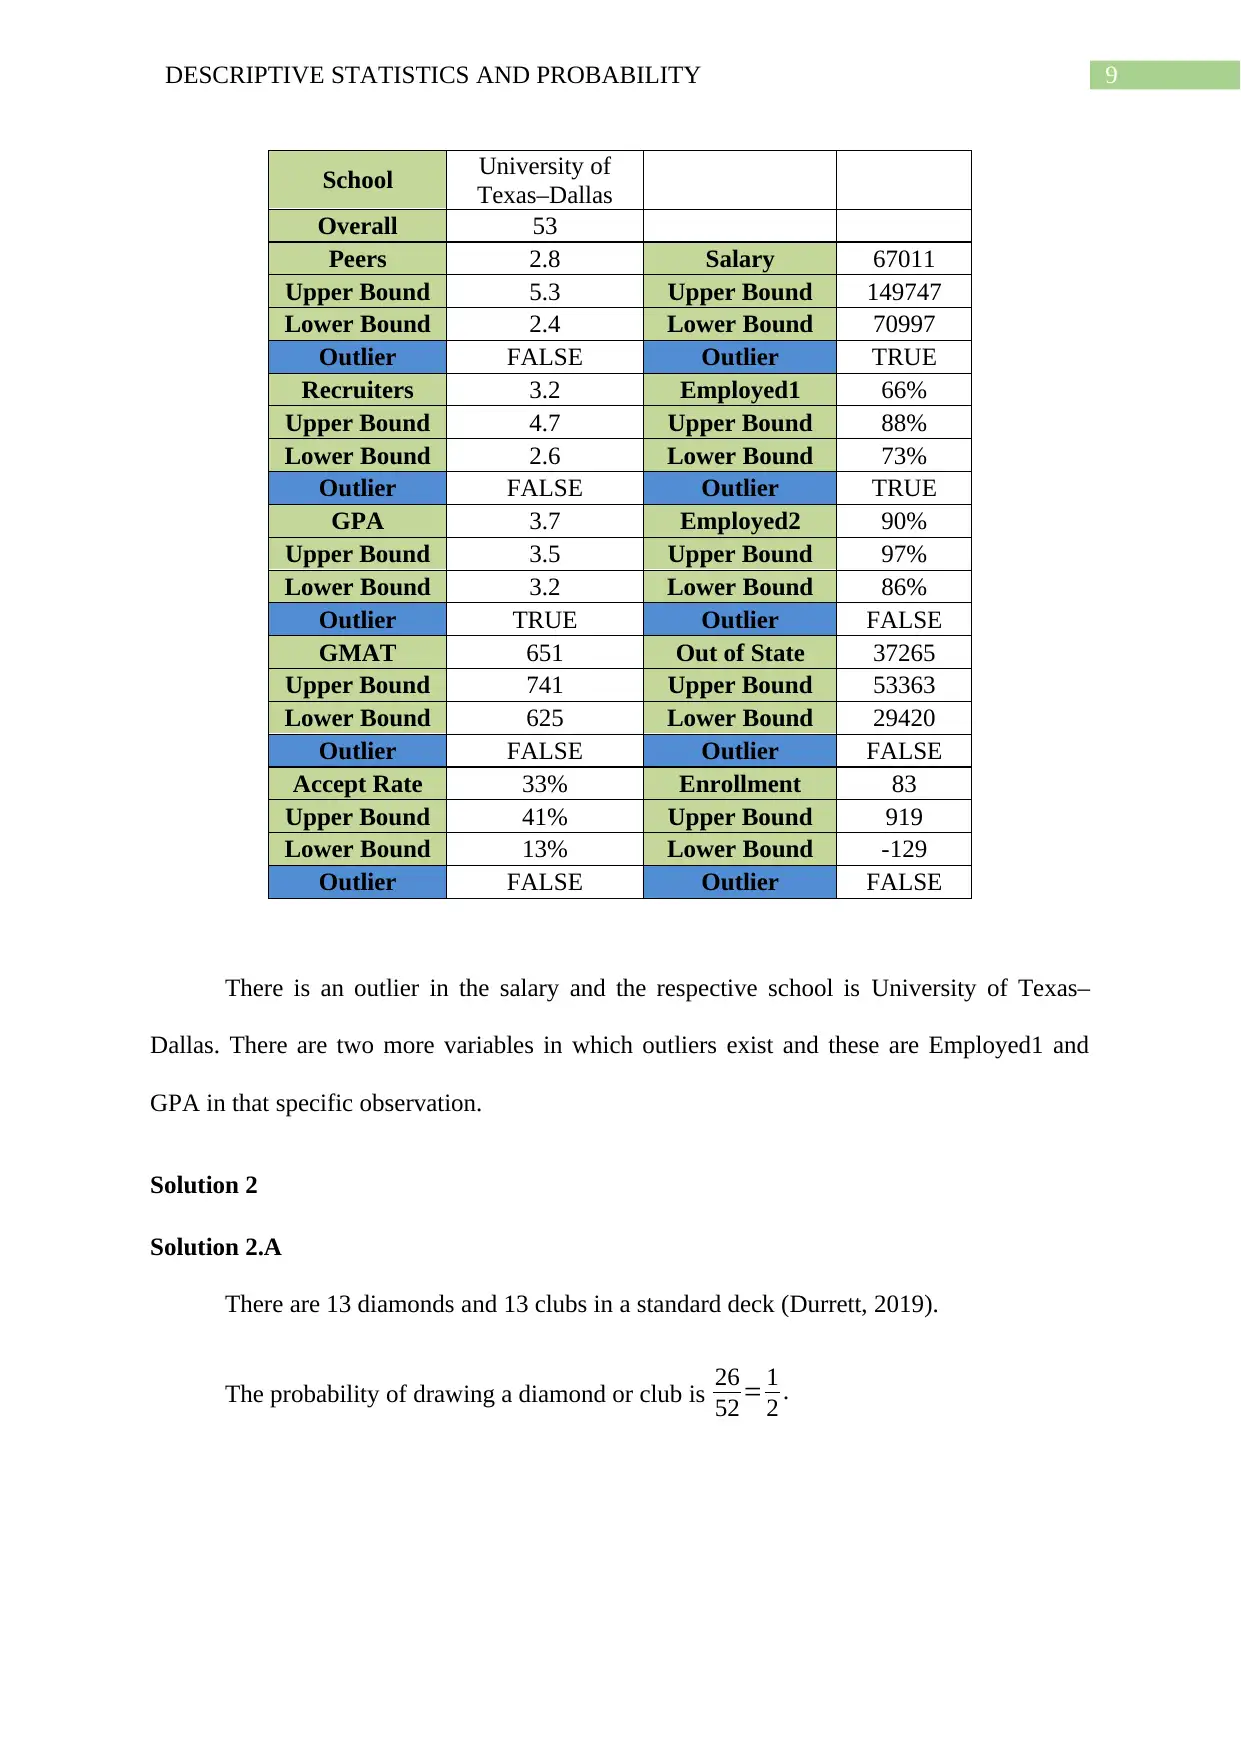
This assignment solution delves into descriptive statistics and probability, covering key concepts such as measures of central tendency and dispersion. It analyzes a dataset of MBA program statistics, including peer scores, recruiter scores, GPA, GMAT scores, acceptance rates, salaries, and enrollment data. The solution includes data type identification, histogram creation to assess skewness, identification of outliers, and the use of box plots. Furthermore, the assignment explores probability calculations using a standard deck of cards, determining the probability of drawing specific card types and assessing the independence of events.
Document Page
Running head: DESCRIPTIVE STATISTICS AND PROBABILITY
Descriptive Statistics and Probability
Name of the Student:
Name of the University:
Author Note:
tabler-icon-diamond-filled.svg

Paraphrase This Document

Need a fresh take? Get an instant paraphrase of this document with our AI Paraphraser
Document Page
1DESCRIPTIVE STATISTICS AND PROBABILITY
Table of Contents
Solution 1:..................................................................................................................................2
Solution 1.A...........................................................................................................................2
Solution 1.B............................................................................................................................3
Solution 1.C............................................................................................................................8
Solution 1.D...........................................................................................................................8
Solution 1.E............................................................................................................................8
Solution 2...................................................................................................................................9
Solution 2.A...........................................................................................................................9
Solution 2.B..........................................................................................................................10
Solution 2.C..........................................................................................................................10
Solution 2.D.........................................................................................................................10
Solution 2.E..........................................................................................................................10
Document Page
2DESCRIPTIVE STATISTICS AND PROBABILITY
Solution 1:
Descriptive statistics is divided into two parts one is Measure of central tendency
and Measure of dispersion. Measure of central tendency includes mean, median and mode.
Measure of dispersion includes standard deviation, variance, range, interquartile range,
quartiles and percentiles, skewness and kurtosis. The measure of central tendency and
measure of dispersion can be presented graphically with the help of Histogram and Box plot.
This are used in the following sections.
Solution 1.A
The type of data for each of the 10 variables:
1. Peers: This variable contains the scores of peer schools. This variable is numerical.
2. Recruiters: This contains the score by recruiters. This is a numerical variable.
3. GPA: This contains average undergrad GPA. It is a numerical variable.
4. GMAT: This shows the average GMAT score. It is a numerical Variable.
5. Accept Rate: This presents the acceptance rate. It is a numerical Variable.
6. Salary: This presents the average starting salary and bonus. It is a numerical
Variable.
7. Employed1: This presents percentage of graduates employed at graduation time. It is
a numerical Variable.
8. Employed2: Percentage of graduates employed 3 months after graduation. It is a
numerical Variable.
9. Out of state: Out-of-state tuition and fees. It is a numerical Variable.
10. Enrolment: Total full-time enrolment. It is a numerical Variable.
Document Page
3DESCRIPTIVE STATISTICS AND PROBABILITY
Solution 1.B
3.2 3.6 4.0 4.4 4.8
0
2
4
6
8
10
12
14
16
18
20
Histogram of Score by Peer
Frequency
Bin
Frequency
Figure 1: Histogram of peers
The above histogram is right skewed.
3.2 3.5 3.9 4.2 4.5
0
2
4
6
8
10
12
14
16
18
Histogram of Score by Recruiters
Frequency
Bin
Frequency
Figure 2: Histogram of recruiters
The histogram in figure 2 is left skewed.
tabler-icon-diamond-filled.svg

Paraphrase This Document

Need a fresh take? Get an instant paraphrase of this document with our AI Paraphraser
Document Page
4DESCRIPTIVE STATISTICS AND PROBABILITY
3.3 3.4 3.5 3.6 3.7
0
5
10
15
20
25
Histogram of GPA
Frequency
Bin
Frequency
Figure 3: Histogram of GPA
The histogram of GPA is left skewed.
649.0 668.0 687.0 706.0 725.0
0
2
4
6
8
10
12
14
16
Histogram of GMAT
Frequency
Bin
Frequency
Figure 4: Histogram of GMAT
The above histogram is right skewed.
Document Page
5DESCRIPTIVE STATISTICS AND PROBABILITY
0.2 0.3 0.4 0.5 0.6
0
2
4
6
8
10
12
14
16
18
20
Histogram of Accept Rate
Frequency
Bin
Frequency
Figure 5: Histogram of accept rate
The histogram of acceptance rate is left skewed.
82461.0 97911.0 113361.0 128811.0 144261.0
0
2
4
6
8
10
12
14
16
18
20
Histogram of Salary
Frequency
Bin
Frequency
Figure 6: Histogram of salary
The histogram of salary is almost normally distributed.
Document Page
6DESCRIPTIVE STATISTICS AND PROBABILITY
68% 74% 81% 87% 94%
0
5
10
15
20
25
Histogram of Employed1
Frequency
Bin
Frequency
Figure 7: Histogram of employed1
The histogram of the employed1 is right skewed.
87% 90% 93% 97% 100% More
0
2
4
6
8
10
12
14
16
18
20
Histogram of Employed2
Frequency
Bin
Frequency
Figure 8: Histogram of employed2
The histogram of the employed2 is normally distributed.
tabler-icon-diamond-filled.svg

Paraphrase This Document

Need a fresh take? Get an instant paraphrase of this document with our AI Paraphraser
Document Page
7DESCRIPTIVE STATISTICS AND PROBABILITY
20652.0 32064.0 43476.0 54888.0 66300.0 More
0
5
10
15
20
25
Histogram of Out of State
Frequency
Bin
Frequency
Figure 9: Histogram of out of state
The histogram of out of state is right skewed
426.0 769.0 1112.0 1455.0 1798.0 More
0
5
10
15
20
25
30
35
Histogram of Enrollment
Frequency
Bin
Frequency
Figure 10: Histogram of enrolment
The histogram of enrolment is left skewed.
Document Page
8DESCRIPTIVE STATISTICS AND PROBABILITY
Solution 1.C
Brigham Young University (Marriott) (UT) $9,240
Boston College (Carroll)
$66,304
Solution 1.D
Out of State
25th Percentile 36986.8
50th Percentile 40752.5
75th Percentile 45796.8
Solution 1.E
50000
60000
70000
80000
90000
100000
110000
120000
130000
Distribution of Salary
Average Starting Salary and bonus
Figure 11: Box Plot of Salary.
In the above box plot, the interquartile box is not equally divided into two parts. So
the distribution is not symmetric.
Document Page
9DESCRIPTIVE STATISTICS AND PROBABILITY
School University of
Texas–Dallas
Overall 53
Peers 2.8 Salary 67011
Upper Bound 5.3 Upper Bound 149747
Lower Bound 2.4 Lower Bound 70997
Outlier FALSE Outlier TRUE
Recruiters 3.2 Employed1 66%
Upper Bound 4.7 Upper Bound 88%
Lower Bound 2.6 Lower Bound 73%
Outlier FALSE Outlier TRUE
GPA 3.7 Employed2 90%
Upper Bound 3.5 Upper Bound 97%
Lower Bound 3.2 Lower Bound 86%
Outlier TRUE Outlier FALSE
GMAT 651 Out of State 37265
Upper Bound 741 Upper Bound 53363
Lower Bound 625 Lower Bound 29420
Outlier FALSE Outlier FALSE
Accept Rate 33% Enrollment 83
Upper Bound 41% Upper Bound 919
Lower Bound 13% Lower Bound -129
Outlier FALSE Outlier FALSE
There is an outlier in the salary and the respective school is University of Texas–
Dallas. There are two more variables in which outliers exist and these are Employed1 and
GPA in that specific observation.
Solution 2
Solution 2.A
There are 13 diamonds and 13 clubs in a standard deck (Durrett, 2019).
The probability of drawing a diamond or club is 26
52 = 1
2 .
tabler-icon-diamond-filled.svg

Paraphrase This Document

Need a fresh take? Get an instant paraphrase of this document with our AI Paraphraser
Document Page
10DESCRIPTIVE STATISTICS AND PROBABILITY
Solution 2.B
There four cards that are 4 in a standard deck. So the probability of getting a 4 is
4
52= 1
13 . So, the probability of not getting a 4 is 1 1
13 = 12
13 .
Solution 2.C
There are 26 black cards of which 13 cards are spade in the deck. So, the probability
of getting a spade is 13
26 = 1
2 .
Solution 2.D
E1 and E2 are not independent events. These two events are not independent as spades
are always black (Gnedenko, 2018).
Solution 2.E
E3 and E4 are independent events. These two events are independent as 3s in a deck
are red and black.
Document Page
11DESCRIPTIVE STATISTICS AND PROBABILITY
Reference
Durrett, R. (2019). Probability: theory and examples (Vol. 49). Cambridge university press.
Gnedenko, B. V. (2018). Theory of probability. Routledge.
chevron_up_icon
1 out of 12
circle_padding
hide_on_mobile
zoom_out_icon
[object Object]