University Design Thinking Report: Visualisation Techniques Analysis
VerifiedAdded on 2022/11/13
|14
|3088
|137
Report
AI Summary
This report examines the crucial role of visualisation within the design thinking process. The report begins by defining visualisation and its various types, including scientific, two-dimensional, and temporal visualisations. It then explores the significance of visualisation in design thinking, highlighting its importance in problem understanding, concept generation, and assessment explanations. The report details the uses of data visualisation, such as stimulating, clarifying, and questioning, along with the principles of design balancing, highlighting important parts, and smooth designs. It also discusses the benefits and drawbacks of visualisation, concluding that visualisation is the “mother of all design tools” and is essential for system thinking and designing. The assignment includes a comprehensive analysis of design thinking tools and their application in a university setting. The report also includes references to relevant literature, providing a comprehensive overview of the topic. This assignment is contributed by a student and is available on Desklib, a platform providing AI-based study tools for students.
Running head: VISUALISATION
VISUALISATION
Name of the Student:
Name of the University:
Author note:
VISUALISATION
Name of the Student:
Name of the University:
Author note:
Paraphrase This Document
Need a fresh take? Get an instant paraphrase of this document with our AI Paraphraser
1VISUALISATION
Table of Contents
Introduction:-...................................................................................................................................3
Discussion:-.....................................................................................................................................3
What is Visualisation:-................................................................................................................3
Types of Visualisation:-...............................................................................................................4
Significance of Visualization in design thinking:-......................................................................5
Generating the concept:-..........................................................................................................6
Assessment Explanations:-......................................................................................................6
Uses of Data visualisation:-.........................................................................................................7
Stimulating: -...........................................................................................................................7
Clarifying: -.............................................................................................................................7
Questioning:.............................................................................................................................7
Principles of Visualisation:-....................................................................................................8
Design Balancing:-..................................................................................................................8
Highlight the important parts:-....................................................................................................9
Explaining program:-...............................................................................................................9
Smooth designs:-.....................................................................................................................9
Proportion:-..............................................................................................................................9
Appropriate regularity:-.........................................................................................................10
Variation:-..............................................................................................................................10
Subject:-.................................................................................................................................10
Benefits of Visualization:-.........................................................................................................11
Drawbacks of Visualisation:-....................................................................................................11
Conclusion:-...................................................................................................................................12
References:-...................................................................................................................................13
2VISUALISATION
Introduction:-
Design thinking is an essential idea for design. Design Thinking is a procedure where the
user finds to understand the operator, test expectations, and outline difficulties. It is an effort to
identify substitute plans and explanations that might not be instantaneously baseless with initial
human understanding. Every design starts with problems at the very first. Design thinking is the
technique of assuming the principle of challenges based on their restrictions. One designer
follows some guidelines for creating some good design. Proper system thinking and correct
execution are very important for conception (Oxman, 2017). There are some steps which are
related to design thinking. Understanding, description, formation, model and testing are the five
stages of design thinking. A designer used some necessary tools for completing any design
correctly. There are 12 types of devices essential for design thinking. Value chain analysis, Mind
mapping, visualisation, prototyping, Observation, client co-creation, Testing, Brainstorming,
journey mapping, learning launch and concept development (Glen et al., 2014). In this
assignment, the discussion topic is the visualisation which is the one essential tools of design
thinking.
Discussion:-
What is Visualisation:-
Visualisation is an analytical procedure for generating descriptions, drawings, or cartoons
to interconnect a message. Through this process, the graphic descriptions have been an
operational technique to connect both intangible and real thoughts since the dawn of mortality.
Designing data imaginings offers the infinite user potentials when it originates from end
products. It would be incredible to deliver stepwise directions for all these potentials. However,
⊘ This is a preview!⊘
Do you want full access?
Subscribe today to unlock all pages.
Trusted by 1+ million students worldwide
3VISUALISATION
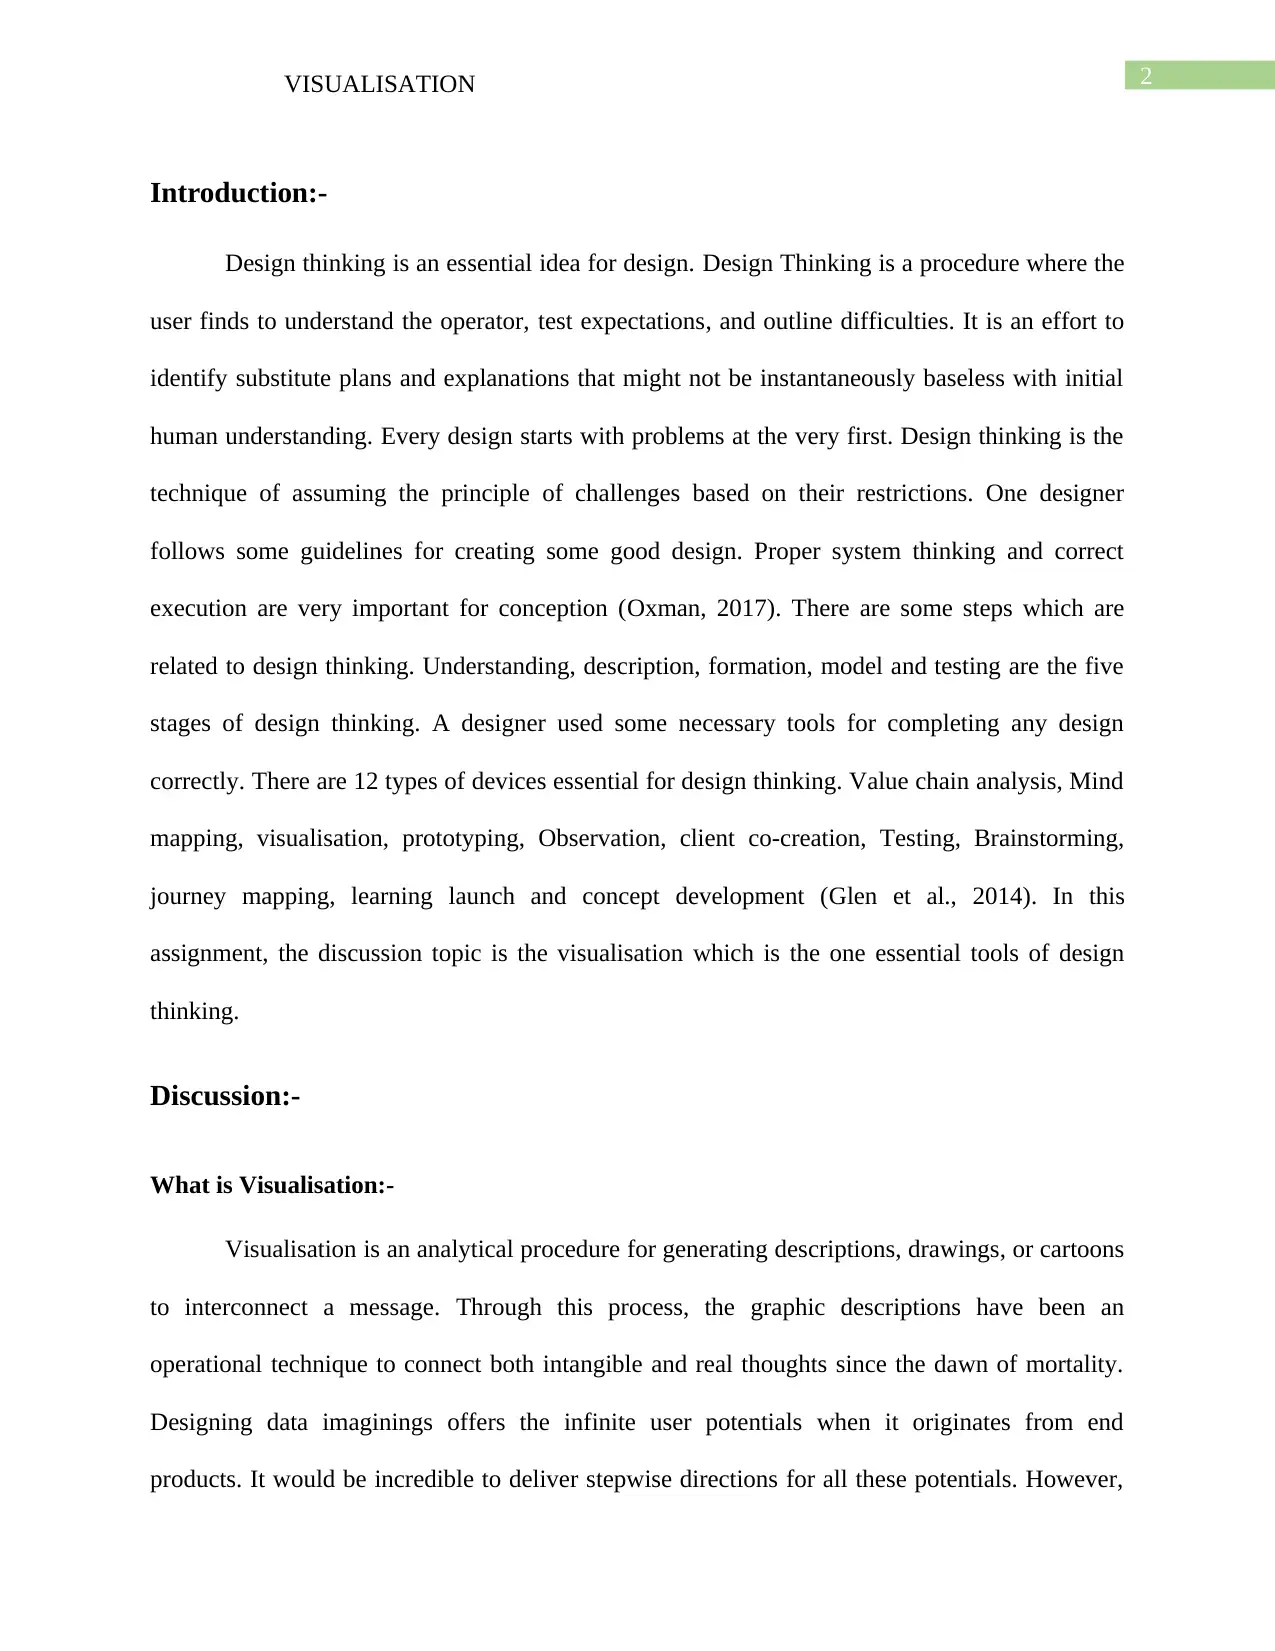
it is easy to describe that while the close products may vary intensely. These are the procedure by
which human spread the best potential end product is steadily the same.
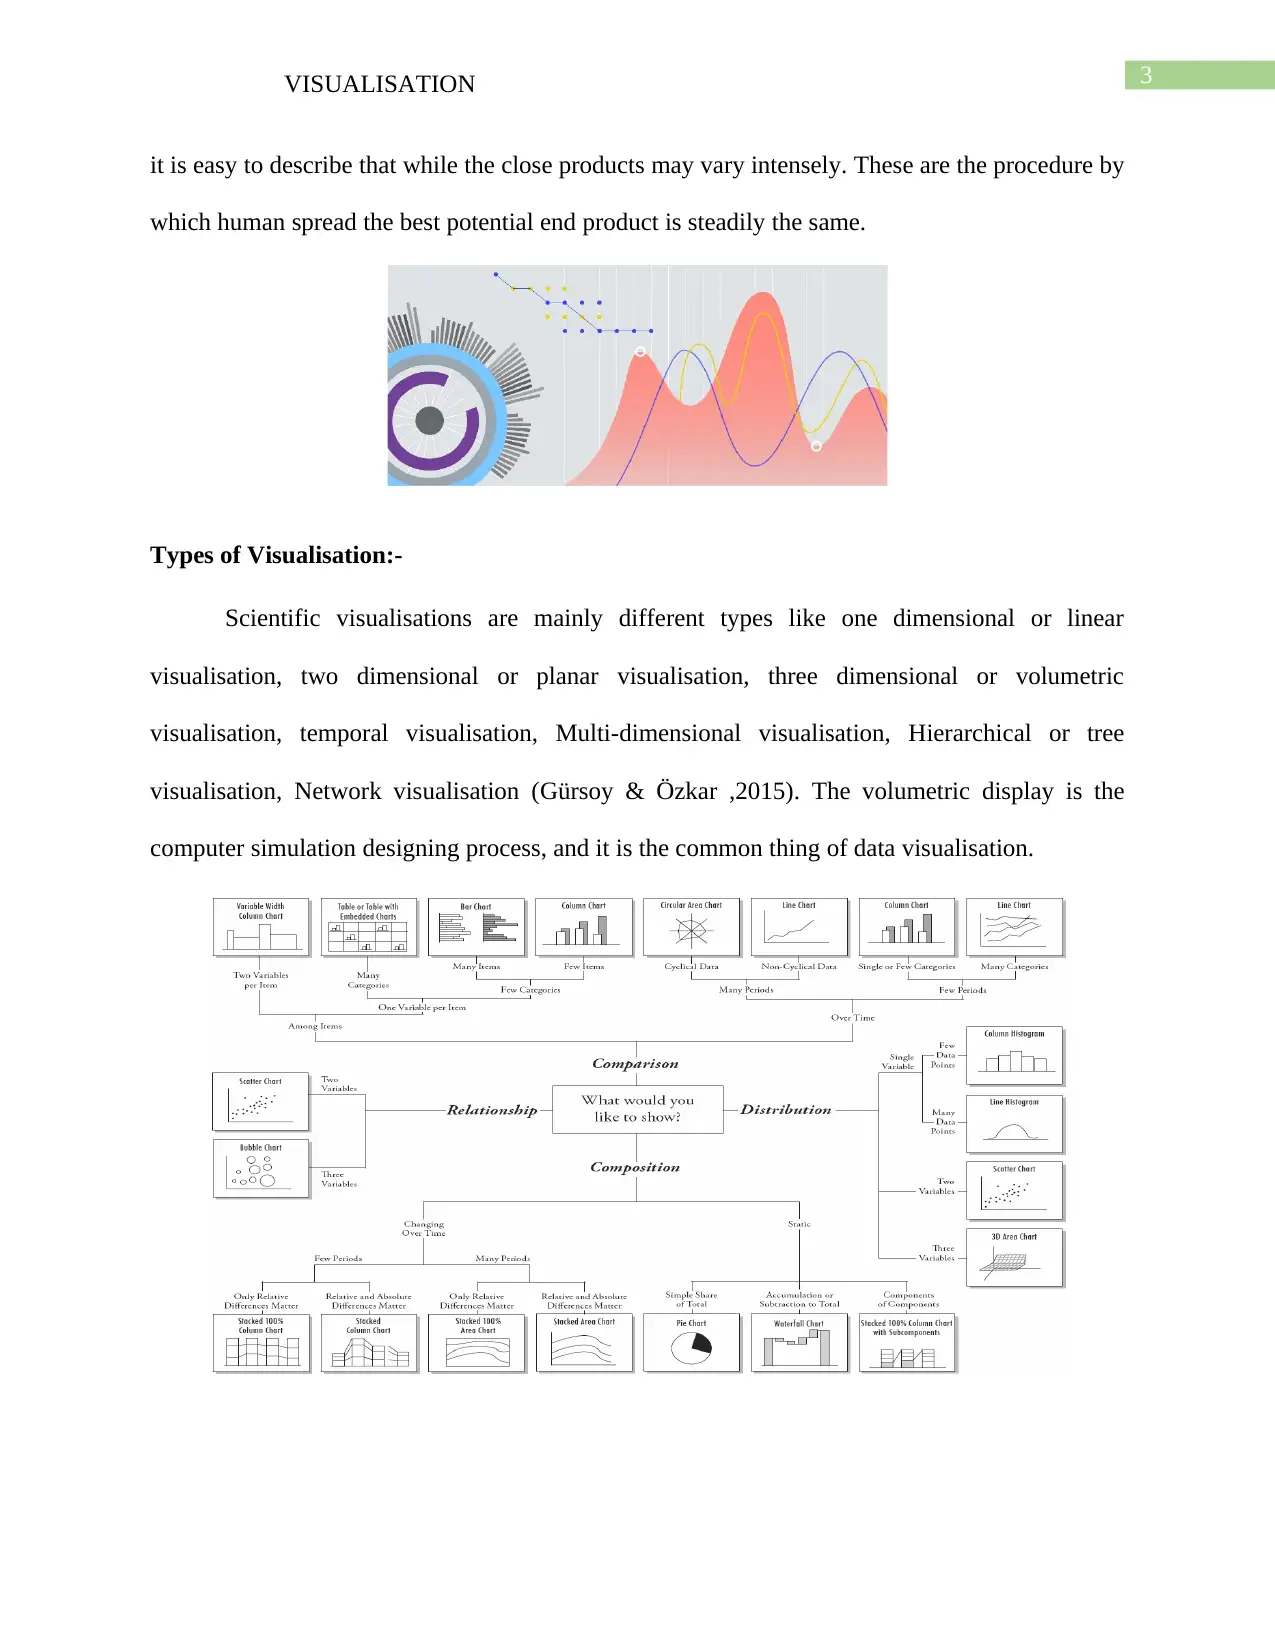
Types of Visualisation:-
Scientific visualisations are mainly different types like one dimensional or linear
visualisation, two dimensional or planar visualisation, three dimensional or volumetric
visualisation, temporal visualisation, Multi-dimensional visualisation, Hierarchical or tree
visualisation, Network visualisation (Gürsoy & Özkar ,2015). The volumetric display is the
computer simulation designing process, and it is the common thing of data visualisation.
it is easy to describe that while the close products may vary intensely. These are the procedure by
which human spread the best potential end product is steadily the same.
Types of Visualisation:-
Scientific visualisations are mainly different types like one dimensional or linear
visualisation, two dimensional or planar visualisation, three dimensional or volumetric
visualisation, temporal visualisation, Multi-dimensional visualisation, Hierarchical or tree
visualisation, Network visualisation (Gürsoy & Özkar ,2015). The volumetric display is the
computer simulation designing process, and it is the common thing of data visualisation.
Paraphrase This Document
Need a fresh take? Get an instant paraphrase of this document with our AI Paraphraser
4VISUALISATION
In a two dimensional area, there are three types of data visualisations like distribution
map, distance map and regions chart. Time series, Polar diagram, and scatter plot are part of the
temporal data visualisation (Oxman , 2017). So, selecting the right procedure of conception
depends on what designer need to display, spectator’s requirements, and what evidence the
viewer requirements to be practical.
Significance of Visualization in design thinking:-
Visualisation is the essential tools for design thinking process. It is vital to know how
visualisation tools help to create a perfectly designed explanation.
Problem Understanding:-
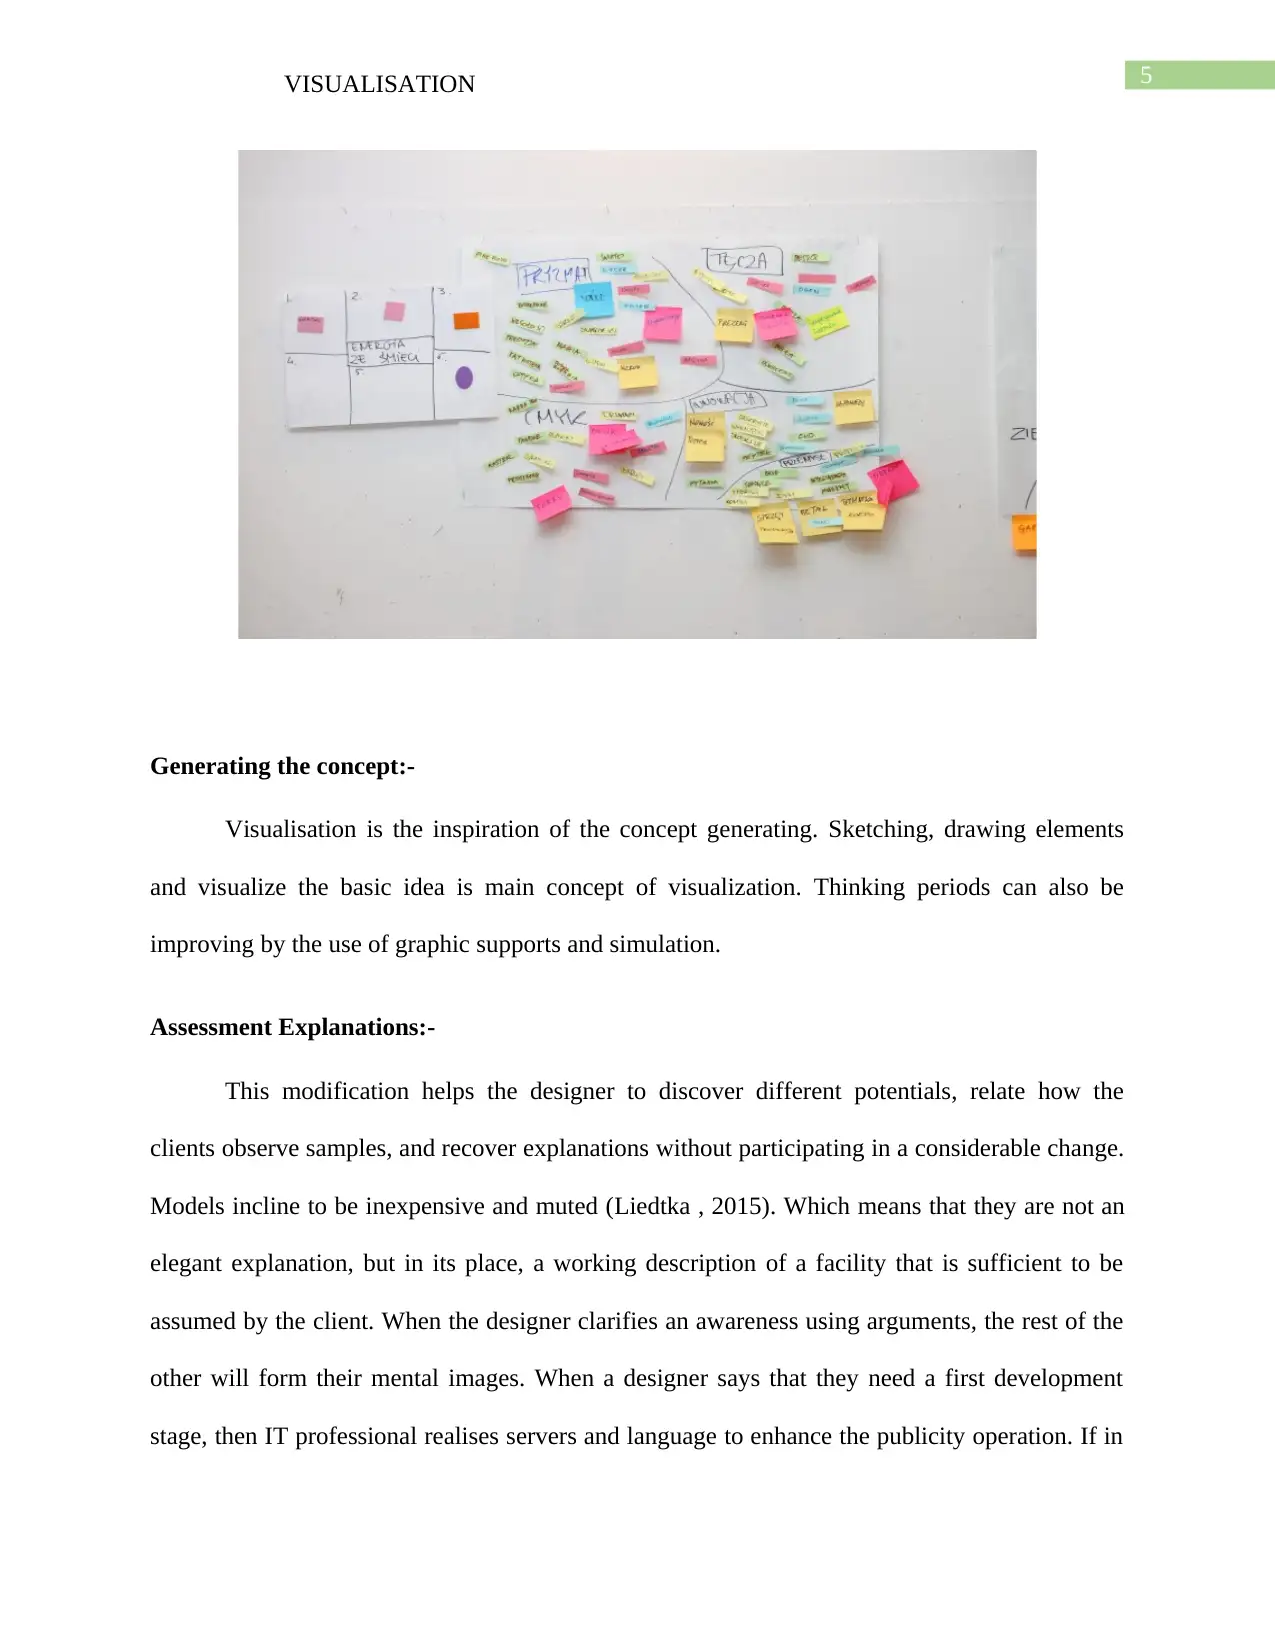
The first designer has to shape good thinking of the difficulties that they are trying to
explain. Meetings, explanations, desk investigation and other exploration methods that are
applying through this phase were creating data (Gray & Mallins, 2016). This record has to be
assembled and investigate. Generating an enquiry wall is an excessive way to show visions,
pictures, and objects .all the applicable study productivities gathered in one place. This method
helps the designer to construct influences between diverse findings and recognise the more
prominent representation (McKenna et al., 2014). The visual aspect of the wall initiates
knowledge generation and allows project associates to identify investigation insights better. For
this purpose design thinkers often use apparatuses such as identifying which give a face to the
customer. Visual tools that can use for accepting the problem are for Identities, mind map, client
journey maps.
In a two dimensional area, there are three types of data visualisations like distribution
map, distance map and regions chart. Time series, Polar diagram, and scatter plot are part of the
temporal data visualisation (Oxman , 2017). So, selecting the right procedure of conception
depends on what designer need to display, spectator’s requirements, and what evidence the
viewer requirements to be practical.
Significance of Visualization in design thinking:-
Visualisation is the essential tools for design thinking process. It is vital to know how
visualisation tools help to create a perfectly designed explanation.
Problem Understanding:-
The first designer has to shape good thinking of the difficulties that they are trying to
explain. Meetings, explanations, desk investigation and other exploration methods that are
applying through this phase were creating data (Gray & Mallins, 2016). This record has to be
assembled and investigate. Generating an enquiry wall is an excessive way to show visions,
pictures, and objects .all the applicable study productivities gathered in one place. This method
helps the designer to construct influences between diverse findings and recognise the more
prominent representation (McKenna et al., 2014). The visual aspect of the wall initiates
knowledge generation and allows project associates to identify investigation insights better. For
this purpose design thinkers often use apparatuses such as identifying which give a face to the
customer. Visual tools that can use for accepting the problem are for Identities, mind map, client
journey maps.
5VISUALISATION
Generating the concept:-
Visualisation is the inspiration of the concept generating. Sketching, drawing elements
and visualize the basic idea is main concept of visualization. Thinking periods can also be
improving by the use of graphic supports and simulation.
Assessment Explanations:-
This modification helps the designer to discover different potentials, relate how the
clients observe samples, and recover explanations without participating in a considerable change.
Models incline to be inexpensive and muted (Liedtka , 2015). Which means that they are not an
elegant explanation, but in its place, a working description of a facility that is sufficient to be
assumed by the client. When the designer clarifies an awareness using arguments, the rest of the
other will form their mental images. When a designer says that they need a first development
stage, then IT professional realises servers and language to enhance the publicity operation. If in
⊘ This is a preview!⊘
Do you want full access?
Subscribe today to unlock all pages.
Trusted by 1+ million students worldwide
6VISUALISATION
its place designer present their idea to others by illustrating a representation of it. The designer
decreases the prospect of supreme psychological simulations.
Uses of Data visualization:-
Stimulating: -
The key area here is to motivate persons. Visualisation has an unbelievable power to
invite the public’s care but also to appeal them into fantastic simulated worlds that turn the
intellectual idea into more concrete ones.
Clarifying: -
The foremost goal here is to use illustrations as a way to define some problematic
impression, singularity or development (Wang et al., 2015). These are a part where a graphical
demonstration shines where an image is sometimes genuinely worth several words.
Questioning: -
The main objective here is to extract evidence out of data with the resolve of replying
queries and proceeding of some occurrence of concentration. Positive, descriptive visualisation is
also about serving persons to recognise something.
Paraphrase This Document
Need a fresh take? Get an instant paraphrase of this document with our AI Paraphraser
7VISUALISATION
Principles of Visualisation:-
The part of data imagining in collaborating the compound visions hidden secret data is
vital. There is becoming more significant since the spectators for data conceptions is also
increasing along with the data size. Data imaginings are now expending by individuals from all
sorts of specific circumstances.
Design Balancing:-
A solid plan is one with the graphic fundamentals like figure, paint, negative space and
quality similarly circulated through the plot. These do not necessarily mean the strategy should
be a particular copy of another (Chasanidou et al., 2015). A designer can take out irregular
stability by equalising better charts and diagrams with lesser essentials. There are three different
categories of balances in design.
Regular – Every side of the graphic is similar to another.
Irregular – All sides are diverse but still have a parallel visual mass.
Circular – Elements are locating around an essential purpose which acts as a commentator.
Highlight the important parts:-
The operator's consideration should be sketching to the correct statistical points by
cautiously selecting the scope, contrast, colours and damaging space. The objective of the
visualisation is to make definite that the vital documents don't go ignored and highlighting it
helps.
Explaining program:-
Measure guides the operator’s consideration in a definite way, just like emphasis.
Designer’s graphic fundamentals should mimic measurement in a person’s reading pattern. A
8VISUALISATION
designer could also demonstrate undertaking through the page by using free colours that can
hook the observer’s observation and take it through the page. This standard is more appropriate
for stationary visualisations. If designer imagining tool is proficient of cartoon and cooperative
strategies, the movement feature should already be enclosed.
Smooth designs:-
It comes to imagining the records, and decorations make for an excessive way to
demonstration comparable type of material spread through the page as one. If the documents on
the page are too much for highlighting, creating a design by using related colours, graph types
and basics are the way to go (Seriai et al., 2014). Decorations also make it more refreshing to
interconnect an irregularity since any disturbance in the honour will logically draw the
spectator’s consideration and inquisitiveness. Using decorations is one of the unassuming and
most active design standards when it originates to data imagining.
Proportion:-
In data visualization, the percentage is made up of the size of every component in the
page. Quantities in data imagining can designate the heaviness of dissimilar documents sets and
the connection between their standards (Yosinski et al., 2015). If a designer needs to highlight
the rank of a positive data point. A designer should confirm that the graph redirects the
interconnection of several records as correctly as probable.
Appropriate regularity:-
Regularity is a quite unclear design standard which is carefully related to an undertaking.
A strategy is said to have a stable rhythm when the project elements together generate a pleasing
movement to the obligation (Brenner et al., 2016). If the design basics like figures, colours or
⊘ This is a preview!⊘
Do you want full access?
Subscribe today to unlock all pages.
Trusted by 1+ million students worldwide
9VISUALISATION
sizes together create a structure, then designer might want to reorganise them to simplify flat eye
measure across the information.
Variation:-
Variability is a significant aspect that preserves spectators involved and interested in
designable data. It’s all about judgmental methods to imagine designer data using dissimilar and
remarkable design fundamentals to escape replication (Roberts et al., 2015). The end
consequence will be a data imagining, which is not only beautiful but also benefits the viewer
recollect the data presented for longer.
Subject:-
A united issue confirms each part of the project is dependable and follows a normal.
These should occur if they have taken care of the design as mentioned above philosophies. A
designer can include a subject for any establishment, or grounded on the place of the conception.
These help to attach with the operator on a deeper level and increases the graphic design.
Benefits of Visualization:-
There are some benefits which are related to visualisation. This technique is very much
modern and impressive for design thinking. The display is the limitless process because the
power of the presentation is very much crucial for every designer. When a designer visualised
anything, then he tries to focus on this subject, and this is very much helpful. Visualisation is
essential for enhancing concentration (Glen et al., 2015). Visualisation and design thinking is
very much beneficial for human health. For this visualisation, human can improve their mood
activity. Self-confidence is one of the advantages of viewing. When anybody visualises
Paraphrase This Document
Need a fresh take? Get an instant paraphrase of this document with our AI Paraphraser
10VISUALISATION
something and properly executes this, then they quickly gathered their confidence. Last part is
the inspiration and visualisation helps to inspire the user very quickly.
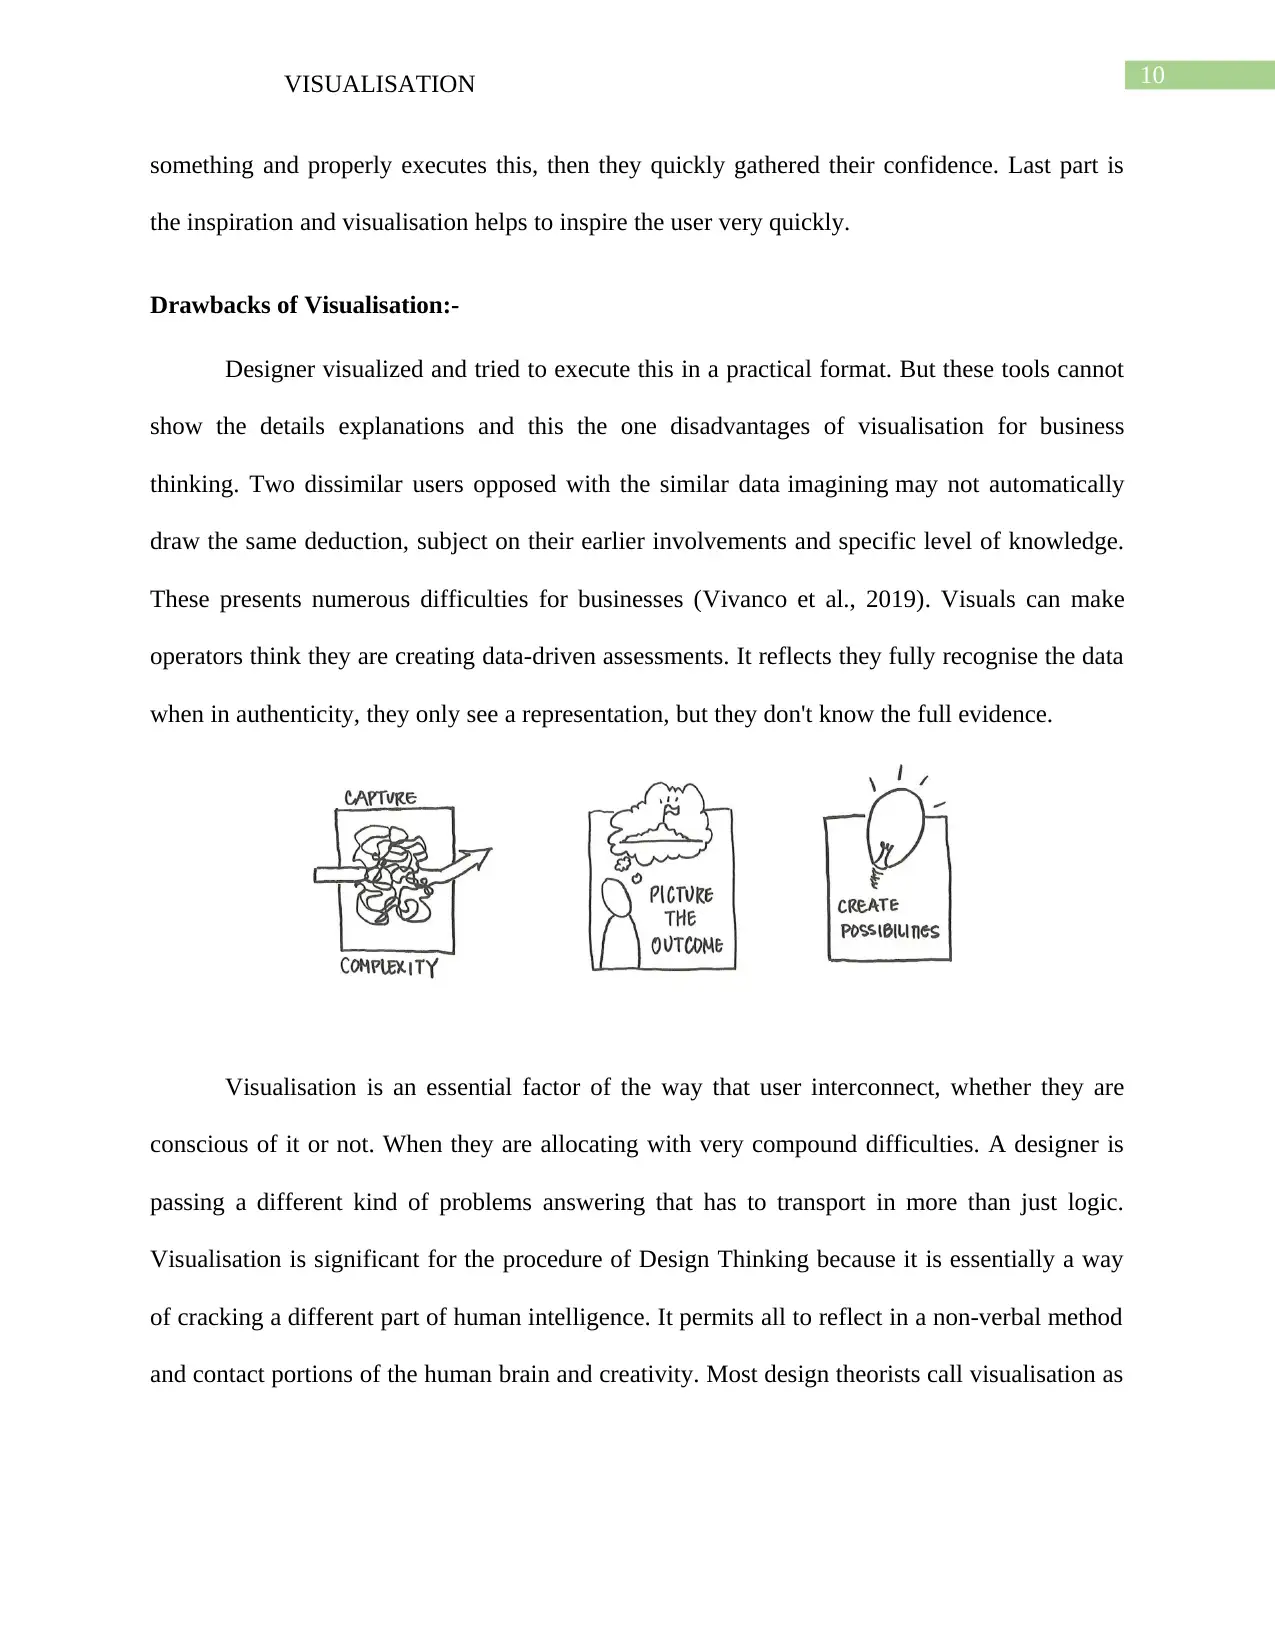
Drawbacks of Visualisation:-
Designer visualized and tried to execute this in a practical format. But these tools cannot
show the details explanations and this the one disadvantages of visualisation for business
thinking. Two dissimilar users opposed with the similar data imagining may not automatically
draw the same deduction, subject on their earlier involvements and specific level of knowledge.
These presents numerous difficulties for businesses (Vivanco et al., 2019). Visuals can make
operators think they are creating data-driven assessments. It reflects they fully recognise the data
when in authenticity, they only see a representation, but they don't know the full evidence.
Visualisation is an essential factor of the way that user interconnect, whether they are
conscious of it or not. When they are allocating with very compound difficulties. A designer is
passing a different kind of problems answering that has to transport in more than just logic.
Visualisation is significant for the procedure of Design Thinking because it is essentially a way
of cracking a different part of human intelligence. It permits all to reflect in a non-verbal method
and contact portions of the human brain and creativity. Most design theorists call visualisation as
something and properly executes this, then they quickly gathered their confidence. Last part is
the inspiration and visualisation helps to inspire the user very quickly.
Drawbacks of Visualisation:-
Designer visualized and tried to execute this in a practical format. But these tools cannot
show the details explanations and this the one disadvantages of visualisation for business
thinking. Two dissimilar users opposed with the similar data imagining may not automatically
draw the same deduction, subject on their earlier involvements and specific level of knowledge.
These presents numerous difficulties for businesses (Vivanco et al., 2019). Visuals can make
operators think they are creating data-driven assessments. It reflects they fully recognise the data
when in authenticity, they only see a representation, but they don't know the full evidence.
Visualisation is an essential factor of the way that user interconnect, whether they are
conscious of it or not. When they are allocating with very compound difficulties. A designer is
passing a different kind of problems answering that has to transport in more than just logic.
Visualisation is significant for the procedure of Design Thinking because it is essentially a way
of cracking a different part of human intelligence. It permits all to reflect in a non-verbal method
and contact portions of the human brain and creativity. Most design theorists call visualisation as
11VISUALISATION
"the mother of all design tools" because they are using in every phase of the project thinking
procedure.
Conclusion:-
According to the designers, visualisation tools are the mother of design thinking tools.
This process is very much crucial for system thinking and designing. Visualisation is equivalent
parts attending, thinking and sketching. Attending is the idea, though it is the dispensation and
sketching is the output. These three abilities work together similarly in accepting difficulty,
visualising results to generate new potentials. It is an unbelievable apparatus. It is not just
approximately that has a presentation in one measure of Project Thinking. It has numerous duties
of being beneficial at altered quantities of the Design Thinking procedure. When the developer
gets to idea expansion, visualisation becomes unbelievably valuable. The human brain is
generating images of somewhat that doesn't yet occur. Its generating representations of somehow
that will soon be. As a designer move forward into prototyping, then designer gets much more
complete in the way that designer start to identify. Then the designer makes very intricate
illustrations or diagrams of how they think the client involvement is going to work preferably.
Images and descriptions allow the designer to support the people to realise what it is trying to do
but to help motivate them in the merit of that specific impression or the strength of that
conception.
⊘ This is a preview!⊘
Do you want full access?
Subscribe today to unlock all pages.
Trusted by 1+ million students worldwide
1 out of 14
Related Documents


Your All-in-One AI-Powered Toolkit for Academic Success.
+13062052269
info@desklib.com
Available 24*7 on WhatsApp / Email
![[object Object]](/_next/static/media/star-bottom.7253800d.svg)
Unlock your academic potential
Copyright © 2020–2026 A2Z Services. All Rights Reserved. Developed and managed by ZUCOL.