Detailed Financial Statement Analysis of Marks and Spencer Ltd.

Verified

Added on  2023/06/10

|10
|2136
|284
Report
AI Summary
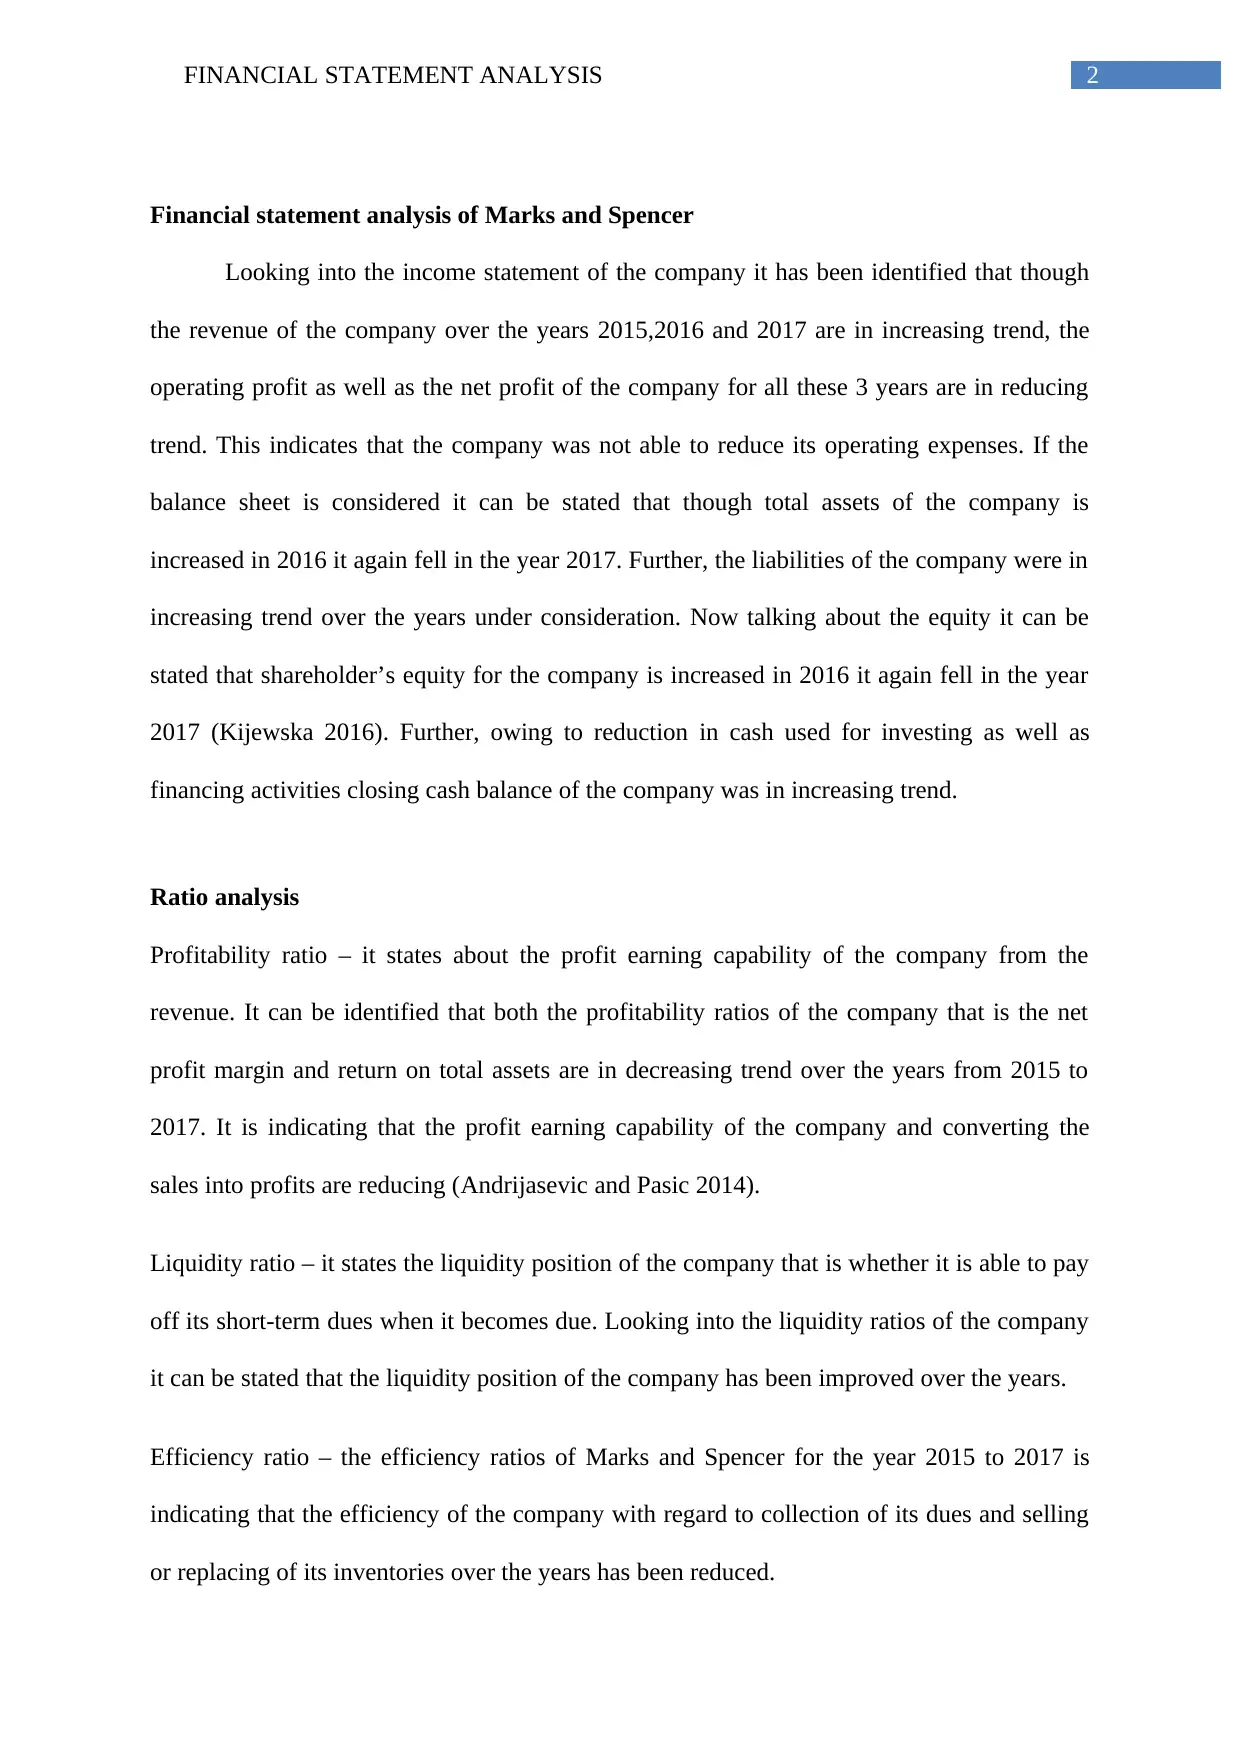
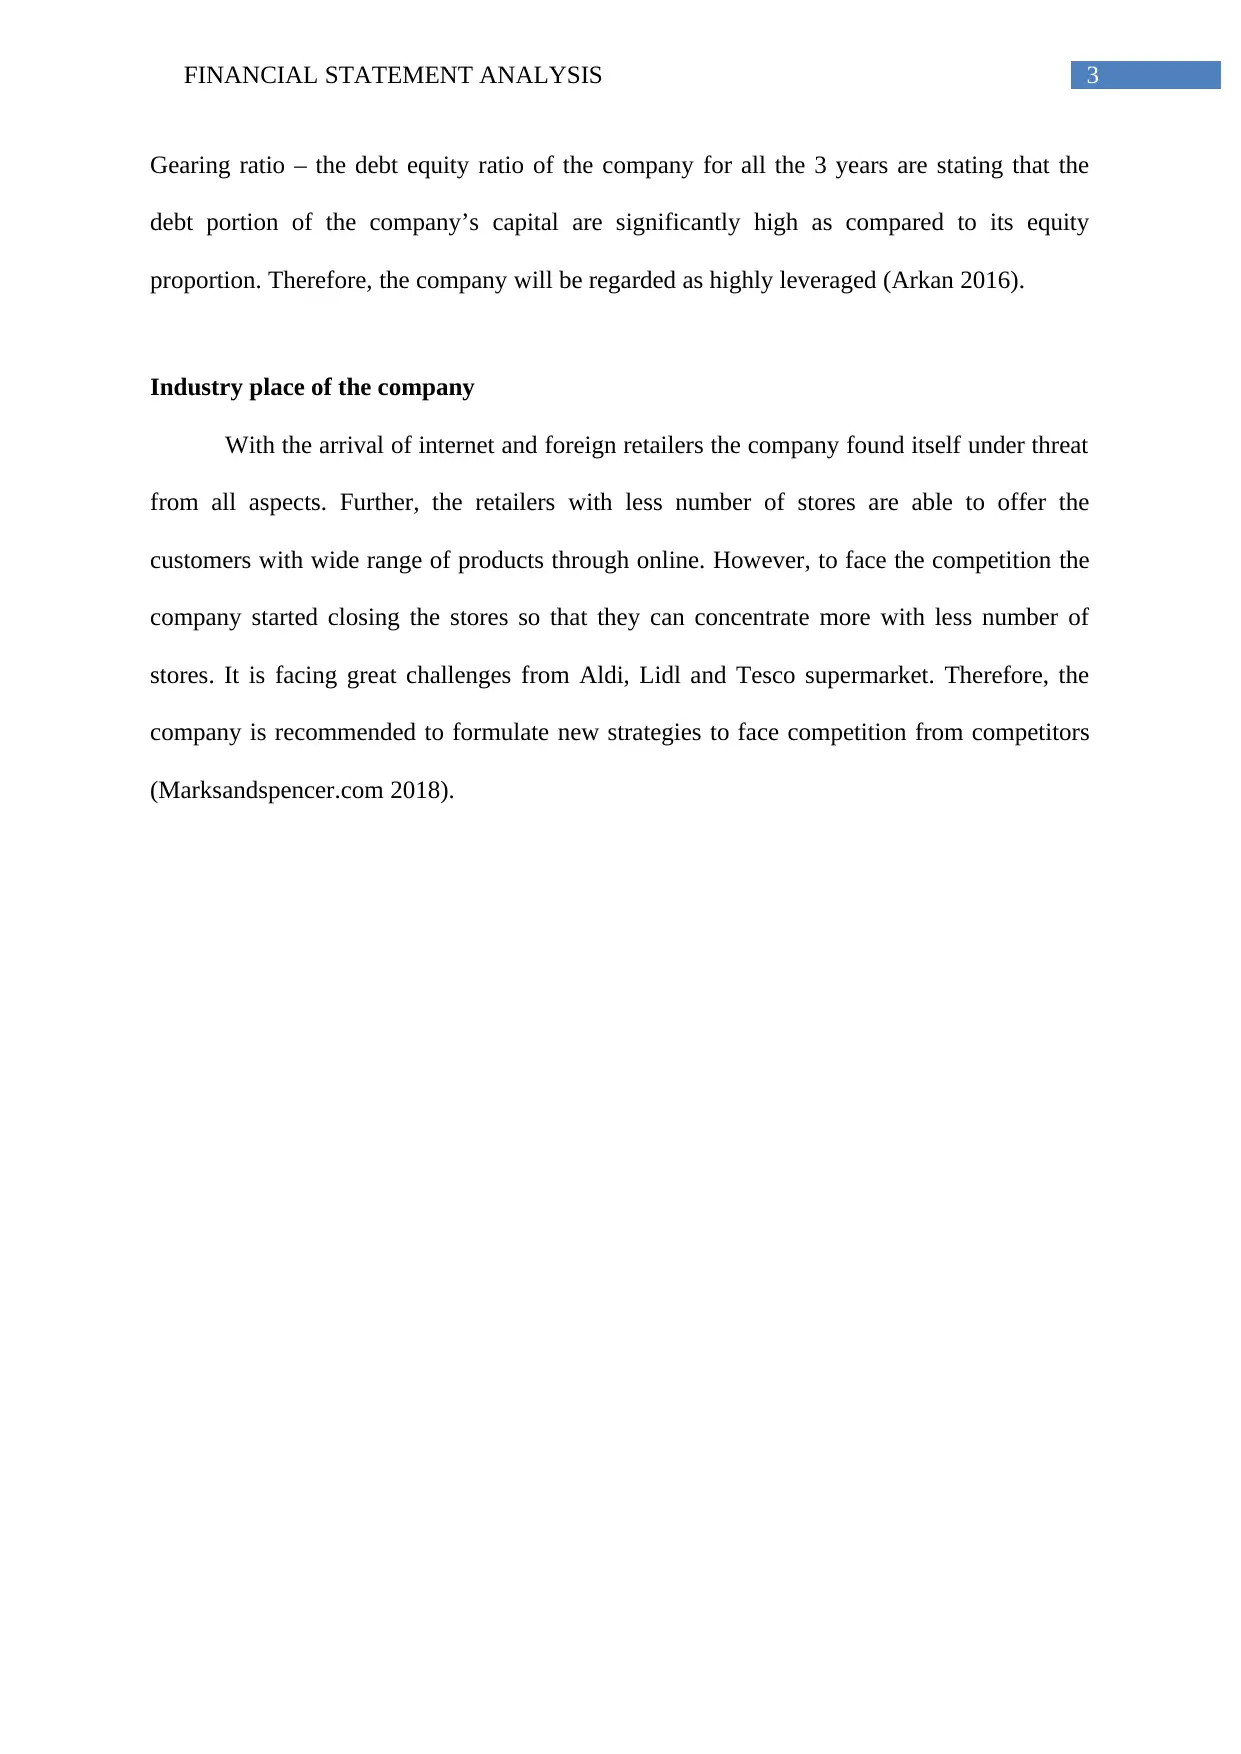
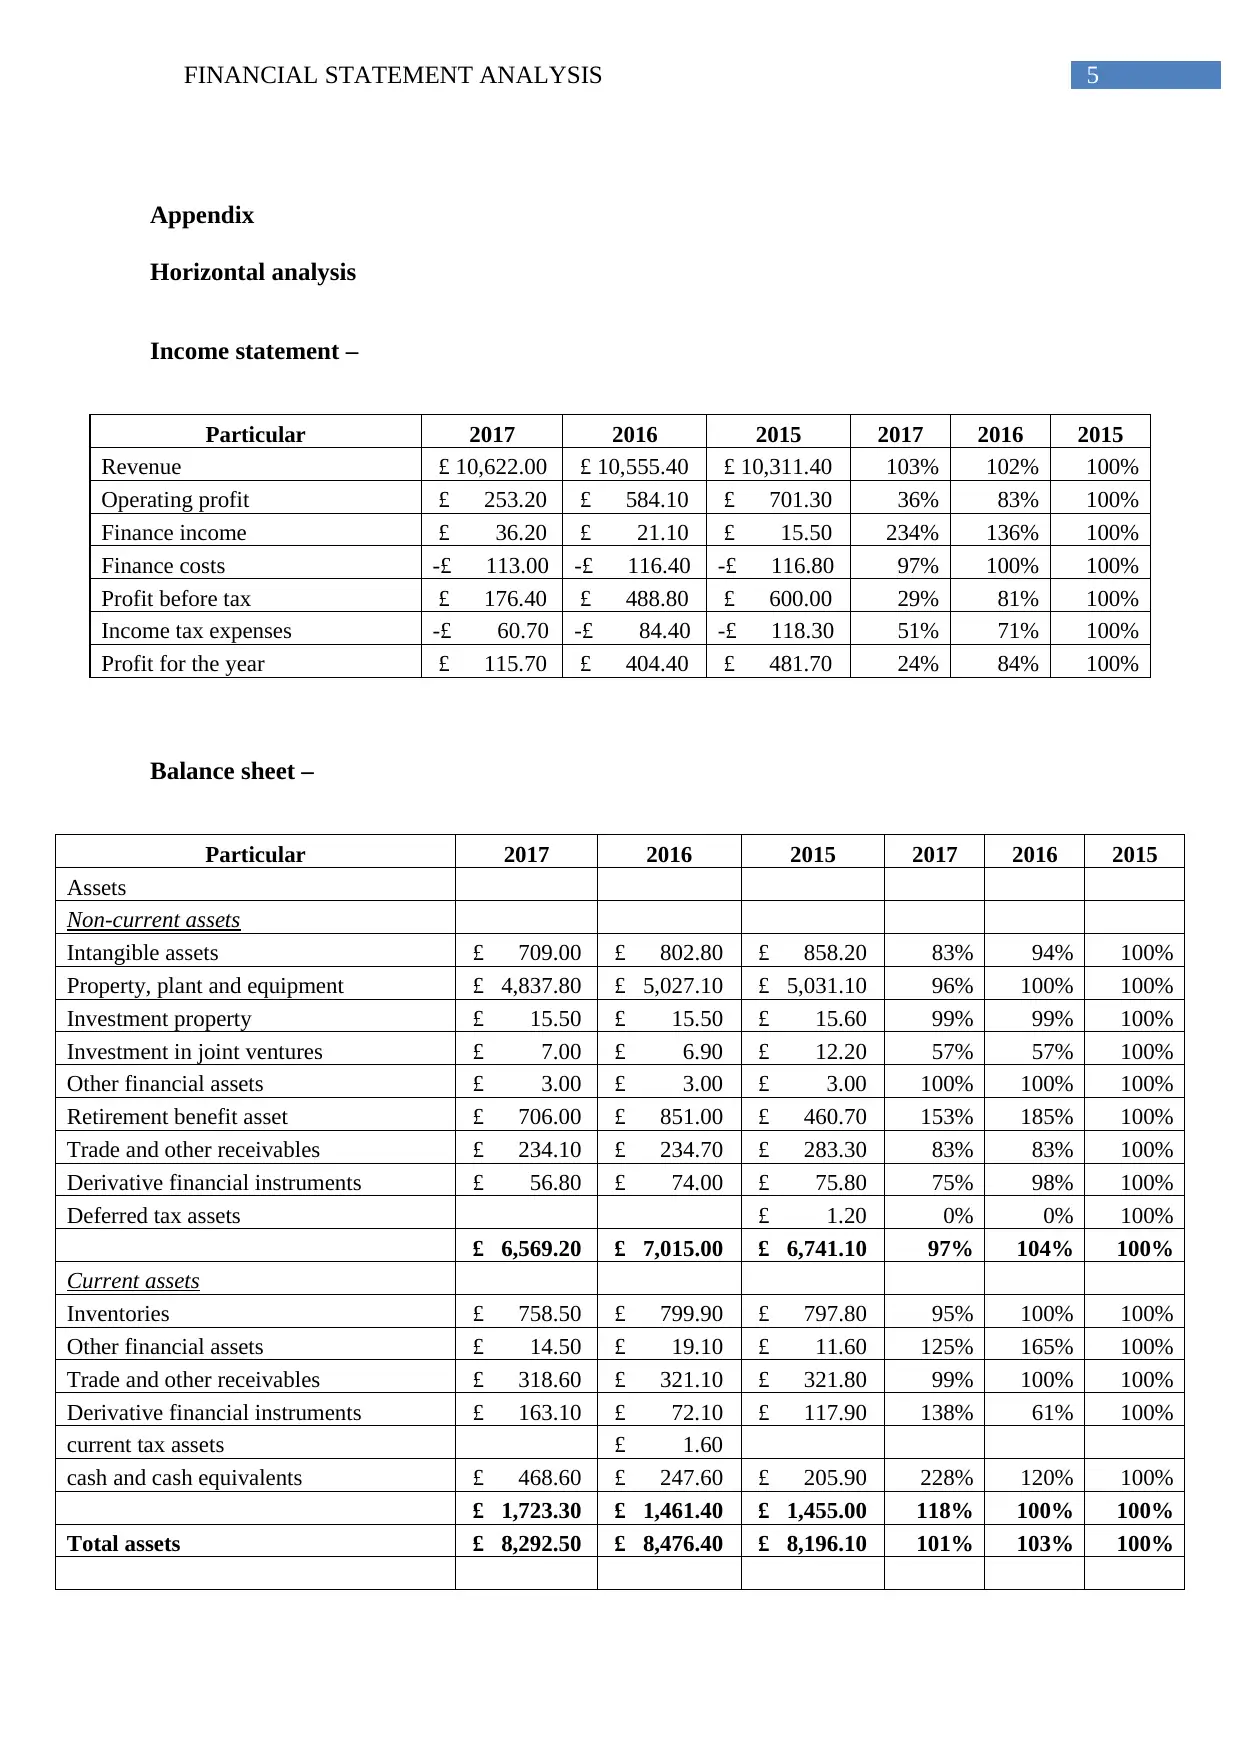
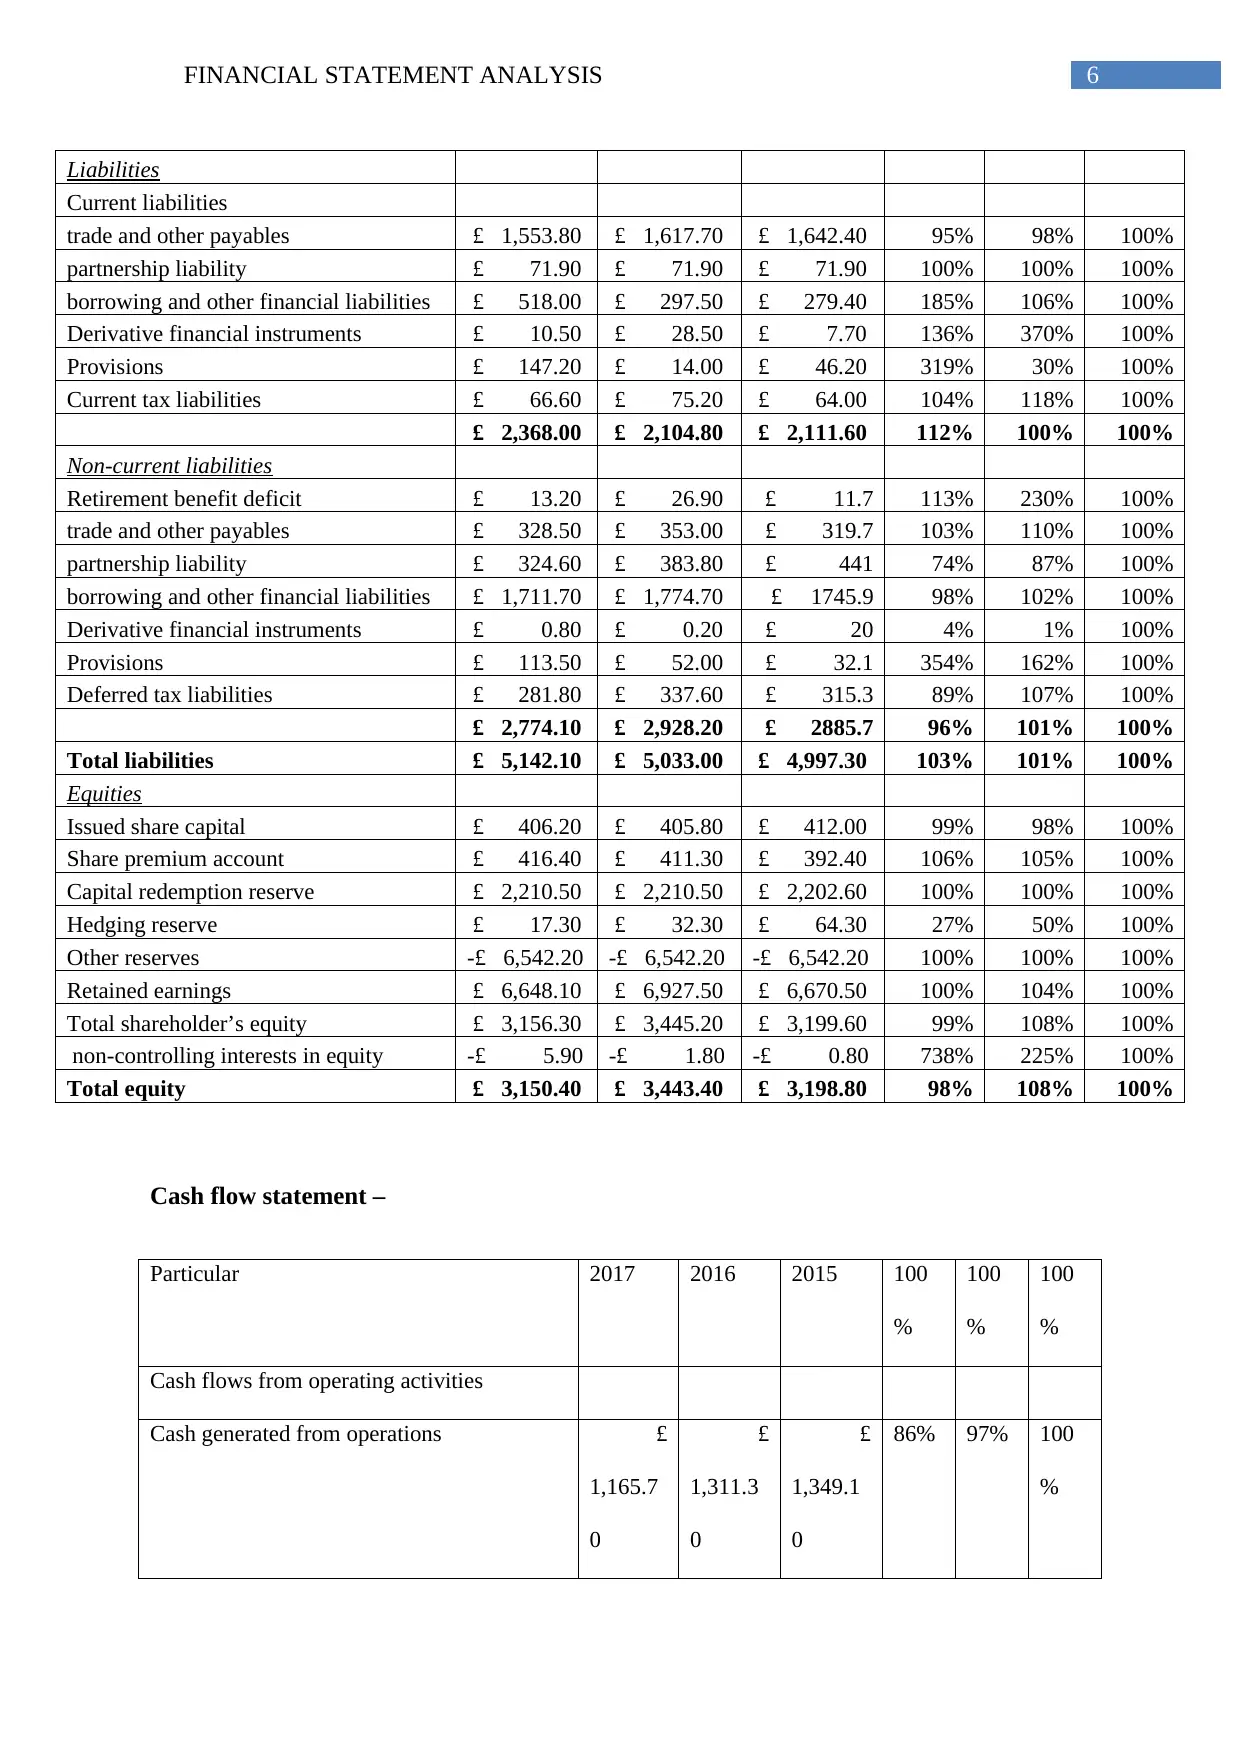
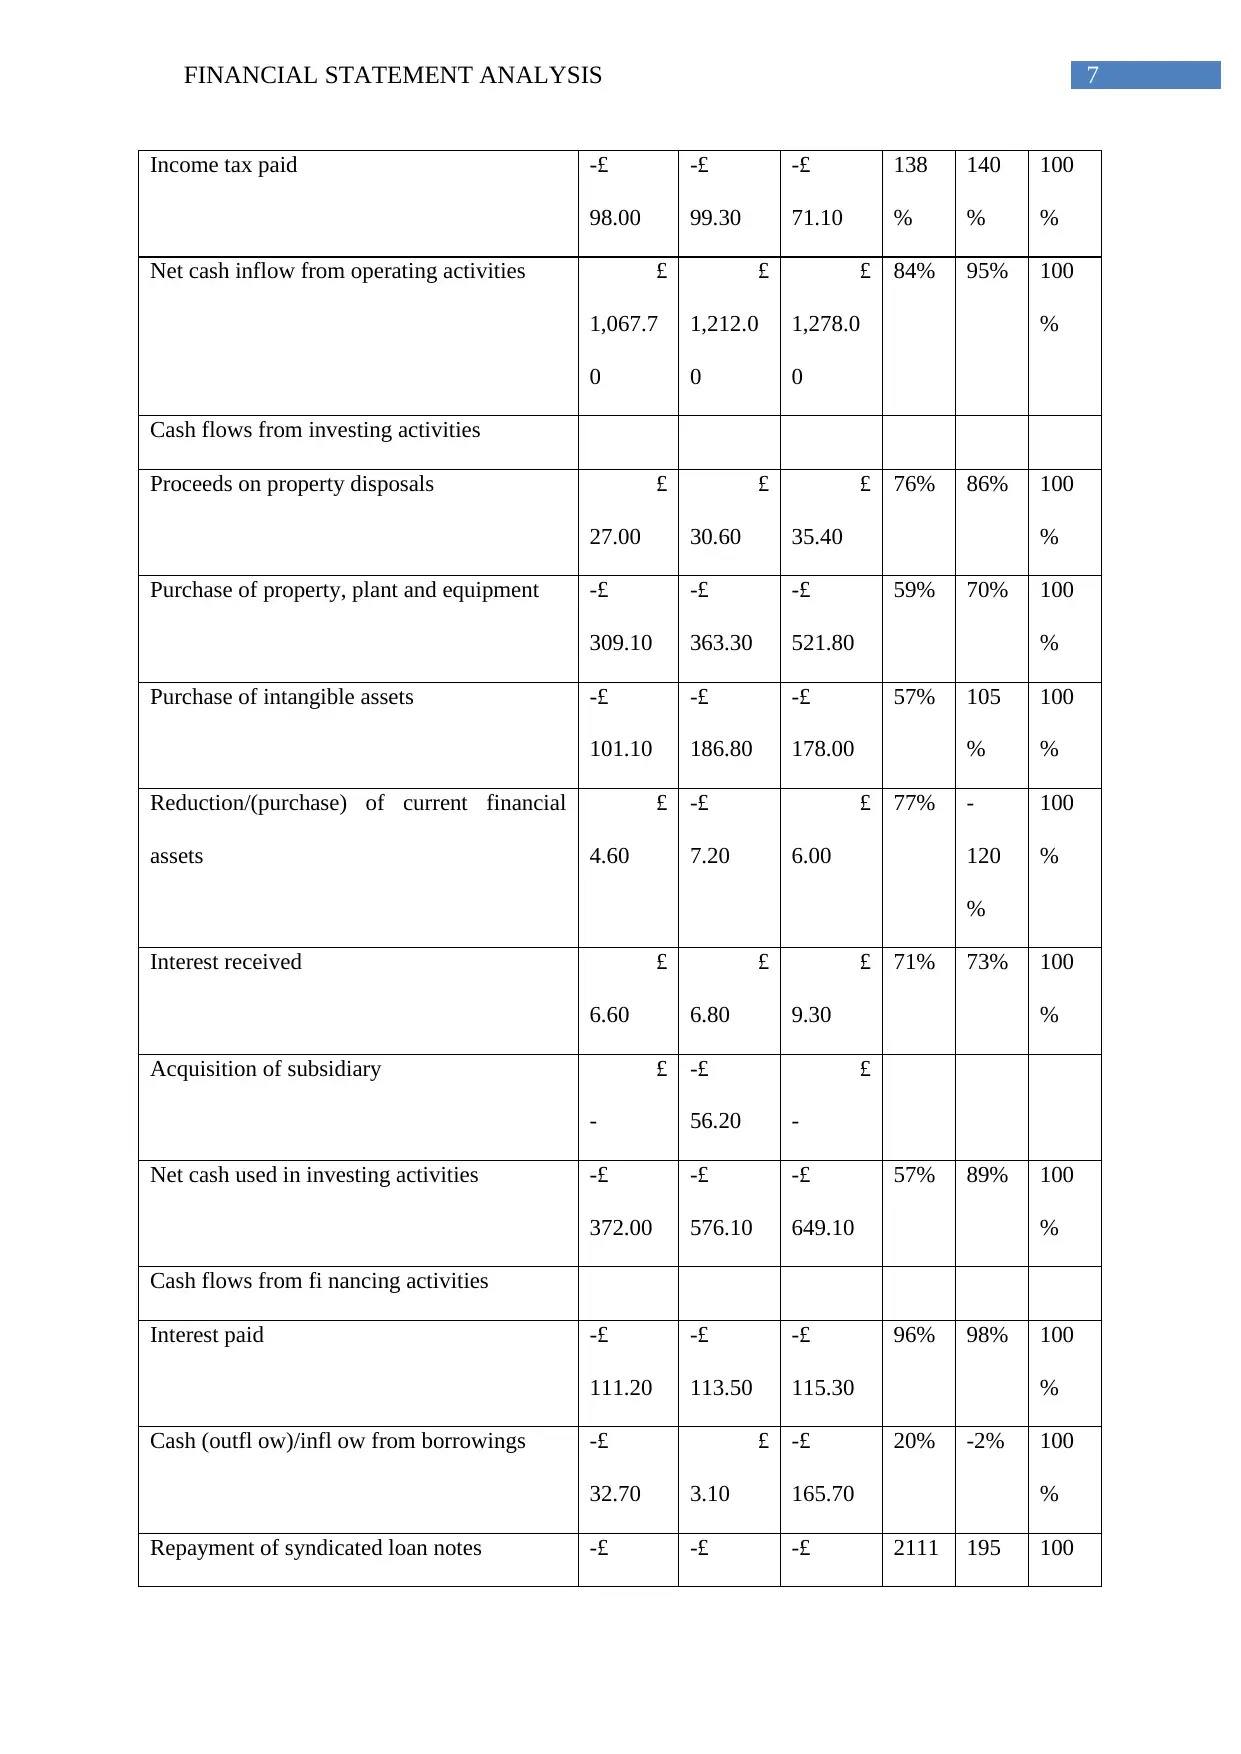
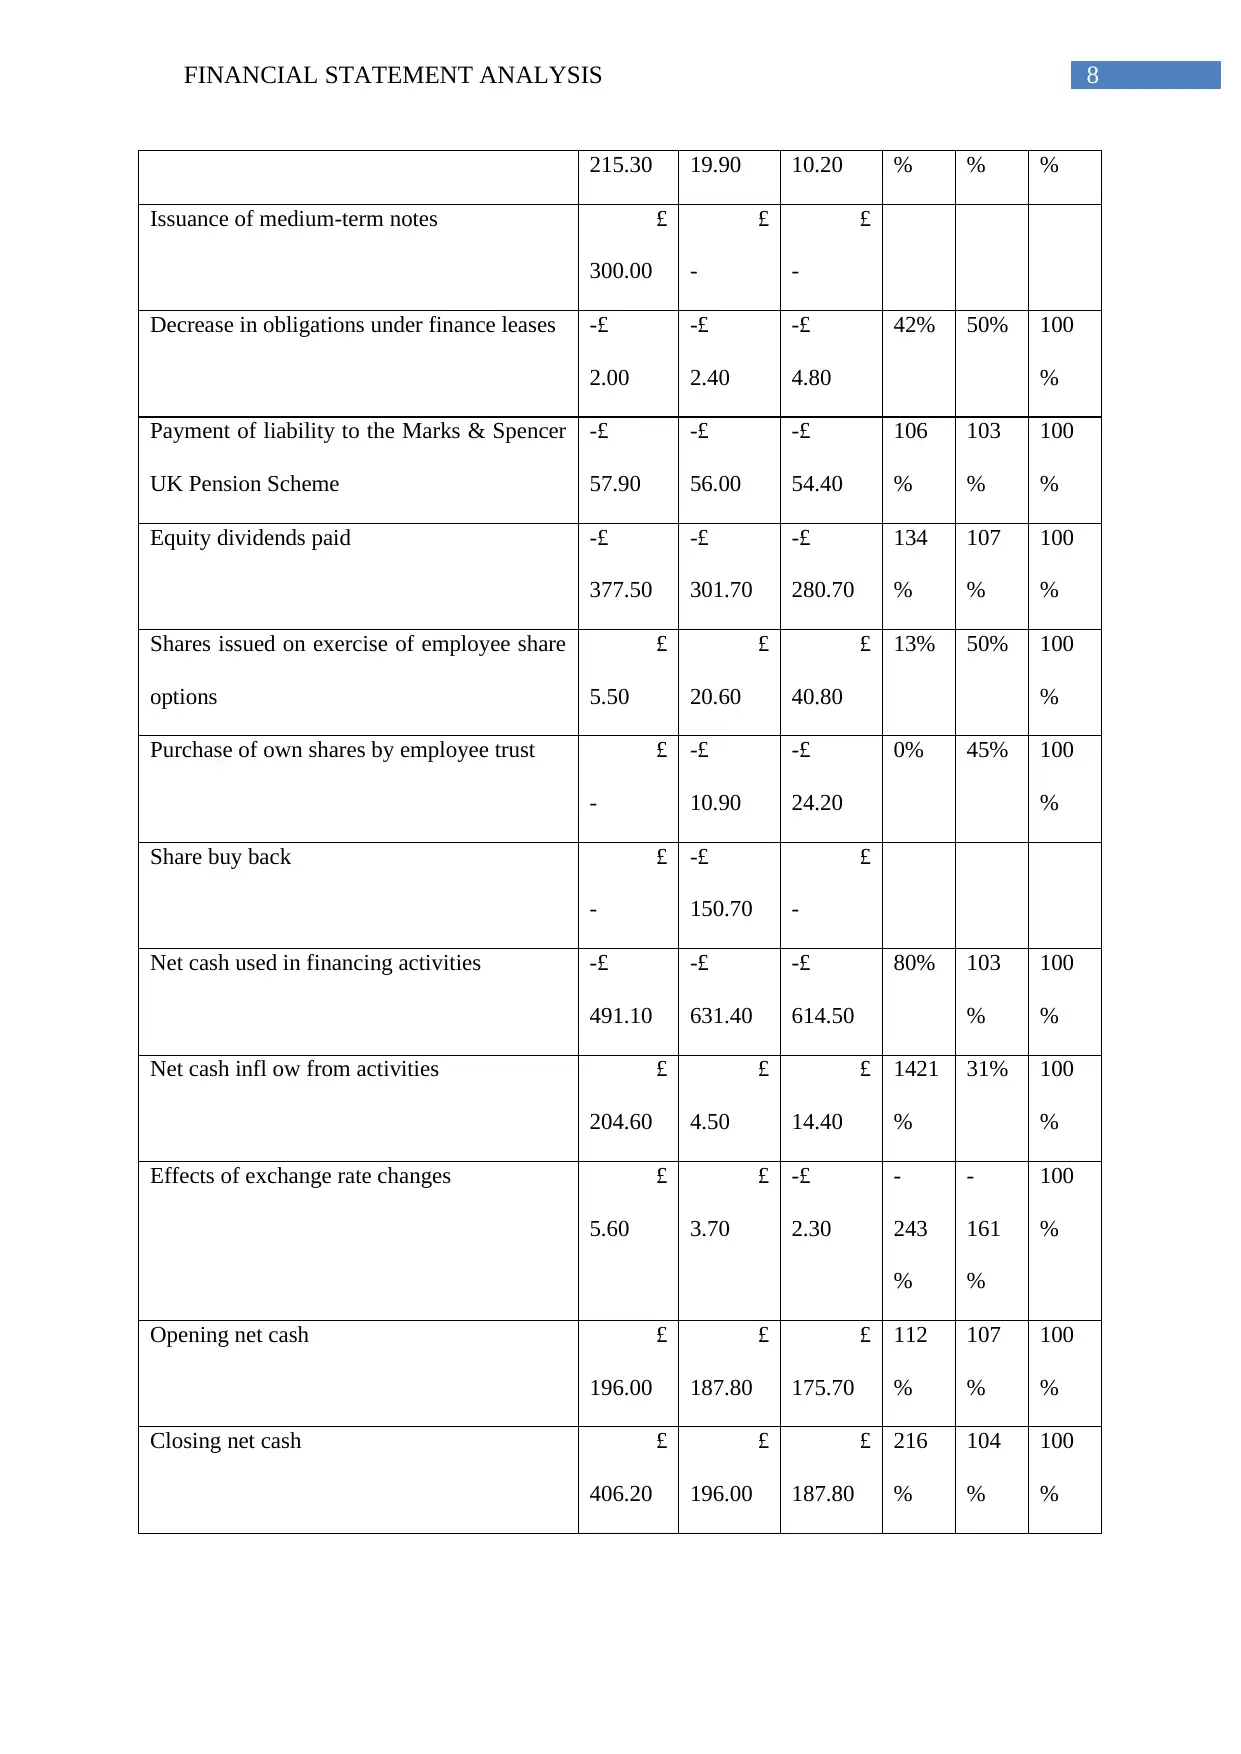
This report provides a financial statement analysis of Marks and Spencer, examining the company's income statement, balance sheet, and cash flow statement from 2015 to 2017. The analysis reveals that while the company's revenue increased, its operating and net profits decreased due to rising operating expenses. Key financial ratios, including profitability, liquidity, efficiency, and gearing ratios, are analyzed to assess the company's financial health. Profitability ratios indicate a decline in profit-earning capability, while liquidity ratios show improvement. Efficiency ratios suggest reduced efficiency in collecting dues and managing inventories, and the gearing ratio indicates high leverage. The report also discusses the challenges Marks and Spencer faces from online retailers and competitors like Aldi, Lidl, and Tesco, recommending new strategies to enhance competitiveness. The appendix includes horizontal analyses of the income statement and balance sheet, along with detailed ratio calculations.
Document Page
Running head: FINANCIAL STATEMENT ANALYSIS
Financial statement analysis
Name of the student
Name of the university
Student ID
Author note
tabler-icon-diamond-filled.svg

Paraphrase This Document

Need a fresh take? Get an instant paraphrase of this document with our AI Paraphraser
Document Page
1FINANCIAL STATEMENT ANALYSIS
Table of Contents
Financial statement analysis of Marks and Spencer..................................................................2
Ratio analysis.............................................................................................................................2
Industry place of the company...................................................................................................3
Reference....................................................................................................................................4
Appendix....................................................................................................................................5
Document Page
2FINANCIAL STATEMENT ANALYSIS
Financial statement analysis of Marks and Spencer
Looking into the income statement of the company it has been identified that though
the revenue of the company over the years 2015,2016 and 2017 are in increasing trend, the
operating profit as well as the net profit of the company for all these 3 years are in reducing
trend. This indicates that the company was not able to reduce its operating expenses. If the
balance sheet is considered it can be stated that though total assets of the company is
increased in 2016 it again fell in the year 2017. Further, the liabilities of the company were in
increasing trend over the years under consideration. Now talking about the equity it can be
stated that shareholder’s equity for the company is increased in 2016 it again fell in the year
2017 (Kijewska 2016). Further, owing to reduction in cash used for investing as well as
financing activities closing cash balance of the company was in increasing trend.
Ratio analysis
Profitability ratio – it states about the profit earning capability of the company from the
revenue. It can be identified that both the profitability ratios of the company that is the net
profit margin and return on total assets are in decreasing trend over the years from 2015 to
2017. It is indicating that the profit earning capability of the company and converting the
sales into profits are reducing (Andrijasevic and Pasic 2014).
Liquidity ratio – it states the liquidity position of the company that is whether it is able to pay
off its short-term dues when it becomes due. Looking into the liquidity ratios of the company
it can be stated that the liquidity position of the company has been improved over the years.
Efficiency ratio – the efficiency ratios of Marks and Spencer for the year 2015 to 2017 is
indicating that the efficiency of the company with regard to collection of its dues and selling
or replacing of its inventories over the years has been reduced.
Document Page
3FINANCIAL STATEMENT ANALYSIS
Gearing ratio – the debt equity ratio of the company for all the 3 years are stating that the
debt portion of the company’s capital are significantly high as compared to its equity
proportion. Therefore, the company will be regarded as highly leveraged (Arkan 2016).
Industry place of the company
With the arrival of internet and foreign retailers the company found itself under threat
from all aspects. Further, the retailers with less number of stores are able to offer the
customers with wide range of products through online. However, to face the competition the
company started closing the stores so that they can concentrate more with less number of
stores. It is facing great challenges from Aldi, Lidl and Tesco supermarket. Therefore, the
company is recommended to formulate new strategies to face competition from competitors
(Marksandspencer.com 2018).
tabler-icon-diamond-filled.svg

Paraphrase This Document

Need a fresh take? Get an instant paraphrase of this document with our AI Paraphraser
Document Page
4FINANCIAL STATEMENT ANALYSIS
Reference
Andrijasevic, M. and Pasic, V., 2014. A blueprint of ratio analysis as information basis of
Corporation financial management. Problems of Management in the 21st Century, 9(2),
pp.117-123.
Arkan, T., 2016. The importance of financial ratios in predicting stock price trends: A case
study in emerging markets. Finanse. Rynki Finansowe, Ubezpieczenia, (1), p.79.
Kijewska, A., 2016. Determinants of the return on equity ratio (ROE) on the example of
companies from metallurgy and mining sector in Poland. Metalurgija, 55(2), pp.285-288.
Marksandspencer.com., 2018. Welcome to Marks & Spencer. [online] Available at:
https://www.marksandspencer.com/ [Accessed 29 Jun. 2018].
Document Page
5FINANCIAL STATEMENT ANALYSIS
Appendix
Horizontal analysis
Income statement –
Particular 2017 2016 2015 2017 2016 2015
Revenue £ 10,622.00 £ 10,555.40 £ 10,311.40 103% 102% 100%
Operating profit £ 253.20 £ 584.10 £ 701.30 36% 83% 100%
Finance income £ 36.20 £ 21.10 £ 15.50 234% 136% 100%
Finance costs 113.00 116.40 116.80 97% 100% 100%
Profit before tax £ 176.40 £ 488.80 £ 600.00 29% 81% 100%
Income tax expenses 60.70 84.40 118.30 51% 71% 100%
Profit for the year £ 115.70 £ 404.40 £ 481.70 24% 84% 100%
Balance sheet –
Particular 2017 2016 2015 2017 2016 2015
Assets
Non-current assets
Intangible assets £ 709.00 £ 802.80 £ 858.20 83% 94% 100%
Property, plant and equipment £ 4,837.80 £ 5,027.10 £ 5,031.10 96% 100% 100%
Investment property £ 15.50 £ 15.50 £ 15.60 99% 99% 100%
Investment in joint ventures £ 7.00 £ 6.90 £ 12.20 57% 57% 100%
Other financial assets £ 3.00 £ 3.00 £ 3.00 100% 100% 100%
Retirement benefit asset £ 706.00 £ 851.00 £ 460.70 153% 185% 100%
Trade and other receivables £ 234.10 £ 234.70 £ 283.30 83% 83% 100%
Derivative financial instruments £ 56.80 £ 74.00 £ 75.80 75% 98% 100%
Deferred tax assets £ 1.20 0% 0% 100%
£ 6,569.20 £ 7,015.00 £ 6,741.10 97% 104% 100%
Current assets
Inventories £ 758.50 £ 799.90 £ 797.80 95% 100% 100%
Other financial assets £ 14.50 £ 19.10 £ 11.60 125% 165% 100%
Trade and other receivables £ 318.60 £ 321.10 £ 321.80 99% 100% 100%
Derivative financial instruments £ 163.10 £ 72.10 £ 117.90 138% 61% 100%
current tax assets £ 1.60
cash and cash equivalents £ 468.60 £ 247.60 £ 205.90 228% 120% 100%
£ 1,723.30 £ 1,461.40 £ 1,455.00 118% 100% 100%
Total assets £ 8,292.50 £ 8,476.40 £ 8,196.10 101% 103% 100%
Document Page
6FINANCIAL STATEMENT ANALYSIS
Liabilities
Current liabilities
trade and other payables £ 1,553.80 £ 1,617.70 £ 1,642.40 95% 98% 100%
partnership liability £ 71.90 £ 71.90 £ 71.90 100% 100% 100%
borrowing and other financial liabilities £ 518.00 £ 297.50 £ 279.40 185% 106% 100%
Derivative financial instruments £ 10.50 £ 28.50 £ 7.70 136% 370% 100%
Provisions £ 147.20 £ 14.00 £ 46.20 319% 30% 100%
Current tax liabilities £ 66.60 £ 75.20 £ 64.00 104% 118% 100%
£ 2,368.00 £ 2,104.80 £ 2,111.60 112% 100% 100%
Non-current liabilities
Retirement benefit deficit £ 13.20 £ 26.90 £ 11.7 113% 230% 100%
trade and other payables £ 328.50 £ 353.00 £ 319.7 103% 110% 100%
partnership liability £ 324.60 £ 383.80 £ 441 74% 87% 100%
borrowing and other financial liabilities £ 1,711.70 £ 1,774.70 £ 1745.9 98% 102% 100%
Derivative financial instruments £ 0.80 £ 0.20 £ 20 4% 1% 100%
Provisions £ 113.50 £ 52.00 £ 32.1 354% 162% 100%
Deferred tax liabilities £ 281.80 £ 337.60 £ 315.3 89% 107% 100%
£ 2,774.10 £ 2,928.20 £ 2885.7 96% 101% 100%
Total liabilities £ 5,142.10 £ 5,033.00 £ 4,997.30 103% 101% 100%
Equities
Issued share capital £ 406.20 £ 405.80 £ 412.00 99% 98% 100%
Share premium account £ 416.40 £ 411.30 £ 392.40 106% 105% 100%
Capital redemption reserve £ 2,210.50 £ 2,210.50 £ 2,202.60 100% 100% 100%
Hedging reserve £ 17.30 £ 32.30 £ 64.30 27% 50% 100%
Other reserves 6,542.20 6,542.20 6,542.20 100% 100% 100%
Retained earnings £ 6,648.10 £ 6,927.50 £ 6,670.50 100% 104% 100%
Total shareholder’s equity £ 3,156.30 £ 3,445.20 £ 3,199.60 99% 108% 100%
non-controlling interests in equity 5.90 1.80 0.80 738% 225% 100%
Total equity £ 3,150.40 £ 3,443.40 £ 3,198.80 98% 108% 100%
Cash flow statement –
Particular 2017 2016 2015 100
%
100
%
100
%
Cash flows from operating activities
Cash generated from operations £
1,165.7
0
£
1,311.3
0
£
1,349.1
0
86% 97% 100
%
tabler-icon-diamond-filled.svg

Paraphrase This Document

Need a fresh take? Get an instant paraphrase of this document with our AI Paraphraser
Document Page
7FINANCIAL STATEMENT ANALYSIS
Income tax paid
98.00

99.30

71.10
138
%
140
%
100
%
Net cash inflow from operating activities £
1,067.7
0
£
1,212.0
0
£
1,278.0
0
84% 95% 100
%
Cash flows from investing activities
Proceeds on property disposals £
27.00
£
30.60
£
35.40
76% 86% 100
%
Purchase of property, plant and equipment
309.10

363.30

521.80
59% 70% 100
%
Purchase of intangible assets
101.10

186.80

178.00
57% 105
%
100
%
Reduction/(purchase) of current financial
assets
£
4.60

7.20
£
6.00
77% -
120
%
100
%
Interest received £
6.60
£
6.80
£
9.30
71% 73% 100
%
Acquisition of subsidiary £
-

56.20
£
-
Net cash used in investing activities
372.00

576.10

649.10
57% 89% 100
%
Cash flows from fi nancing activities
Interest paid
111.20

113.50

115.30
96% 98% 100
%
Cash (outfl ow)/infl ow from borrowings
32.70
£
3.10

165.70
20% -2% 100
%
Repayment of syndicated loan notes 2111 195 100
Document Page
8FINANCIAL STATEMENT ANALYSIS
215.30 19.90 10.20 % % %
Issuance of medium-term notes £
300.00
£
-
£
-
Decrease in obligations under finance leases
2.00

2.40

4.80
42% 50% 100
%
Payment of liability to the Marks & Spencer
UK Pension Scheme

57.90

56.00

54.40
106
%
103
%
100
%
Equity dividends paid
377.50

301.70

280.70
134
%
107
%
100
%
Shares issued on exercise of employee share
options
£
5.50
£
20.60
£
40.80
13% 50% 100
%
Purchase of own shares by employee trust £
-

10.90

24.20
0% 45% 100
%
Share buy back £
-

150.70
£
-
Net cash used in financing activities
491.10

631.40

614.50
80% 103
%
100
%
Net cash infl ow from activities £
204.60
£
4.50
£
14.40
1421
%
31% 100
%
Effects of exchange rate changes £
5.60
£
3.70

2.30
-
243
%
-
161
%
100
%
Opening net cash £
196.00
£
187.80
£
175.70
112
%
107
%
100
%
Closing net cash £
406.20
£
196.00
£
187.80
216
%
104
%
100
%
Document Page
9FINANCIAL STATEMENT ANALYSIS
Ratio –
Ratio Formula 2017 2016 2015
Profitability ratio
Net profit margin Net profit / revenue *100 1.09 3.83 4.67
Return on total asset Net profit / total assets *100 1.40 4.77 5.88
Liquidity ratio
Current ratio Current assets/current liability 0.73 0.69 0.69
Quick ratio Quick assets/ current liability 0.41 0.31 0.31
Efficiency ratio
Account receivable
ratio Sales/average receivables 33.21 32.84 32.67
Inventory turnover ratio COGS/average inventories 13.31 12.48 11.70
Gearing ratio
Debt equity ratio Total liabilities/shareholder's equity 1.63 1.46 1.56
Profitability ratio
Net profit margin
Return on total asset
Liquidity ratio
Current ratio
Quick ratio
Efficiency ratio
Account receivable ratio
Inventory turnover ratio
Gearing ratio
Debt equity ratio
0
5
10
15
20
25
30
35
2017
2016
2015
chevron_up_icon
1 out of 10
circle_padding
hide_on_mobile
zoom_out_icon
[object Object]