Detailed Solutions to Mathematics Questions and Calculations

Verified

Added on  2023/06/18

|9
|720
|449
Homework Assignment
AI Summary
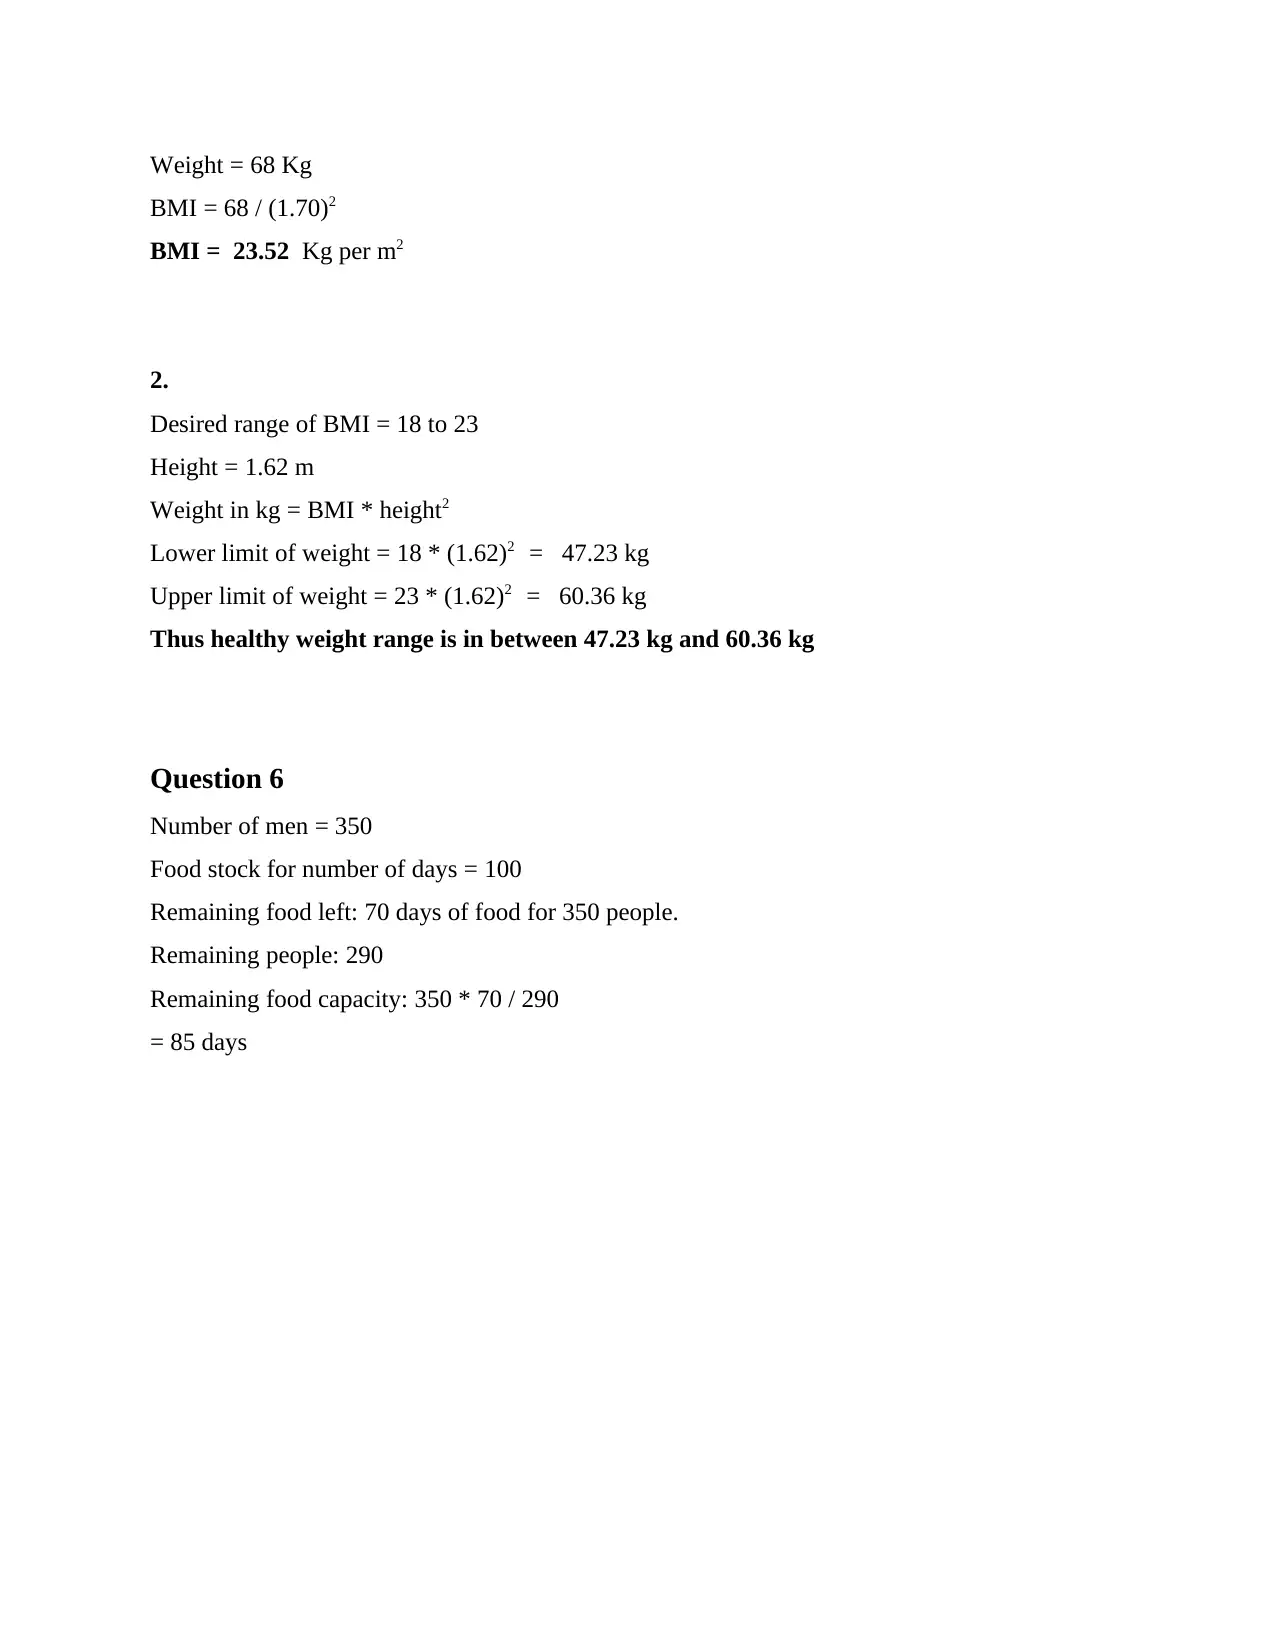
This mathematics assignment solution covers a range of problems including statistical analysis of cafe data, algebraic simplification, population density calculations, BMI determination, and food stock management. The statistical analysis involves calculating the combined mean, median, and quartiles, identifying outliers using the IQR method, and creating box plots. The algebraic problem focuses on simplifying a complex expression with exponents. The population density section involves calculating growth rates and determining population equality conditions. The BMI section calculates BMI based on given height and weight, and determines the healthy weight range for a given height. Finally, the food stock problem involves calculating the number of days food will last for a reduced group of people. Desklib offers this and many more solved assignments to help students excel.
Document Page
MATHEMATICS QUESTIONS
tabler-icon-diamond-filled.svg

Paraphrase This Document

Need a fresh take? Get an instant paraphrase of this document with our AI Paraphraser
Document Page
TABLE OF CONTENTS
QUESTION 1...................................................................................................................................2
QUESTION 2...................................................................................................................................6
QUESTION 3...................................................................................................................................6
QUESTION 4...................................................................................................................................7
Question 6........................................................................................................................................7
Document Page
QUESTION 1
Cafe 1
Time
spent in
cafe
( minute)
10
12
15
25
30
1
94
21
8
Cafe 2
Shopping
time
( minute) Item shop
22 Cake
12 Savoury snack
16 Savoury snack
18 Savoury snack
19 Savoury snack
25 Cake
18 Savoury snack
39 Drink
15 Savoury snack
37 Drink
33 Cake
15 Savoury snack
36 Drink
18 Savoury snack
38 Drink
39 Cake
Document Page
16 Savoury snack
39 Drink
14 Savoury snack
11 Drink
1.Combined mean: Cafe A + B
S. No.
Cafe A + B
(Shopping
time: in
minutes)
1 10
2 12
3 15
4 25
5 30
6 1
7 94
8 21
9 8
10 22
11 12
12 16
13 18
14 19
15 25
16 18
17 39
18 15
19 37
20 33
21 15
22 36
23 18
24 38
25 39
26 16
27 39
tabler-icon-diamond-filled.svg

Paraphrase This Document

Need a fresh take? Get an instant paraphrase of this document with our AI Paraphraser
Document Page
28 14
29 11
Mean = ∑x / n
= 696 / 29
= 24 minute
2.
Shopping
time (in
minutes)
1
8
10
12
15
21
25
30
94
Data of cafe 1 in ascending manner:
Median = (N + 1) / 2
= (9 + 1)/ 2
= 5
As per the 5th item median time in shopping is 15 minutes.
Computation of quartile is enumerated below:
Particulars Figures
Quartile 1 10
Quartile 2 15
Quartile 3 25
3.
Lower outlier = Q1 – (1.5 * IQR)
= 10 – (1.5 * 15)
Document Page
= 10 – 22.5
= -12.5
Higher outlier = Q3 + (1.5 * IQR)
= 25 + (1.5 * 15)
= 25 + 22.5
= 47.5
4.
Box plot lead to supermarket 1 and 2 is stated below:
Labels
Sample 1
(Supermarket 1)
Sample 2
(Supermarket 2)
Min 1 11
Q1 10 15.25
Median 15 18.5
Q3 25 36.85
Max 94 39
IQR 15 20.5
Upper Outliers 1 0
Lower Outliers 0 0
Document Page
QUESTION 2
(ab)^2 (a2b3)^5 / (a4 b2)^7
= (a^8b^8) (a^10 b^15) / (a^28 b^14)
= (a^18 b^23) / (a^28 b^14)
= a^-10 b^9
= b^9 / a^10
QUESTION 3
Population density
Year France Spain
1950 200 60
2014 280 150
tabler-icon-diamond-filled.svg

Paraphrase This Document

Need a fresh take? Get an instant paraphrase of this document with our AI Paraphraser
Document Page
0
50
100
150
200
250
300
France Spain
Year 1950
Year 2014
2. Rate of growth between the years 1950 and 2014:
Spain: [80/200]*100 = 40% growth
France: [90/60]*100 = 150% growth
3.
Population density D is determined in the form of ratio of Population P and area A in kilometre
square. France and Spain are approximately equal in size but France is 9% larger. Thus for
making population density equal for both:
PF population of France
PS population of Spain
AF area of France
AS area of Spain
AF = 109% of AS
Population density D = P/A
PF / [109 AS /100] = PS / AS
So the population density would equal when population of Spain is 100/109 times of population
of France
(100/109) PF = PS
QUESTION 4
1.
BMI = Mass / height2
Height = 1.70 m
Document Page
Weight = 68 Kg
BMI = 68 / (1.70)2
BMI = 23.52 Kg per m2
2.
Desired range of BMI = 18 to 23
Height = 1.62 m
Weight in kg = BMI * height2
Lower limit of weight = 18 * (1.62)2 = 47.23 kg
Upper limit of weight = 23 * (1.62)2 = 60.36 kg
Thus healthy weight range is in between 47.23 kg and 60.36 kg
Question 6
Number of men = 350
Food stock for number of days = 100
Remaining food left: 70 days of food for 350 people.
Remaining people: 290
Remaining food capacity: 350 * 70 / 290
= 85 days
chevron_up_icon
1 out of 9
circle_padding
hide_on_mobile
zoom_out_icon
[object Object]